Table of Contents
Can You Drink Tap Water in Ventura?
Yes, Ventura's tap water is generally considered safe to drink as Ventura has no active health based violations of the Safe Drinking Water Act (SDWA) that we are aware of. Other factors such as lead piping in a home, or low levels of pollutants on immunocompromised individuals, should also be considered, however. To find more recent info we might have, you can check out our boil water notice page, the city's water provider website, or Ventura's local Twitter account.
According the EPA’s ECHO database, from April 30, 2019 to June 30, 2022, Ventura's water utility, Ventura Water Department, had 0 violations of the Safe Drinking Water Act. For more details on the violations, please see our violation history section below. The last violation for Ventura was resolved on Sept. 30, 2018. This assessment is based on the Ventura Water Department water system, other water systems in the city may have different results.
While tap water that meets the EPA health guidelines generally won’t make you sick to your stomach, it can still contain regulated and unregulated contaminants present in trace amounts that could potentially cause health issues over the long-run. These trace contaminants may also impact immunocompromised and vulnerable individuals.
The EPA is reviewing if it’s current regulations around pollutant levels in tap water are strict enough, and the health dangers posed by unregulated pollutants, like PFAS.
Water Quality Report for Ventura Tap Water
The most recent publicly available numbers for measured contaminant levels in Ventura tap water are in its 2020 Water Quality Report. As you can see, there are levels which the EPA considers to be acceptable, but being below the maximum allowable level doesn’t necessarily mean the water is healthy.
Lead in tap water, for example, is currently allowed at up to 15ppb by the EPA, but it has set the ideal goal for lead at zero. This highlights how meeting EPA standards doesn’t necessarily mean local tap water is healthy.
EPA regulations continue to change as it evaluates the long term impacts of chemicals and updates drinking water acceptable levels. The rules around arsenic, as well as, lead and copper are currently being re-evaluated.
There are also a number of "emerging" contaminants that are not currently. For example, PFAS (Per- and polyfluoroalkyl substances), for which the EPA has issued a health advisory. PFAS are called "forever chemicals" since they tend not to break down in the environment or the human body and can accumulate over time.
We recommend looking at the contaminants present in Ventura's water quality reports, or getting your home's tap water tested to see if you should be filtering your water.
Ventura Tap Water Safe Drinking Water Act Violation History - Prior 10 Years
Below is a ten year history of violations for the water system named Ventura Water Department for Ventura in California. For more details please see the "What do these Violations Mean?" section below.
From July 1, 2018 to Sept. 30, 2018, Ventura had 1 health-based Safe Drinking Water Act violation with the violation category being Maximum Contaminant Level Violation, more specifically, the violation code was Maximum Contaminant Level Violation, Average which falls into the Disinfectants and Disinfection Byproducts Rule rule code group, and the Stage 2 Disinfectants and Disinfection Byproducts Rule rule code family for the following contaminant code: TTHM.
From April 1, 2015 to June 30, 2015, Ventura had 1 health-based Safe Drinking Water Act violation with the violation category being Maximum Contaminant Level Violation, more specifically, the violation code was Maximum Contaminant Level Violation, Average which falls into the Disinfectants and Disinfection Byproducts Rule rule code group, and the Stage 2 Disinfectants and Disinfection Byproducts Rule rule code family for the following contaminant code: TTHM.
From Jan. 1, 2015 to March 31, 2015, Ventura had 1 health-based Safe Drinking Water Act violation with the violation category being Maximum Contaminant Level Violation, more specifically, the violation code was Maximum Contaminant Level Violation, Average which falls into the Disinfectants and Disinfection Byproducts Rule rule code group, and the Stage 2 Disinfectants and Disinfection Byproducts Rule rule code family for the following contaminant code: TTHM.
Is there Lead in Ventura Water?
Based on the EPA’s ECHO Database, 90% of the samples taken from the Ventura water system, Ventura Water Department, between sample start date and sample end date, were at or below, 0.0022 mg/L of lead in Ventura water. This is 14.7% of the 0.015 mg/L action level. This means 10% of the samples taken from Ventura contained more lead.
While Ventura water testing may have found 0.0022 mg/L of lead in its water, that does not mean your water source has the same amount. The amount of lead in water in a city can vary greatly from neighborhood to neighborhood, or even building to building. Many buildings, particularly older ones, have lead pipes or service lines which can be a source of contamination. To find out if your home has lead, we recommend getting you water tested.
No amount of lead in water is healthy, only less dangerous. As lead accumulates in our bodies over time, even exposure to relatively small amounts can have negative health effects. For more information, please check out our Lead FAQ page.
Are there PFAS in Ventura Tap Water?
Currently, testing tap water for PFAS isn’t mandated on a national level. We do have a list of military bases where there have been suspected or confirmed leaks. There appears to be at least one military base - Naval Construction Battalion Center Port Hueneme - near Ventura with suspected leaks.
With many potential sources of PFAS in tap water across the US, the best information we currently have about which cities have PFAS in their water is this ewg map, which you can check to see if Ventura has been evaluated for yet.
Our stance is better safe than sorry, and that it makes sense to try to purify the tap water just in case.
Ventura SDWA Violation History Table - Prior 10 Years
| Compliance Period | Status | Health-Based? | Category Code | Code | Rule Code | Contaminant Code | Rule Group Code | Rule Family Code |
|---|---|---|---|---|---|---|---|---|
| 07/01/2018 - 09/30/2018 | Resolved | Yes | Maximum Contaminant Level Violation (MCL) | Maximum Contaminant Level Violation, Average (02) | Stage 2 Disinfectants and Disinfection Byproducts Rule (220) | TTHM (2950) | Disinfectants and Disinfection Byproducts Rule (200) | Stage 2 Disinfectants and Disinfection Byproducts Rule (220) |
| 04/01/2015 - 06/30/2015 | Resolved | Yes | Maximum Contaminant Level Violation (MCL) | Maximum Contaminant Level Violation, Average (02) | Stage 2 Disinfectants and Disinfection Byproducts Rule (220) | TTHM (2950) | Disinfectants and Disinfection Byproducts Rule (200) | Stage 2 Disinfectants and Disinfection Byproducts Rule (220) |
| 01/01/2015 - 03/31/2015 | Resolved | Yes | Maximum Contaminant Level Violation (MCL) | Maximum Contaminant Level Violation, Average (02) | Stage 2 Disinfectants and Disinfection Byproducts Rule (220) | TTHM (2950) | Disinfectants and Disinfection Byproducts Rule (200) | Stage 2 Disinfectants and Disinfection Byproducts Rule (220) |
What do these Violations Mean?
Safe Drinking Water Act Violations categories split into two groups, health based, and non-health based. Generally, health based violations are more serious, though non-health based violations can also be cause for concern.
Health Based Violations
- Maximum contaminant levels (MCLs) - maximum allowed contaminant level was exceeded.
- Maximum residual disinfectant levels (MRDLs) - maximum allowed disinfectant level was exceeded.
- Other violations (Other) - the exact required process to reduce the amounts of contaminants in drinking water was not followed.
Non-Health Based Violations
- Monitoring and reporting violations (MR, MON) - failure to conduct the required regular monitoring of drinking water quality, and/or to submit monitoring results on time.
- Public notice violations (Other) - failure to immediately alert consumers if there is a serious problem with their drinking water that may pose a risk to public health.
- Other violations (Other) - miscellaneous violations, such as failure to issue annual consumer confidence reports or maintain required records.
SDWA Table Key
| Field | Description |
|---|---|
| Compliance Period | Dates of the compliance period. |
| Status |
Current status of the violation.
|
| Health-Based? | Whether the violation is health based. |
| Category Code |
The category of violation that is reported.
|
| Code | A full description of violation codes can be accessed in the SDWA_REF_CODE_VALUES (CSV) table. |
| Contaminant Code | A code value that represents a contaminant for which a public water system has incurred a violation of a primary drinking water regulation. |
| Rule Code |
Code for a National Drinking Water rule.
|
| Rule Group Code |
Code that uniquely identifies a rule group.
|
| Rule Family Code |
Code for rule family.
|
For more clarification please visit the EPA's data dictionary.
Ventura Water - Frequently Asked Questions
| By Phone: | 805-652-4523 |
| By Email: | srungren@ci.ventura.ca.us |
| By Mail: | PO Box 99 VENTURA, CA, 93002 |
Existing customers can login to their Ventura Water Department account to pay their Ventura water bill by clicking here.
If you want to pay your Ventura Water Department bill online and haven't made an account yet, you can create an account online. Please click here to create your account to pay your Ventura water bill.
If you don't want to make an account, or can't remember your account, you can make a one-time payment towards your Ventura water bill without creating an account using a one time payment portal with your account number and credit or debit card. Click here to make a one time payment.
Moving to a new house or apartment in Ventura means you will often need to put the water in your name with Ventura Water Department. In order to put the water in your name, please click the link to the start service form below. Start service requests for water bills typically take two business days.
Leaving your house or apartment in Ventura means you will likely need to take your name off of the water bill with Ventura Water Department. In order to take your name off the water bill, please click the link to the stop service form below. Stop service for water bills requests typically take two business days.
The estimated price of bottled water
$1.6 in USD (1.5-liter)
USER SUBMITTED RATINGS
- Drinking Water Pollution and Inaccessibility
- Water Pollution
- Drinking Water Quality and Accessibility
- Water Quality
The above data is comprised of subjective, user submitted opinions about the water quality and pollution in Ventura, measured on a scale from 0% (lowest) to 100% (highest).
Related FAQS
Ventura Water Quality Report (Consumer Confidence Report)
The EPA mandates that towns and cities consistently monitor and test their tap water. They must report their findings in an annual Consumer Confidence Report. Below is the most recent water quality report from Ventura's Water. If you would like to see the original version of the report, please click here.
2021 CONSUMERCONFIDENCE REPORT
DRINKING WATER
FEATURING
CALENDAR YEAR 2020 WATER QUALITY RESULTS
www.venturawater.net |
Este informe contiene informacion muy importante sobre su ague |
1 |
potable. Traduzcalo o hable con alguien que lo entienda bien. |
A MESSAGE FROM THE GENERAL MANAGER
Ventura Water is pleased to present our 2021 Consumer Confidence Report (CCR) as required by the Safe Drinking Water Act. This annual water quality report provides a snap shot of where your water comes from, what it contains, and how it compares to standards set by regulatory agencies. Every year water quality staff tests water for several hundred chemical compounds at multiple points in the distribution system, as well as in our treatment plants, watersheds and reservoirs. We are committed to delivering a safe and dependable supply of drinking water that meets
or exceeds all drinking water quality and health standards 24 hours a day, 7 days a week. On behalf of the entire staff, thank you for partnering with us to protect and preserve our local water resources.
Sincerely,
SUSAN RUNGREN
General Manager
COMMUNITY PARTICIPATION
Want to get involved?
Regularly scheduled Water Commission meetings are held on the fourth Tuesday of each month. A public comment period is held during each meeting.
Visit www.venturawater.net and click on the Water Commission Button for agendas and minutes.
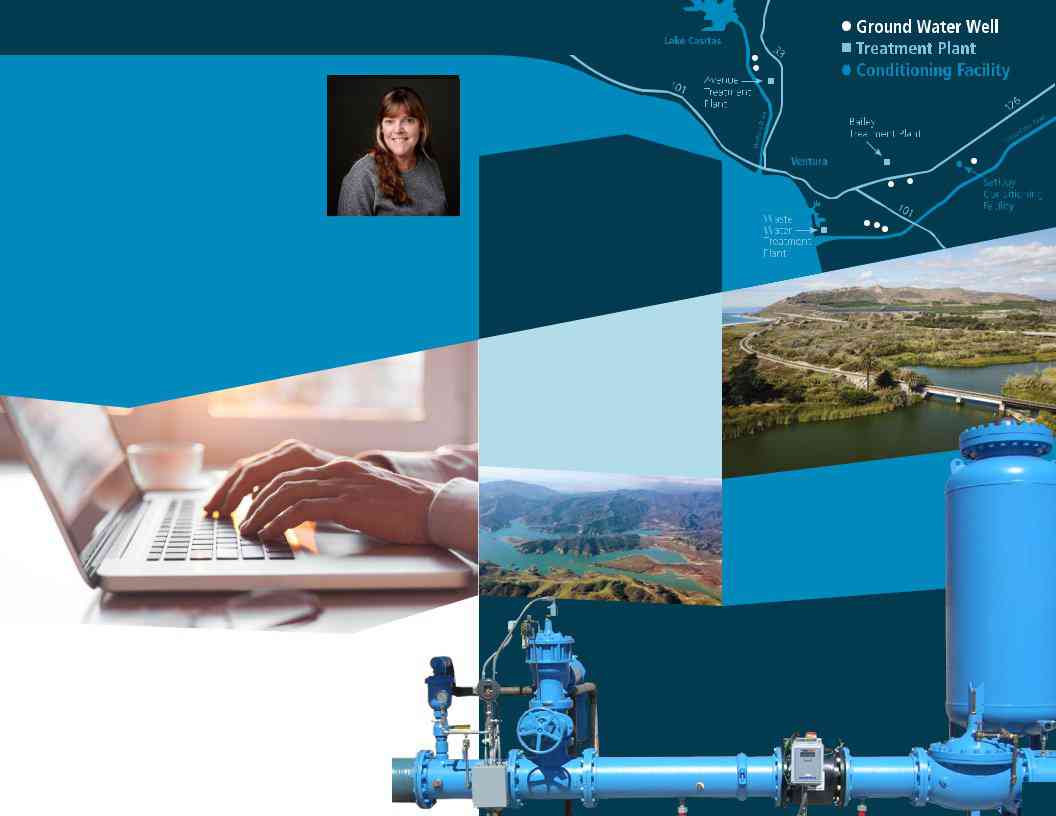
OUR WATER SOURCES
Ventura is one of the largest cities in Southern California that relies exclusively on local water supplies. We manage our water portfolio of three distinct sources based on the availability
from each source.
VENTURA RIVER
Groundwater under the influence of Surface Water
Located near Foster Park, this water primarily services West & Midtown Ventura.
CASITAS
Purchased Treated Surface Water
Originating from Lake Casitas, this water primarily services West & Midtown Ventura.
GROUNDWATER BASINS
• Mound |
Originating from three |
|
• |
Oxnard Plain |
groundwater basins. |
• |
Santa Paula |
|
2
COVID-19 (CORONAVIRUS)
Ventura’s water supply meets all stringent state and federal drinking water requirements.
For more water quality information on COVID
WATER QUALITY FLUSHING NO-DES
The City’s water service area is a complex system of more than 390 miles of pipelines with a total storage capacity of approximately 52 million gallons in 32 tanks and reservoirs providing water to residents and businesses. Water main flushing is a necessary part of operating and maintaining a drinking water distribution system to ensure high quality drinking water.
Routine maintenance is required to:
- Maintain water quality
- Clean water mains
- Maintain proper distribution operation
- Flush dead ends
- Maximize pipe lifespan
- Conduct fire flow tests
To save water, Ventura Water invested in a
3
CAPITAL IMPROVEMENT PROJECTS
To learn more about these and other exciting Ventura Water projects, visit venturawater.net
STATE WATER INTERCONNECTION PROJECT
The California State Water Project (SWP) is a water storage and delivery system of reservoirs, aqueducts, power plants and pumping plants extending more than 700
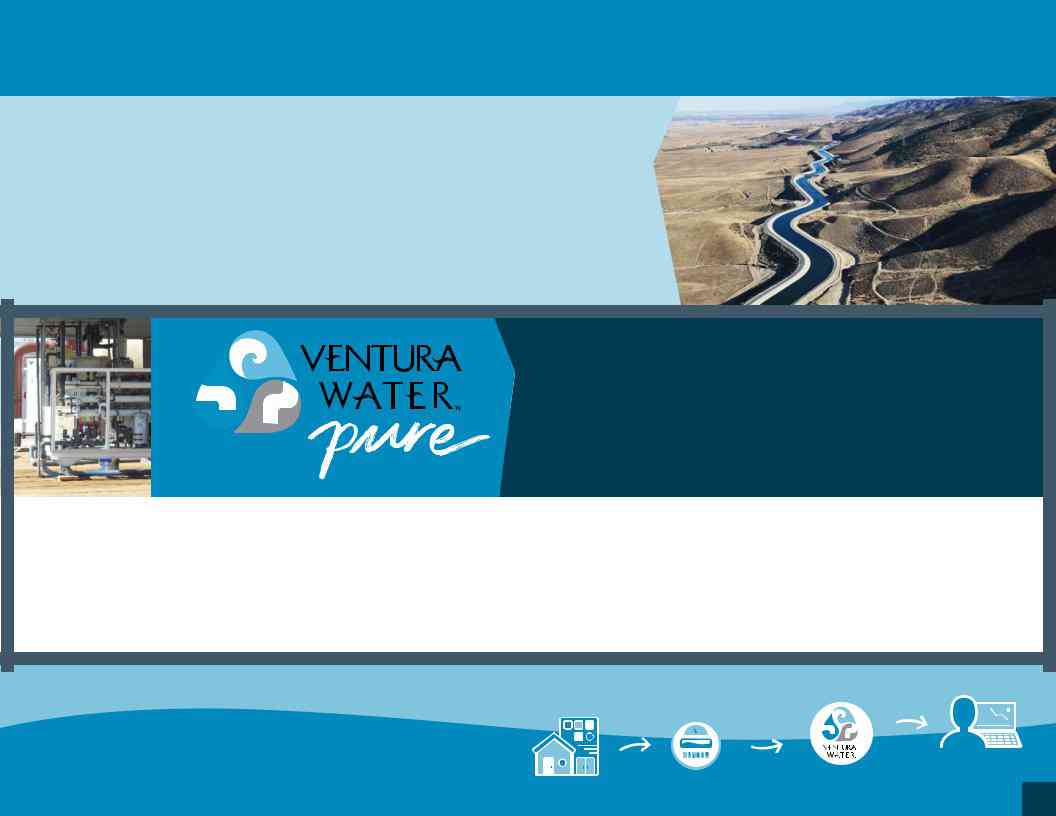
VenturaWaterPure | Potable Reuse
The VenturaWaterPure Program will diversify Ventura’s water supplies through innovative water treatment technologies. The proposed program includes an Advanced Water Purification Facility (AWPF) for potable water reuse. It will create a locally owned source of highly purified drinking water that provides Ventura with a
|
|
Adaptable |
|
Enhancing |
|
High |
|
Drought |
|
|
|
|
|
||||
|
|
Solutions |
|
Environment |
|
Quality |
|
Resistant |
|
|
|
|
|
|
|
|
|
|
|
|
|
|
|
|
|
|
METER UPGRADE PROJECT
Ventura Water is committed to equipping customers to use water efficiently. One of the ways |
|
the City is demonstrating this commitment is through the Meter Upgrade Project. Your new |
|
Smart Meter comes equipped with an |
|
enables customers to visually see and track their water use daily or hourly and receive leak |
|
detection notifications. For more project information visit venturawater.net |
4 |
|
EDUCATIONAL INFORMATION
Drinking water, including bottled water, may reasonably be expected to contain at least small amounts of some contaminants. The presence of contaminants does not necessarily indicate that water poses a health risk. More information about contaminants and potential health effects can be obtained by calling the U.S. EPA’s Safe Drinking Water Hotline
The sources of drinking water (both tap and bottled water)
include rivers, lakes, streams, ponds, reservoirs, springs and wells. As water travels over the surface of the land or through the ground, it dissolves
- Microbial contaminants, such as viruses and bacteria that may come from sewage treatment plants, septic systems, agriculture and livestock operations and wildlife.
- Inorganic contaminants, such as salts and metals that may be naturally occurring or result from urban storm water runoff, industrial or domestic wastewater discharges, oil and gas production, mining or farming.
- Pesticides and herbicides from a variety of sources, such as agriculture, urban storm water runoff and residential uses.
-
Organic chemical contaminants, including synthetic and volatile organic chemicals that are
by-products of industrial processes and petroleum production, and can also come from gas stations, urban storm water runoff, agricultural applications, and septic systems. -
Radioactive contaminants that can be
naturally-occurring or be the result of oil and gas production and mining activities.
If present, elevated levels of lead can cause serious health problems, especially for pregnant women and young children. Lead in drinking water is primarily from materials and components associated with service lines and home plumbing. Ventura Water is responsible for providing high quality drinking water, but cannot control the variety of materials used in plumbing components. When your water has been sitting for several hours, you can minimize the potential for lead exposure by flushing your tap for 30 seconds to 2 minutes before using water for drinking or cooking. If you are concerned about lead in your water, you may wish to have your water tested. Information on lead in drinking water, testing methods, and steps you can take to minimize exposure is available from the Safe Drinking Water Hotline or at: http://www.epa.gov/lead
In order to ensure that tap water is safe to drink, the U.S. Environmental Protection Agency (USEPA) and the State Water Resources Control Board (SWRCB), Division of Drinking Water (DDW) prescribe regulations that limit the number of contaminants in water provided by public water systems. Department regulations also establish limits for contaminants in bottled water that provide the same protection for public health.
Some people may be more vulnerable to contaminants in drinking water than the general population. Immunocompromised persons such as persons with cancer undergoing chemotherapy, persons who have undergone organ transplants, people with HIV/AIDS
or other immune system disorders, some elderly, and infants can be particularly at risk from infections. These people should seek advice about drinking water from their health care providers. USEPA/Centers for Disease Control (CDC) guidelines on appropriate means to lessen the risk of infection by Cryptosporidium and other microbial contaminants are available from the Safe Drinking Water Hotline:
Ventura Water conducted a Source Water Assessment (DSWAP) in 2013 for each of the drinking water sources serving the Ventura Water system. Sources in this system are considered most vulnerable to the following activities: gas stations, automobiles repair shops, sewer collection systems, and metal manufacturing. Contaminants associated with these activities have not been detected in the water supply.
A copy of the assessment may be viewed at:
SWRCB, DDW Santa Barbara District Office
1180 Eugenia Place, Suite 200, Carpinteria, CA 93013
You may request a summary
of the assessment by contacting:
SWRCB, DDW Santa Barbara District Office at (805)
5
Ventura’s Water Quality Summary 2020
Only water quality constituents detected by laboratory testing appear in the chart.
USING DATA COLLECTED IN 2020 UNLESS NOTED
PRIMARY DRINKING WATER STANDARDS (PDWS)
WATER CLARITY |
UNITS |
MCL |
|
VENTURA RIVER |
CMWD |
TYPICAL ORIGINS |
|
|
|
|
|
|
|
Filtered Effluent Turbidity |
NTU |
TT = 1 |
|
Highest Value = 0.08 |
Highest Value = 0.04 |
Soil runoff |
|
|
|
|
|||
Percentage of measurements below 0.2 NTU |
100% |
100% |
|
|||
|
|
|
|
|
|
|
MICROBIOLOGICAL |
UNITS |
MCL |
MCLG |
DISTRIBUTION SYSTEM MONTHLY MAXIMUM |
TYPICAL ORIGINS |
|
Total Coliform |
ppm |
5% |
0 |
1.72% |
|
Naturally present in the environment |
The result is the highest percentage of positive samples collected in a month during 2020. In September 2020, two samples tested positive for total coliform, which was 1.72% of the total samples collected. |
||||||
|
|
|
All |
|
||
|
|
|
|
|
|
|
DISINFECTION |
UNITS |
MRDL |
MRDLG |
DISTRIBUTION SYSTEM AVERAGE |
DISTRIBUTION SYSTEM RANGE |
TYPICAL ORIGINS |
|
|
|
|
|
|
|
Chloramine Residual |
ppm |
4 |
4 |
2.5 (highest RAA) |
0.0 - 4.9 |
Disinfectant added for treatment |
|
|
|
||||
|
Disinfectant compliance with the MRDL (maximum residual disinfectant level) is based on the calculated Running Annual Average (RAA). |
|
||||
|
|
|
|
|
|
|
DISINFECTION |
UNITS |
MCL |
|
AVERAGE |
RANGE |
TYPICAL ORIGINS |
|
|
|
|
|
|
|
Total Trihalomethanes |
ppb |
80 |
|
68 (highest LRAA) |
4.0 - 120 |
Byproduct of drinking water disinfection |
|
|
|
|
|
|
|
Total Haloacetic Acids (HAA5) |
ppb |
60 |
|
59 (highest LRAA) |
ND - 303 |
Byproduct of drinking water disinfection |
|
||||||
Disinfection |
||||||
|
|
|
|
|
|
|
LEAD AND COPPER - RESIDENTIAL |
UNITS |
RAL |
PHG |
DISTRIBUTION SYSTEM 90TH PERCENTILE |
DISTRIBUTION SYSTEM RANGE |
TYPICAL ORIGINS |
|
|
|
|
|
|
|
Lead |
ppm |
0.015 |
0.0002 |
0.0022 |
ND - 0.0042 |
Corrosion of household plumbing |
|
|
|
|
|
|
|
Copper |
ppm |
1.3 |
0.0003 |
0.65 |
0.017 - 1.2 |
Corrosion of household plumbing |
|
||||||
Every three years, residences are sampled and tested for lead and copper at the tap. The most recent set of samples (55 residences) was collected in 2020. |
||||||
|
Copper was detected in 55 samples; none exceeded the RAL. Lead was detected at low levels in 44 samples; none exceeded the RAL. |
|
||||
|
|
|
|
|
|
|
LEAD - SCHOOLS |
UNITS |
RAL |
PHG |
AVERAGE |
RANGE |
TYPICAL ORIGINS |
|
|
|
|
|
|
|
Lead |
ppm |
0.015 |
0.0002 |
Not Detected |
ND - 0.0055 |
Corrosion of household plumbing |
In 2018, Ventura Unified School District requested lead sampling at 22 schools. A total of 108 samples were collected from 22 schools for lead; none exceeded the RAL.
|
UNITS |
MCL |
PHG |
VENTURA RIVER |
GROUND WATER |
CASITAS MWD |
TYPICAL ORIGINS |
|
|||
|
|
|
|
|
|
|
|
||||
INORGANIC CONSTITUENTS |
(MCLG) |
AVERAGE |
RANGE |
AVERAGE |
RANGE |
AVERAGE |
RANGE |
|
|||
|
|
|
|
||||||||
|
|
|
|
|
|||||||
|
|
|
|
|
|
|
|
|
|
|
|
Arsenic |
ppm |
0.010 |
0.000004 |
ND |
ND |
0.0024 |
ND - 0.004 |
ND |
ND |
Erosion of natural deposits; Runoff from orchards |
|
|
|
|
|
|
|
|
|
|
|
|
|
Barium |
ppm |
1 |
2 |
ND |
ND |
ND |
ND |
0.12 |
0.12 |
Erosion of natural deposits; Discharges of oil drilling wastes and from metal refineries |
|
|
|
|
|
|
|
|
|
|
|
|
|
Fluoride |
ppm |
2 |
1 |
0.43 |
0.4 - 0.5 |
0.47 |
0.37 - 0.60 |
0.40 |
0.40 |
Erosion of natural deposits |
|
|
|
|
|
|
|
|
|
|
|
|
|
Nitrate (as Nitrogen) |
ppm |
10 |
10 |
1.3 |
0.6 - 1.9 |
4.3 |
2.9 - 6.7 |
ND |
ND |
Runoff/leaching from fertilizer use; Leaching from tanks and sewage |
|
|
|
|
|
|
|
|
|
|
|
|
|
Selenium |
ppm |
0.05 |
0.03 |
ND |
ND |
0.02 |
ND - 0.042 |
ND |
ND |
Erosion of natural deposits; Runoff from livestock lots (feed additive) |
|
|
|
|
|
|
|
|
|
|
|
|
|
Gross Alpha Particle Activity |
pCi/L |
15 |
0 |
2.9 |
2.6 - 3.1 |
6.7 |
2.2 - 9.6 |
ND |
ND |
Erosion of natural deposits |
|
|
|
|
|
|
|
|
|
|
|
|
|
|
|
|
|
|
|
|
|
|
|
|
6 |
Uranium |
pCi/L |
20 |
0.43 |
2.2 |
1.8 - 2.7 |
5.1 |
2.2 - 8.9 |
N/A |
N/A |
Erosion of natural deposits |
|
Ventura’s Water Quality Summary 2020 |
DATA CONTINUED |
|
|
SECONDARY DRINKING WATER STANDARDS
AESTHETIC STANDARDS
Organic Constituents |
||
|
||
|
Perfluorooctanoic Acid (PFOA) |
|
|
Boron |
|
|
Chloride |
|
|
Corrositivity (Aggressive Index) |
|
Constituents |
Iron |
|
Sulfate |
||
|
Manganese |
|
Inorganic |
Specific Conductance |
|
Total Dissolved Solids |
||
|
||
|
Zinc |
|
|
Hardness |
|
|
Hardness |
|
|
Magnesium |
|
|
Potassium |
|
|
Sodium |
WATER QUALITY PARAMETERS
Alkalinity, Total
Calcium
Orthophosphate (PO4)
pH
Specific Conductance
Turbidity
USEPA UCMR4 -
HALOACETIC ACID GROUPS (HAAS)
5 HAAs (HAA5)
6 Brominated HAAs (HAA6Br)
9 HAAs (HAA9)
Total Organic Carbon (TOC)
Bromide
USEPA UCMR4 -
ADDITIONAL CONTAMINANTS
Manganese
UNITS |
SECONDARY |
VENTURA RIVER |
|
|
|
|
GROUND WATER |
|
|
|
CASITAS MWD |
TYPICAL ORIGINS |
|
|||||||||||
MCL |
AVERAGE |
|
|
RANGE |
|
AVERAGE |
|
|
RANGE |
|
AVERAGE |
RANGE |
|
|||||||||||
|
|
|
|
|
|
|
|
|
|
|||||||||||||||
ppb |
0.0065 (NL) |
N/A |
|
|
N/A |
|
|
|
ND |
|
|
ND |
|
N/A |
N/A |
Runoff/leaching from industrial processes or chemical factories |
|
|||||||
ppb |
0.0051 (NL) |
N/A |
|
|
N/A |
|
|
|
ND |
|
|
ND |
|
N/A |
N/A |
Runoff/leaching from industrial processes or chemical factories |
|
|||||||
ppm |
1 (NL) |
0.57 |
|
0.40 - 0.80 |
|
|
|
0.53 |
|
0.40 - 0.60 |
|
|
0.20 |
0.20 |
|
|||||||||
ppm |
500 |
40 |
|
40 - 41 |
|
|
|
67 |
|
|
43 - 98 |
|
|
|
23 |
23 |
Runoff/leaching from natural deposits; seawater influence |
|
||||||
no units |
None |
12.4 |
|
12.1 - 12.5 |
|
|
|
12.30 |
|
|
11.7 - 12.9 |
|
|
|
Langlier Index is an indicator of corrosion. A value greater than 12 |
|
||||||||
|
|
|
|
|
|
|
|
|
indicates the water is |
|
||||||||||||||
|
|
|
|
|
|
|
|
|
|
|
|
|
|
|
|
|
|
|
|
|
|
|
||
ppm |
0.3 |
ND |
|
|
ND |
|
|
<0.1 |
|
ND - 0.027 |
|
ND |
ND |
Erosion of natural deposits |
|
|||||||||
ppm |
0.05 |
ND |
|
|
ND |
|
|
<0.02 |
|
ND - 0.070 |
|
ND |
ND |
Erosion of natural deposits |
|
|||||||||
µmhos |
1,600 |
1,157 |
|
1,150 - 1,160 |
|
|
|
1,941 |
|
1,634 - 3,000 |
|
|
705 |
705 |
Substances that form ions in water; seawater influence |
|
||||||||
ppm |
500 |
292 |
|
288 - 299 |
|
|
|
655 |
|
|
563 - 797 |
|
|
176 |
176 |
Runoff/leaching from natural deposits |
|
|||||||
ppm |
1,000 |
813 |
|
760 - 860 |
|
|
|
1,438 |
|
1,220 - 1,700 |
|
|
470 |
470 |
Runoff/leaching from natural deposits |
|
||||||||
ppm |
5 |
0.037 |
|
|
ND - 0.11 |
|
|
|
ND |
|
|
ND |
|
ND |
ND |
Runoff/leaching from natural deposits |
|
|||||||
ppm |
None |
429 |
|
419 - 440 |
|
|
|
666 |
|
|
486 - 908 |
|
|
295 |
295 |
|
|
|
||||||
grains per gallon |
None |
25 |
|
24 - 26 |
|
|
|
39 |
|
|
28 - 53 |
|
|
|
17 |
17 |
|
|
|
|||||
ppm |
None |
32 |
|
31 - 33 |
|
|
|
55 |
|
|
36 - 80 |
|
|
|
28 |
28 |
|
|
|
|||||
ppm |
None |
2.0 |
|
2.0 |
|
|
|
5.4 |
|
|
4.0 - 8.0 |
|
|
|
4.0 |
4.0 |
|
|
|
|||||
ppm |
None |
49 |
|
48 - 50 |
|
|
|
136 |
|
|
94 - 223 |
|
|
|
31 |
31 |
|
|
|
|||||
UNITS |
SECONDARY MCL |
|
|
|
DISTRIBUTION SYSTEM |
|
|
|
|
|
|
|
|
|
|
|
|
|||||||
|
|
|
|
|
|
|
|
|
|
|
|
|
|
|
|
|
|
|
|
|
|
|||
|
AVERAGE |
|
|
|
RANGE |
|
|
|
|
|
|
|
|
|
||||||||||
|
|
|
|
|
|
|
|
|
|
|
|
|
|
|
||||||||||
mg/L as CaCO3 |
None |
|
|
|
238 |
|
|
|
160 - 290 |
|
|
|
|
|
|
|
|
|
|
|||||
ppm |
None |
|
|
|
155 |
|
|
|
73 - 214 |
|
|
|
|
|
|
|
|
|
|
|||||
mg/L as PO4 |
None |
|
|
|
0.99 |
|
|
|
0.48 - 2.0 |
|
|
|
|
|
|
|
|
|
|
|||||
pH units |
6.5 - 8.5 |
|
|
|
7.3 |
|
|
|
7.0 - 7.8 |
|
|
|
|
|
|
|
|
|
|
|||||
µmhos |
1,600 |
|
|
|
1,641 |
|
|
|
690 - 2,600 |
|
|
|
|
|
|
|
|
|
||||||
NTU |
5 |
|
|
|
0.09 |
|
|
|
0.05 - 2.1 |
|
|
|
|
|
|
|
|
|
|
|||||
UNITS |
SECONDARY |
DISTRIBUTION SYSTEM |
|
|
|
VENTURA RIVER |
|
|
TYPICAL ORIGINS |
|
|
|
||||||||||||
MCL |
AVERAGE |
|
RANGE |
|
|
|
AVERAGE |
|
RANGE |
|
|
|
|
|
||||||||||
|
|
|
|
|
|
|
|
|
|
|
|
|
||||||||||||
ppb |
60 |
24 |
|
0.98 - 44 |
|
|
|
|
|
|
N/A |
|
|
Byproduct of drinking water disinfection |
|
|||||||||
ppb |
None |
19 |
|
1.4 - 32 |
|
|
|
|
|
|
N/A |
|
|
Byproduct of drinking water disinfection |
|
|||||||||
ppb |
None |
37 |
|
1.4 - 63 |
|
|
|
|
|
|
N/A |
|
|
Byproduct of drinking water disinfection |
|
|||||||||
ppm |
None |
|
N/A |
|
|
N/A |
|
|
2.1 |
|
|
1.3 - 2.9 |
|
|
Runoff/leaching from natural deposits |
|
||||||||
ppb |
None |
|
N/A |
|
|
N/A |
|
|
47 |
|
|
32 - 55 |
|
|
Runoff/leaching from natural deposits |
|
||||||||
UNITS |
SECONDARY |
TREATED SURFACE WATER |
|
TREATED GROUNDWATER |
|
TYPICAL ORIGINS |
|
|
|
|||||||||||||||
MCL |
AVERAGE |
|
RANGE |
|
|
|
AVERAGE |
|
RANGE |
|
|
|
|
|
||||||||||
|
|
|
|
|
|
|
|
|
|
|
|
|
||||||||||||
ppm |
0.05 |
0.00055 |
|
|
ND - 0.0014 |
0.0083 |
|
0.007 - 0.014 |
|
Runoff/leaching from natural deposits |
|
7 |
||||||||||||
DEFINITIONS
N/A Not applicable
MCL Maximum contaminant level MCLG Maximum contaminant level goal
PHG Public health goal
MRDL Maximum residual disinfectant level MRDLG Maximum residual disinfectant level goal
RAA Running annual average
RAL Regulatory action level, the concentration which, if exceeded in more than 10% of the residences tested, triggers treatment or other requirements that a water system must follow. LRAA Locational running annual average of total trihalomethanes or haloacetic acids, calculated at each monitoring location
(NL) Notification Level as established by the State Water Resources Control Board (SWRCB) CMWD Casitas Municipal Water District
- Treatment technique
ppm |
parts per million, or milligrams per liter (mg/L) |
ppb |
parts per billion, or micrograms per liter (µg/L) |
pCi/L |
picoCuries per liter |
ND |
Not detected above the detection limit for purposes of reporting |
mg/L as CaCO3 |
milligrams per liter as calcium carbonate |
NTU |
Nephalometric Turbity Unit |
µmhos |
micromhos |
UCMR4 |
Fourth Unregulated Contaminant Monitoring Rule |
In compliance with the Americans with Disabilities Act, |
|
special needs can be met by calling |
|
through the California Relay Service. |
8 |
|
Contaminants
Ventura Water Department
EWG's drinking water quality report shows results of tests conducted by the water utility and provided to the Environmental Working Group by the California State Water Resources Control Board, as well as information from the U.S. EPA Enforcement and Compliance History database (ECHO). For the latest quarter assessed by the U.S. EPA (January 2019 - March 2019), tap water provided by this water utility was in compliance with federal health-based drinking water standards.
Utility details
- Serves: 112677
- Data available: 2012-2017
- Data Source: Surface water
- Total: 20
Contaminants That Exceed Guidelines
- Bromodichloromethane
- Bromoform
- Chloroform
- Dibromochloromethane
- Dichloroacetic acid
- Nitrate
- Nitrate and nitrite
- Total trihalomethanes (TTHMs)
- Trichloroacetic acid
- Uranium
Other Detected Contaminants
- Chlorate
- Chromium (hexavalent)
- Dibromoacetic acid
- Fluoride
- Haloacetic acids (HAA5)
- Molybdenum
- Monobromoacetic acid
- Monochloroacetic acid
- Strontium
- Vanadium
Reminder
Always take extra precautions, the water may be safe to drink when it leaves the sewage treatment plant but it may pick up pollutants during its way to your tap. We advise that you ask locals or hotel staff about the water quality. Also, note that different cities have different water mineral contents.