Table of Contents
Can You Drink Tap Water in Santa Ana?
Yes, Santa Ana's tap water is generally considered safe to drink as Santa Ana has no active health based violations of the Safe Drinking Water Act (SDWA) that we are aware of. Other factors such as lead piping in a home, or low levels of pollutants on immunocompromised individuals, should also be considered, however. To find more recent info we might have, you can check out our boil water notice page or the city's water provider website.
According the EPA’s ECHO database, from April 30, 2019 to June 30, 2022, Santa Ana's water utility, City of Santa Ana, had 1 non-health-based violations of the Safe Drinking Water Act. For more details on the violations, please see our violation history section below. The last violation for Santa Ana was resolved on Sept. 30, 2016. This assessment is based on the City of Santa Ana water system, other water systems in the city may have different results.
While tap water that meets the EPA health guidelines generally won’t make you sick to your stomach, it can still contain regulated and unregulated contaminants present in trace amounts that could potentially cause health issues over the long-run. These trace contaminants may also impact immunocompromised and vulnerable individuals.
The EPA is reviewing if it’s current regulations around pollutant levels in tap water are strict enough, and the health dangers posed by unregulated pollutants, like PFAS.
Water Quality Report for Santa Ana Tap Water
The most recent publicly available numbers for measured contaminant levels in Santa Ana tap water are in its 2020 Water Quality Report. As you can see, there are levels which the EPA considers to be acceptable, but being below the maximum allowable level doesn’t necessarily mean the water is healthy.
Lead in tap water, for example, is currently allowed at up to 15ppb by the EPA, but it has set the ideal goal for lead at zero. This highlights how meeting EPA standards doesn’t necessarily mean local tap water is healthy.
EPA regulations continue to change as it evaluates the long term impacts of chemicals and updates drinking water acceptable levels. The rules around arsenic, as well as, lead and copper are currently being re-evaluated.
There are also a number of "emerging" contaminants that are not currently. For example, PFAS (Per- and polyfluoroalkyl substances), for which the EPA has issued a health advisory. PFAS are called "forever chemicals" since they tend not to break down in the environment or the human body and can accumulate over time.
We recommend looking at the contaminants present in Santa Ana's water quality reports, or getting your home's tap water tested to see if you should be filtering your water.
Santa Ana Tap Water Safe Drinking Water Act Violation History - Prior 10 Years
Below is a ten year history of violations for the water system named City of Santa Ana for Santa Ana in California. For more details please see the "What do these Violations Mean?" section below.
For the compliance period beginning Oct. 1, 2021, Santa Ana had 1 non-health based Safe Drinking Water Act violation with the violation category being Other Violation, more specifically, the violation code was Sample Siting Plan Errors (RTCR) which falls into the Microbials rule code group, and the Total Coliform Rules rule code family for the following contaminant code: Revised Total Coliform Rule.
From Sept. 1, 2016 to Sept. 30, 2016, Santa Ana had 1 non-health based Safe Drinking Water Act violation with the violation category being Monitoring and Reporting, more specifically, the violation code was Monitoring of Treatment (SWTR-Unfilt/GWR) which falls into the Microbials rule code group, and the Groundwater Rule rule code family for the following contaminant code: Groundwater Rule.
From Jan. 1, 2013 to March 31, 2013, Santa Ana had 2 non-health based Safe Drinking Water Act violations with the violation category being Monitoring and Reporting, more specifically, the violation code was Monitoring, Routine (IDSE) which falls into the Disinfectants and Disinfection Byproducts Rule rule code group, and the Stage 2 Disinfectants and Disinfection Byproducts Rule rule code family for the following contaminant codes: TTHM, Total Haloacetic Acids (HAA5).
Is there Lead in Santa Ana Water?
Based on the EPA’s ECHO Database, 90% of the samples taken from the Santa Ana water system, City of Santa Ana, between sample start date and sample end date, were at or below, 0.0 mg/L of lead in Santa Ana water. This is 0% of the 0.015 mg/L action level. This means 10% of the samples taken from Santa Ana contained more lead.
While Santa Ana water testing may have found 0.0 mg/L of lead in its water, that does not mean your water source has the same amount. The amount of lead in water in a city can vary greatly from neighborhood to neighborhood, or even building to building. Many buildings, particularly older ones, have lead pipes or service lines which can be a source of contamination. To find out if your home has lead, we recommend getting you water tested.
No amount of lead in water is healthy, only less dangerous. As lead accumulates in our bodies over time, even exposure to relatively small amounts can have negative health effects. For more information, please check out our Lead FAQ page.
Are there PFAS in Santa Ana Tap Water?
Currently, testing tap water for PFAS isn’t mandated on a national level. We do have a list of military bases where there have been suspected or confirmed leaks. There appears to be at least one military base - Marine Corps Air Station Tustin - near Santa Ana with suspected leaks.
With many potential sources of PFAS in tap water across the US, the best information we currently have about which cities have PFAS in their water is this ewg map, which you can check to see if Santa Ana has been evaluated for yet.
Our stance is better safe than sorry, and that it makes sense to try to purify the tap water just in case.
Santa Ana SDWA Violation History Table - Prior 10 Years
| Compliance Period | Status | Health-Based? | Category Code | Code | Rule Code | Contaminant Code | Rule Group Code | Rule Family Code |
|---|---|---|---|---|---|---|---|---|
| 10/01/2021 - | Addressed | No | Other Violation (Other) | Sample Siting Plan Errors (RTCR) (5A) | Revised Total Coliform Rule (111) | Revised Total Coliform Rule (8000) | Microbials (100) | Total Coliform Rules (110) |
| 09/01/2016 - 09/30/2016 | Resolved | No | Monitoring and Reporting (MR) | Monitoring of Treatment (SWTR-Unfilt/GWR) (31) | Ground Water Rule (140) | Groundwater Rule (0700) | Microbials (100) | Groundwater Rule (140) |
| 01/01/2013 - 03/31/2013 | Resolved | No | Monitoring and Reporting (MR) | Monitoring, Routine (IDSE) (30) | Stage 2 Disinfectants and Disinfection Byproducts Rule (220) | TTHM (2950) | Disinfectants and Disinfection Byproducts Rule (200) | Stage 2 Disinfectants and Disinfection Byproducts Rule (220) |
| 01/01/2013 - 03/31/2013 | Resolved | No | Monitoring and Reporting (MR) | Monitoring, Routine (IDSE) (30) | Stage 2 Disinfectants and Disinfection Byproducts Rule (220) | Total Haloacetic Acids (HAA5) (2456) | Disinfectants and Disinfection Byproducts Rule (200) | Stage 2 Disinfectants and Disinfection Byproducts Rule (220) |
What do these Violations Mean?
Safe Drinking Water Act Violations categories split into two groups, health based, and non-health based. Generally, health based violations are more serious, though non-health based violations can also be cause for concern.
Health Based Violations
- Maximum contaminant levels (MCLs) - maximum allowed contaminant level was exceeded.
- Maximum residual disinfectant levels (MRDLs) - maximum allowed disinfectant level was exceeded.
- Other violations (Other) - the exact required process to reduce the amounts of contaminants in drinking water was not followed.
Non-Health Based Violations
- Monitoring and reporting violations (MR, MON) - failure to conduct the required regular monitoring of drinking water quality, and/or to submit monitoring results on time.
- Public notice violations (Other) - failure to immediately alert consumers if there is a serious problem with their drinking water that may pose a risk to public health.
- Other violations (Other) - miscellaneous violations, such as failure to issue annual consumer confidence reports or maintain required records.
SDWA Table Key
| Field | Description |
|---|---|
| Compliance Period | Dates of the compliance period. |
| Status |
Current status of the violation.
|
| Health-Based? | Whether the violation is health based. |
| Category Code |
The category of violation that is reported.
|
| Code | A full description of violation codes can be accessed in the SDWA_REF_CODE_VALUES (CSV) table. |
| Contaminant Code | A code value that represents a contaminant for which a public water system has incurred a violation of a primary drinking water regulation. |
| Rule Code |
Code for a National Drinking Water rule.
|
| Rule Group Code |
Code that uniquely identifies a rule group.
|
| Rule Family Code |
Code for rule family.
|
For more clarification please visit the EPA's data dictionary.
Santa Ana Water - Frequently Asked Questions
| By Phone: | 714-647-3387 |
| By Email: | cbarrera@santa-ana.org |
| By Mail: | 220 S. DAISY AVENUE BLDG. A SANTA ANA, CA, 92703 |
Existing customers can login to their City of Santa Ana account to pay their Santa Ana water bill by clicking here.
If you want to pay your City of Santa Ana bill online and haven't made an account yet, you can create an account online. Please click here to create your account to pay your Santa Ana water bill.
If you don't want to make an account, or can't remember your account, you can make a one-time payment towards your Santa Ana water bill without creating an account using a one time payment portal with your account number and credit or debit card. Click here to make a one time payment.
Moving to a new house or apartment in Santa Ana means you will often need to put the water in your name with City of Santa Ana. In order to put the water in your name, please click the link to the start service form below. Start service requests for water bills typically take two business days.
Leaving your house or apartment in Santa Ana means you will likely need to take your name off of the water bill with City of Santa Ana. In order to take your name off the water bill, please click the link to the stop service form below. Stop service for water bills requests typically take two business days.
The estimated price of bottled water
$2.33 in USD (1.5-liter)
USER SUBMITTED RATINGS
- Drinking Water Pollution and Inaccessibility
- Water Pollution
- Drinking Water Quality and Accessibility
- Water Quality
The above data is comprised of subjective, user submitted opinions about the water quality and pollution in Santa Ana, measured on a scale from 0% (lowest) to 100% (highest).
Related FAQS
Santa Ana Water Quality Report (Consumer Confidence Report)
The EPA mandates that towns and cities consistently monitor and test their tap water. They must report their findings in an annual Consumer Confidence Report. Below is the most recent water quality report from Santa Ana's Water. If you would like to see the original version of the report, please click here.

2020 WATER QUALITY
REPORT
Protecting the Safety and
Reliability of Your Water
Water Quality
Learn about the
sources and quality
of your drinking water, how we monitor it and protect you.
Sustainability
Discover how
we invest in our
infrastructure and community, flowing value to you everyday.
Santa Ana Kids
For kids ... explore
and learn about
your water,
the environment,
contests and more.
Santa Ana News
Read about our rebate programs, latest news, useful telephone numbers and more.
On behalf of the City of Santa Ana Public Works Agency and the men and women of the Water Resources Division, thank you for allowing us to serve you.
1
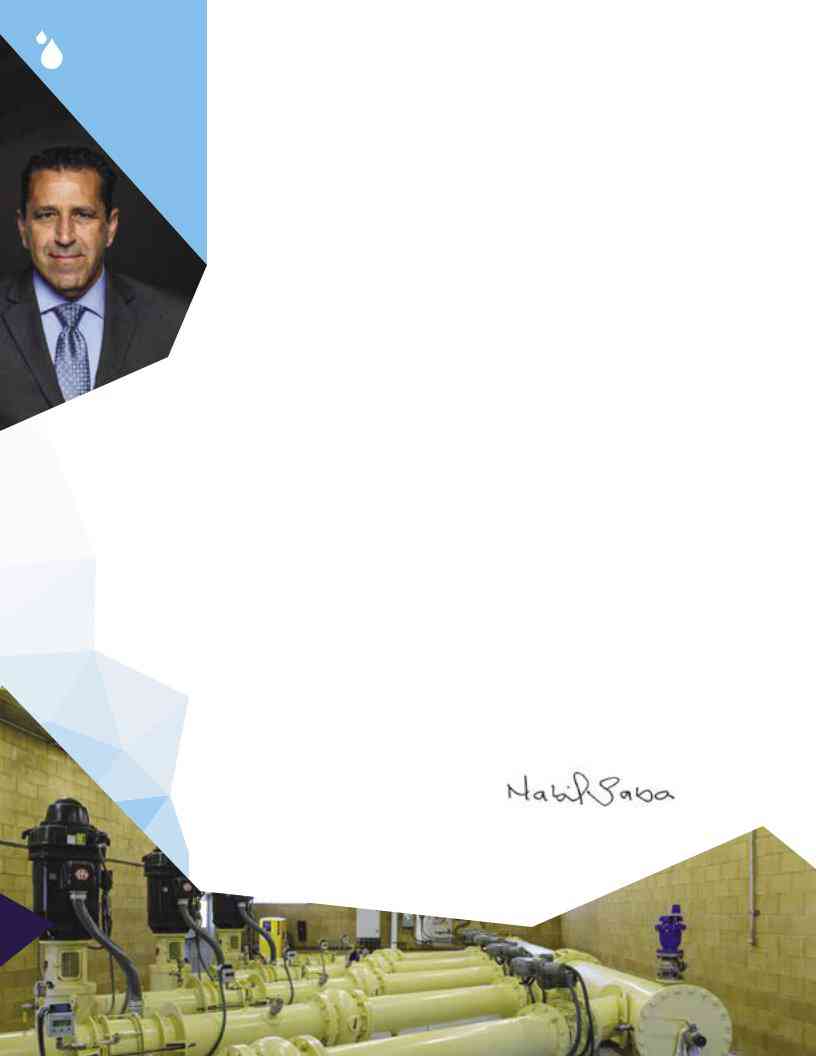
A Message From
Nabil Saba
The services that the City of Santa Ana Public Works Agency provides our community were never more essential than they were in 2020.
The
A key measure of success for a Public Works Agency is that the public rarely needs to think about the work we do. We endeavor to keep our many services operating without incident or interruption. This annual Water Quality Report is that yearly exception when we invite you to review what we do that directly impacts the quality of your daily life.
In this 2020 Report you will read about …
-
How our
award-winning Water Resources Division ensures that the quality of Santa Ana’s water surpasses all state and federal safety requirements. -
The measures we are taking
to strengthen the reliability and resiliency of our water distribution and wastewater management. -
The many improvements we have made and propose to make to Santa Ana’s infrastructure, focusing on cleaner streets and
well-maintained medians, improving the condition of our sidewalks and the trees that line them, and ensuring timely and efficient trash collection.
- And, as a special highlight, you’ll meet some of the women who are a driving force behind the efficiencies, processes and direction of our Water Resources Division.
Raising The Bar On Our
Quality of Life
The City has secured $143 million in funding from the federal government for
Furthermore, in keeping Santa Ana a beautiful place to live, work and visit, the Public Works Agency recently sponsored the first annual Neighborhood Block Beautification Contest (NBBC). The contest recognizes and rewards residents whose neighborhood blocks showcase properties that reflect community pride through their aesthetically- pleasing appearance.
I am pleased to share this review of our accomplishments during this historic year, and invite you to contact us directly with any questions you
may have.
On behalf of the City of Santa Ana Public Works Agency and the men and women of the Water Resources Division, thank you for allowing us to serve you.
Sincerely,
Nabil Saba P.E.
Executive Director
Public Works Agency
2020 | WATER QUALITY
REPORT

A Message From
Cesar Barrera
Clean, reliable water is the result of planning, technology and teamwork.
Despite the trials and challenges posed by the global
As essential workers, our team of water professionals – from field crews to treatment operators – were on the job throughout the crisis to ensure our customers received the clean, safe,
Staff was undeterred in maintaining water quality above regulations set by California and the federal government, delivering millions of gallons of it each day to Santa Ana homes and businesses.
The system’s reliability is dependent on regular maintenance and upgrades to the pipelines, pumps and other equipment in our
Key to our vision is a number of important projects that will
Here are some of the ways we are incorporating technology and maximizing your investment in the utility:
-
Advanced Metering
Infrastructure (AMI) – This $30 million project will give customers access
toreal-time consumption data that can help them save water and money. The technology will also help staff plan, construct and optimize the water distribution system and meet state drought mandates. - Sophisticated mapping software All of our 450 miles of water pipelines, 390 miles of sewer pipelines and 45,000 connections are plotted on GIS. The software reduces down time and improves customer service by helping operators minimize impacts and disruptions from main breaks and other emergencies. The cutting edge instrumentation also helps save the City money by reducing design and construction costs for infrastructure projects.
- SCADA (Supervisory Control and Data Acquisition System) – Upgrades are planned for the network that serves as the automated “brain” of our facilities 24 hours a day, seven days a week. SCADA is a critical component for operating pumps, filling reservoirs, maintaining pressure, and activating alarms so potential problems can be addressed quickly.
Your Water Resources Division is working hard to safeguard your future services.
advance our goal of being a
to our Capital Improvement Program to strengthen our resiliency
and efficiency. We have worked for the last 15 years to actively integrate technology throughout the organization.
The Water Resources Division is committed to ensuring that the City’s water and sewer infrastructure and services are
We are fortunate to have these tools available to help maintain quality water and service and exceed customer expectations. Add these resources to our teams – the men and women who ensure safe, clean water and dependable delivery – and it is a winning combination.
Please read through this Consumer Confidence Report to learn more about your water and what we do to make sure it is always there when you need it.
Sincerely,
2
Cesar Barrera P.E.
Acting Deputy Director of Public Works
Water Resources Manager
REPORT
2020 | WATER QUALITY
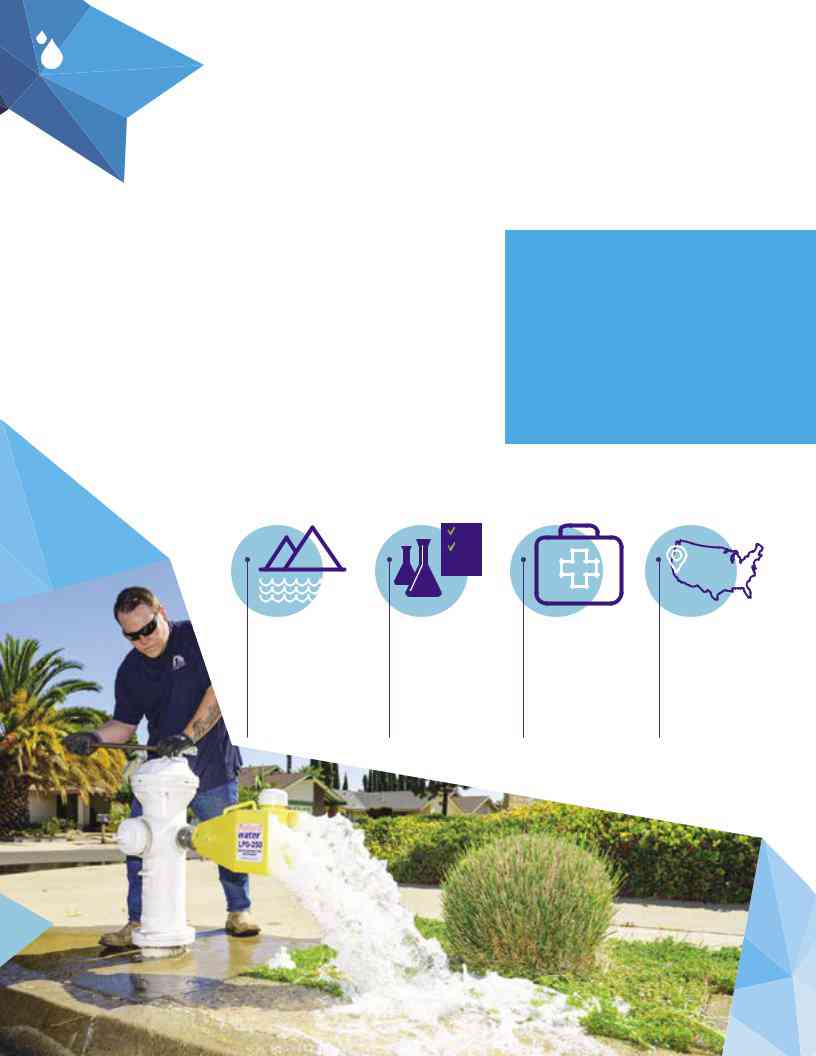
About This Report
The Consumer Confidence Report (CCR) is an annual water quality report that informs you where your drinking water comes from and what’s in it.
Read this report to learn more about the water provided by Santa Ana and what the City is doing to ensure the highest quality of water is delivered to you year after year.
The centerpiece of the CCR is a series of tables that list the results of
of each constituent found in Santa Ana’s water supply, how it compares with the allowable state and federal limits, and the constituent’s likely origin. Only the constituents that are found in Santa Ana’s water are listed in the data tables. Bottled water is not covered in this report. Read this report to learn more about the water provided by Santa Ana and what the City is doing to ensure the highest quality of water is delivered to you year after year.
Your tap water met all Federal and State drinking water health standards in 2020. Santa Ana is meticulous at safeguarding its water supplies and, once again, we are proud to report that our system has never violated a maximum contaminant level or any other water quality standard.
SUCH AS:
Where your water comes
A list of regulated contaminants that were detected and their level.
Potential health effects from consuming contaminated water and additional safeguards against water- related illnesses.
Contaminant levels in your drinking water compared
to national standards and any violations of
3
2020 | WATER QUALITY
REPORT
About Your
Drinking Water
Santa Ana’s Sources
Of Water Supply
The City of Santa Ana relies on two sources for the 11 billion gallons of water it supplies to residents and businesses each year: 77 percent is groundwater and 23 percent
is imported water purchased from Metropolitan Water District of Southern California (MWD). MWD is a regional wholesaler that provides water to 26 member public agencies like Santa Ana throughout Los Angeles, Orange, Riverside, San Bernardino, San Diego and
Ventura counties.
Imported — MWD brings Colorado River water from Lake Havasu through the
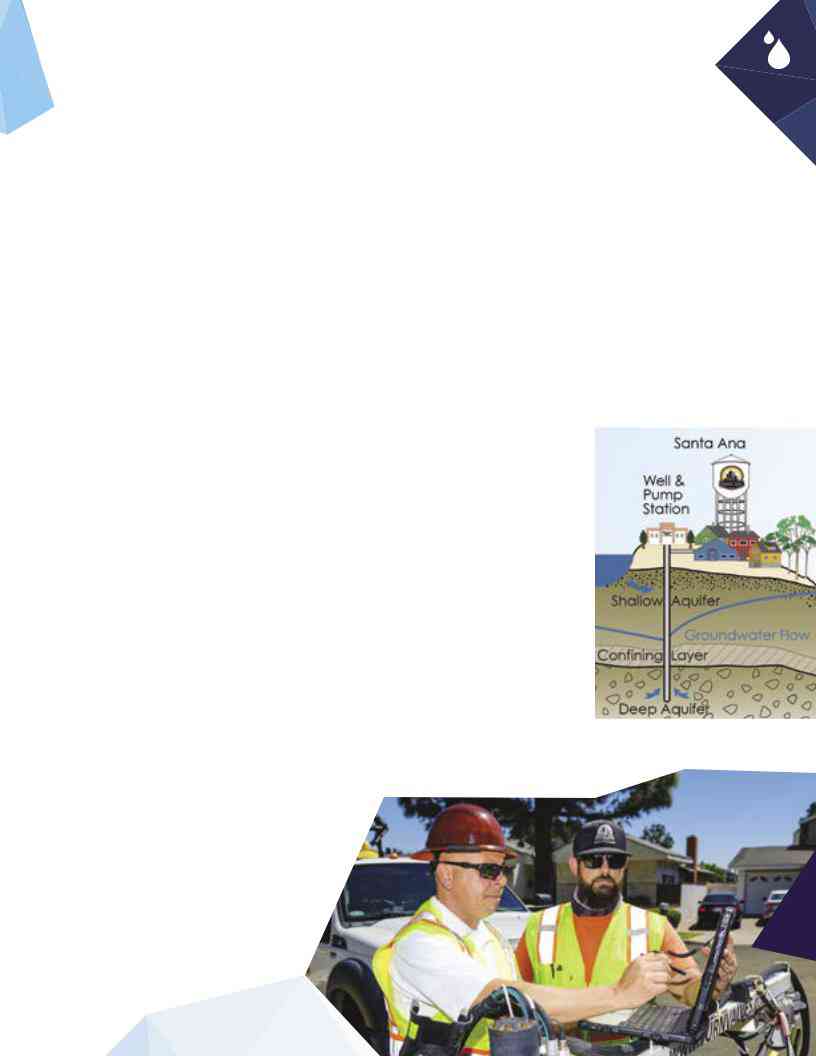
Groundwater — Santa Ana sits on the Orange County Groundwater Basin, which contains approximately 500,000
Most of our customers receive a blending of the two sources: groundwater and imported water.
You can read about the water quality standards for each of these sources in the data tables starting on page 19. We have listed imported water and groundwater in separate tables. An additional table lists the water quality standards for Santa Ana’s
water distribution system.
4
2020 | WATER QUALITY
REPORT
Regulatory Requirements
Your tap water may contain different types of chemicals (organic and inorganic), microscopic organisms (e.g., bacteria, algae, viruses) and radioactive materials (radionuclides), many of which are naturally occurring. Health agencies require monitoring for these constituents or substances, because at certain levels they could make a person sick.
Water Quality Standards
Drinking water standards established by the U.S. Environmental Protection Agency (U.S. EPA) and the State Water Resources Control Board (State Water Board) set limits on over 90 substances that may affect consumer health or aesthetic qualities of drinking water. EPA rules also set
MCLG
PHG
MRDLG
5
2020 | WATER QUALITY
REPORT
Water Quality Goals
In addition to mandatory water quality standards, the U.S. EPA and California EPA have set voluntary water quality goals for some contaminants. The data tables in this report include three types of water quality goals:
Maximum Contaminant Level Goal. The level of a contaminant in drinking water below which there is no known or expected risk to health. MCLGs are set by the U.S. EPA.
Public Health Goal. The level of a contaminant in drinking water below which there is no known or expected risk to health. PHGs are set by the U.S. EPA.
Maximum Residual
Disinfectant Level Goal.
The level of a drinking water disinfectant below which there is no known or expected risk to health. MRDLGs do not reflect the benefits of the use of disinfectants to control microbial contaminants.
Primary Standards
Mandatory
Secondary Standards Aesthetic standards (non
in drinking water.
Unregulated Parameters
Information about contaminants that are monitored, but are not currently regulated by federal and state health agencies.

Maximum Allowed Levels of Constituents
Health agencies have maximum contaminant levels (MCLs) for constituents so that drinking water is safe and looks, tastes and smells good. A few constituents have the letters “TT” (Treatment Technique) in the MCL column because they do not have a numerical MCL. Instead, they have certain treatment requirements that have to be met.
One of the constituents, total chlorine residual, has an MRDL (maximum residual disinfection level) instead of an MCL.
The MRDL is the maximum level of a disinfectant added for water treatment that is allowed in water. While disinfectants are necessary to kill harmful microbes, drinking water regulations protect against too much disinfectant being added. Another constituent, turbidity, has a requirement that 95 percent of the measurements taken must be below a certain number. Turbidity is a measure of the cloudiness of water. We monitor it because it is
a good indicator of the efficiency of the filtration system.
Primary vs. Maximum Allowed Levels of Constituents
Constituents that are grouped in the “Primary Standards” section may be unhealthy at certain levels. Constituents that are grouped under the “Secondary Standards” section can affect the appearance, taste and smell of water, but do not affect the safety of the water unless they also have a primary standard. Some constituents (e.g., aluminum) have two different MCLs, one for
Safe Levels of Constituents
With a few exceptions, if the average amount of a constituent found in tap water over the course of a year is no greater than the MCL, then the regulatory requirements are considered to be satisfied. The highest and lowest levels measured over a year are shown in the range. Requirements for safety, appearance, taste and smell are based on the average levels recorded and
not the range.
Additional Information
Additional information about drinking water safety and standards can be found at:
State Water Resources Control Board Division Of Drinking Water
1001 I Street
Sacramento, CA 95814
-
449-5577 www.waterboards.ca.gov/drinking_water/certlic/ drinkingwater/Chemicalcontaminants.html
U.S. Environmental Protection Agency Office Of Ground Water And Drinking Water
1200 Pennsylvania Avenue, NW Mail Code 4606M Washington, DC
Consumer Information
www.epa.gov/ccr
Information On How Drinking Standards
Are Established
www.epa.gov/dwstandardsregulations
6
2020 | WATER QUALITY
REPORT

To ensure that tap water is safe to drink, the U.S. EPA and the State Water Board prescribe regulations that limit the amount of certain contaminants in water provided by public water systems. The U.S. Food and Drug Administration regulations and California law also establish limits for contaminants in bottled water that provide the same protection for public health. Additional information on bottled water is available on the California Department of Public Health’s website.
Drinking Water & Your Health
The sources of drinking water (both tap water and bottled water) include rivers, lakes, streams, ponds, reservoirs, springs, and wells. As water travels over the surface of the land or through the ground, it dissolves naturally occurring minerals and, in some cases, radioactive material, and can pick up substances resulting from the presence of animals or human activity.
The presence of contaminants does not necessarily indicate that water poses
a health risk. More information about contaminants and potential health effects can be obtained by visiting the U.S. EPA’s website at
at
People with Weakened
Immune Systems
Although Santa Ana meets all drinking water standards, some people may be more vulnerable to contaminants in drinking water than the general population.
These people should seek advice about drinking water from their health care providers. U.S. EPA/CDC (U.S. Centers for Disease Control and Prevention) guidelines on appropriate means to reduce the risk of infection by Cryptosporidium and other microbial contaminants are available from the U.S. EPA’s Safe Drinking Water Hotline
at
Contaminants That May
Be Present
Water agencies are required to use the following language to discuss the source of contaminants that may reasonably be expected to be found in drinking water, including tap water and bottled water.
Contaminants that may be present in sources of drinking water include:
- Microbial contaminants, such as viruses and bacteria that may come from sewage treatment plants, septic systems, agricultural livestock operations and wildlife.
-
Inorganic contaminants, such as salts and metals, that can be naturally occurring or result from urban stormwater runoff, industrial or domestic wastewater discharges, oil and gas production, mining
or farming. - Pesticides and herbicides that may come from a variety of sources such as agriculture, urban stormwater runoff and residential uses.
- Organic chemical contaminants including synthetic and volatile organic chemicals that are byproducts of industrial processes and petroleum production, and can also come from gas stations, urban stormwater runoff, agricultural application and septic systems.
- Radioactive contaminants, that can be naturally occurring or be the result of oil and gas production and mining activities.
7
2020 | WATER QUALITY
REPORT
Drinking water, including bottled water, may reasonably be expected to contain at least small amounts of some contaminants.
Protecting Water Quality at the Source
Source water protection is an important issue for all of California. Treatment
to remove specific contaminants can be more expensive than measures to protect water at the source, which is why MWD and the City of Santa Ana invest resources to support improved watershed protection programs that in
turn safeguard our groundwater.
Imported Water Assessment—
Large water utilities, like MWD, are required by the Division of Drinking Water (DDW) to conduct an initial source water assessment, which is then updated through watershed sanitary surveys every five years. Watershed sanitary surveys examine possible sources of drinking water contamination and recommend actions to better protect these source waters. The most recent surveys for MWD’s source waters are the Colorado River Watershed Sanitary Survey – 2015 Update, and the State Water Project Watershed Sanitary Survey – 2016 Update.
You can request a copy of the most recent Watershed Sanitary Surveys by
calling MWD at
Groundwater Assessment—
An assessment of the drinking water wells for the City of Santa Ana was completed in December 2019. As in any urban area, Santa Ana’s wells are considered most vulnerable to historic agricultural activities, golf courses and application of fertilizers, which are associated with contaminants detected in the water supply. Our wells are also considered most vulnerable to chemical/ petroleum pipelines, chemical/petroleum processing, dry cleaners, gas stations, junk/scrap/salvage yards, metal plating/ finishing/fabrication, plastics/synthetics producers and sewer collection systems, although constituents associated with these activities were not detected. These water sources are tested throughout the year to ensure the
supplied water remains safe.
Safeguarding Our Groundwater
Is Everyone’s Responsibility
Here’s what you can do to help protect
Santa Ana’s drinking water source:
Limit your use of fertilizers and pesticides. The hazardous chemicals in both can reach our drinking water source.
Pick up after your pets.
Dispose of chemicals properly; take used motor oil and paint to a recycling center.
Find a watershed protection organization, like the Santa Ana Watershed Association, and volunteer to help.
8
2020 | WATER QUALITY
REPORT
Help Protect Your Public Water System
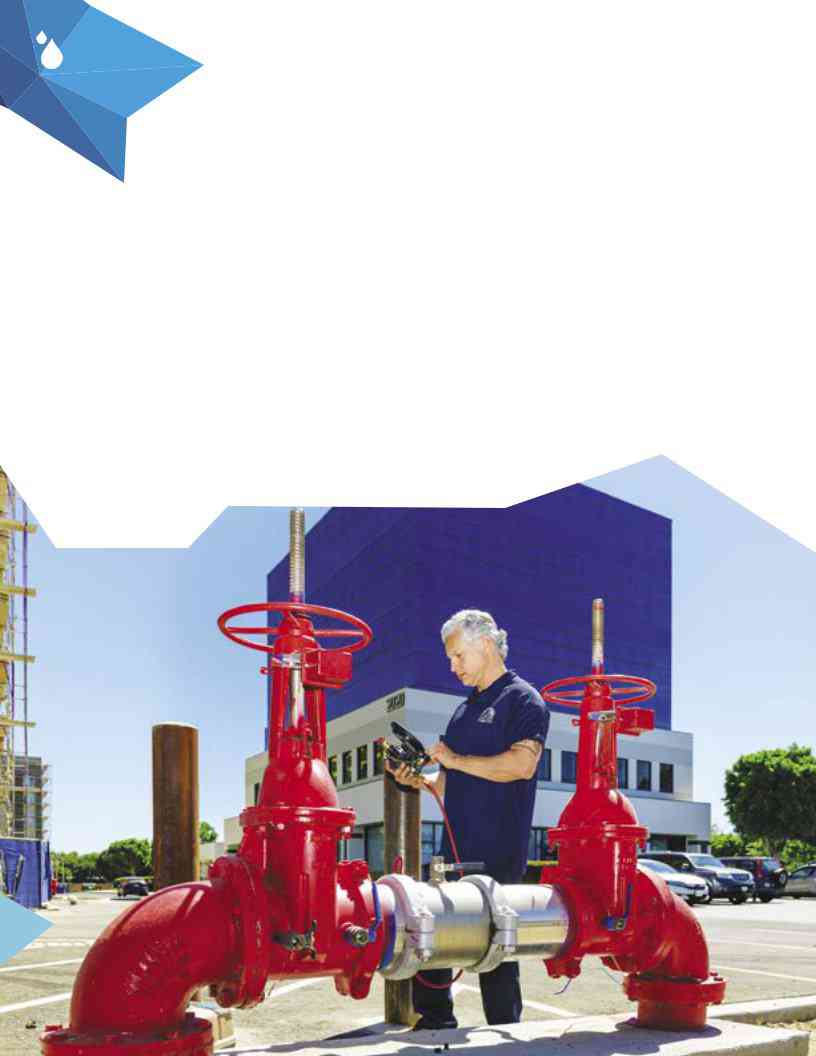
Cross Connection Control (CCC) Program
Water Resources Division staff uses his gauge to test a backflow prevention assembly.
Cross connections are dangerous if no protective measures are taken. Cross connections may happen when a water supply line is connected to equipment or systems containing a
As a homeowner, you are responsible for preventing contaminants from entering into your water system as well as the public water distribution system by properly installing and maintaining backflow prevention devices. These devices protect you and your community from a possible contamination event. Backflow devices help further safeguard our potable water system.
Commonly Used Residential Backflow Prevention Devices
Air Gap:
Used mainly on tanks and faucets, it is a gap between the pipe and the container.
Atmospheric Vacuum Breaker:
It has an air inlet valve that will drop to draw in air thus preventing customer’s water from entering Santa Ana’s water mains.
Pressure Vacuum Breaker:
Used mainly on lawn irrigation systems. It has a
pressure drop within a water line.
9
2020 | WATER QUALITY
REPORT
Additional Information of Interest
Cryptosporidium.Lead.
Cryptosporidium is a microbial pathogen found in surface water throughout the U.S. To date, cryptosporidium has not been detected in our water supply. U.S. EPA/CDC (U.S. Centers for Disease Control and Prevention) guidelines on appropriate means to lessen the risk of infection by cryptosporidium and other microbial contaminants are available from the Safe Drinking Water Hotline at
cdc.gov/parasites/crypto/index.html.
Perchlorate.
Perchlorate has been shown to interfere with uptake of iodide by the thyroid gland, and to thereby reduce the production of thyroid hormones, leading to adverse effects associated with inadequate hormone levels. Thyroid hormones are needed for normal prenatal growth and development of the fetus, as well as for normal growth and development in the infant and child. In adults, thyroid hormones are needed for normal metabolism and mental function.
If present, elevated levels of lead can cause serious health problems, especially for pregnant women and young children. Lead in drinking water is primarily from materials and components associated with service lines and home plumbing. The City of Santa Ana is responsible for providing high quality drinking water, but cannot control the variety of materials used in plumbing components. If you live in an older house that has copper piping with lead solder, you can minimize the potential for lead exposure. When your water has been sitting for several hours in the pipes, simply flush your tap for
30 seconds to 2 minutes before using water for drinking or cooking. If you do so, consider collecting the flushed water and reuse it for another beneficial purpose, such as watering plants. If you are concerned about lead in your water, you may wish to have your water tested. Information on lead in drinking water, testing methods, and steps you can take to minimize exposure are available from the U.S. EPA Safe Drinking Water Hotline at
Fluoride.
The City of Santa Ana receives approximately 23 percent of its water supply from MWD. Beginning in October 2007, MWD joined a majority of the nation’s public water suppliers in adding fluoride to the treated water it supplies to state water agencies, a plan approved by the CDC and the State Water Board. Santa Ana’s well water has a naturally occurring fluoride range level of 0.18
to 0.5 ppm. Water provided by MWD has been adjusted to the optimal level for dental health of 0.7 to 0.8 parts per million. Additional information may be found by calling MWD’s Water Quality Information Hotline at
www.bit.ly/ADA_flouride.
10
2020 | WATER QUALITY
REPORT
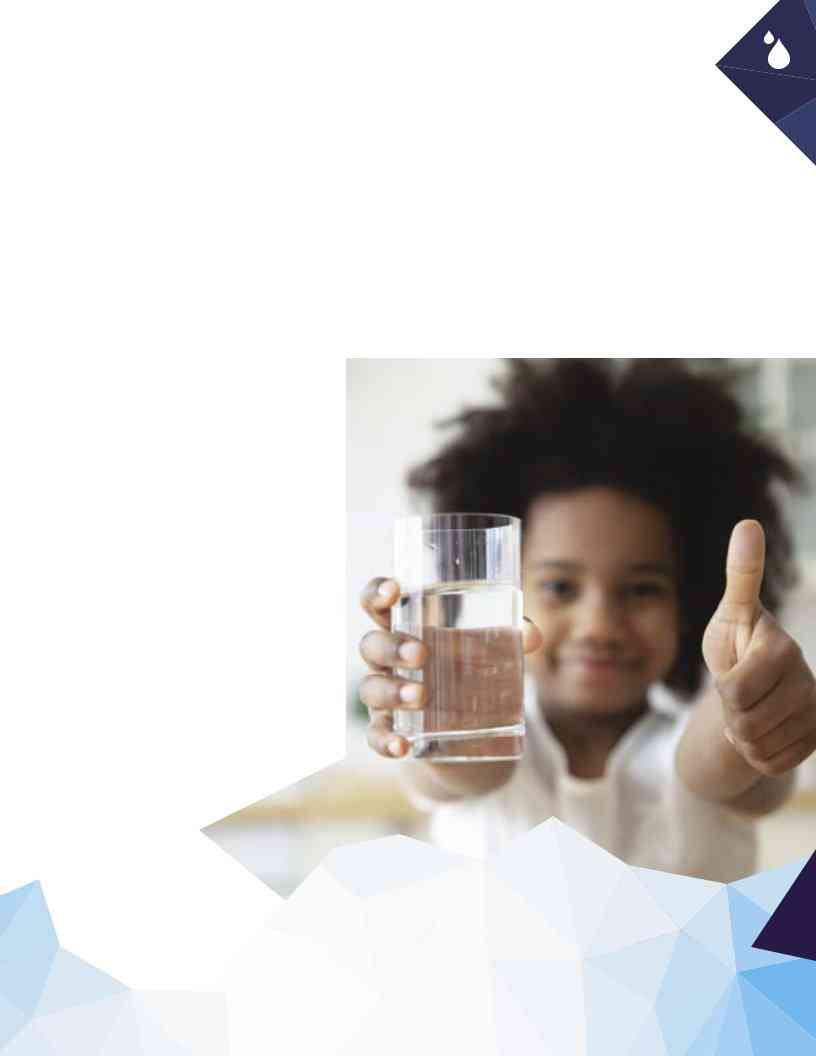
Santa Ana’s drinking water is safe and meets all quality standards set by both the state and federal government.
11
2020 | WATER QUALITY
REPORT
Understanding
PFAS
PFAS are present in many common items that we come in contact with on a regular basis and water is just one of many ways that humans can be exposed to these substances.
PFOS and PFOA are two chemicals we, the Santa Ana Water Resources Division and other agencies across Orange
County, are watching for in water.
What are PFOS and PFOA?
Dating back to the 1940s, Perfluorooctanoic acid (PFOA) and perfluorooctane sulfonate (PFOS) have been commonly used to coat carpets, clothes, furniture, food packaging, cookware and other products. PFOA and PFOS are part of a larger group of
Most people have been exposed to these chemicals through consumer products, but drinking water can be an additional source of exposure in communities where these chemicals have entered water supplies.
Where have PFAS been found?
PFOA and PFOS are common in groundwater in urban and industrial areas like Orange County, where remnant traces from consumer products and factories, military bases and other industrial uses are found. PFAS can make their way into rivers, such as the Santa Ana River, which replenishes much of Orange County’s groundwater that may be used for water supplies or for private drinking water wells.
Testing of Santa Ana River surface water in Orange County has detected PFAS, indicating the presence of PFAS in upstream treated wastewater discharges from sewage treatment facilities in Riverside and San Bernardino counties. PFAS end up in wastewater by rinsing products containing the chemicals, which go down the drain and into waste treatment plants.
What are the Federal regulations governing PFAS?
In May 2016, the U.S. EPA issued a lifetime health advisory for PFOS and PFOA for drinking water, advising municipalities that they should notify their customers of the presence of levels over 70 parts per trillion in community water supplies. EPA recommended that customer notifications include information on the increased risk
to health, especially for susceptible populations.
What is California continuing to do about PFAS?
Due to advancement in detection technology, PFAS are now being reliably detected at much lower levels. In August 2019, the Division of Drinking Water (DDW) revised its previous interim Notification Levels surrounding PFOA and PFOS. The current established Notification Levels for PFOA and PFOS are 5.1
Parts per million, billion or trillion are ways to measure tiny amounts of something in water or air. It is a microscopic measurement where a
Results above the Notification Level require agencies to notify the governing body for the areas where the water has been served within 30 days of receiving the verifying test results. If the Response Level is exceeded in drinking water provided to consumers, DDW recommends that the water agency remove the water source from service or provide treatment.
DDW has also formally requested that OEHHA develop a draft Public Health Goal (PHG), which is the first step in establishing a Maximum Contaminant
Level for PFOA and PFOS.
What are Notification Levels?
Notification Levels are precautionary
through current testing means.
Does Santa Ana test for PFAS?
Public health has always been a top priority for the City of Santa Ana. Following the DDW’s initial Notification and Response Levels for PFOA and PFOS, Santa Ana proactively tested for the presence of PFOA and PFOS in August 2018. Santa Ana’s Well 38, located near the Santiago Creek Recharge Basin, had detectable results above the Notification Levels but below the Response Level for PFOA and PFOS. Utilizing extreme caution, Santa Ana voluntarily moved Well 38 offline in September 2018 and this well has remained out of service since then.
In March 2019, the DDW issued monitoring orders as part of a statewide phased PFAS Investigation Plan to determine the occurrence and extent of PFAS in California. As part of this statewide plan, the City of Santa Ana
What is Santa Ana doing to protect our drinking water from PFAS?
Santa Ana’s water is thoroughly treated and tested to ensure it meets some of the highest standards in the world. We watch closely for PFOA and PFOS in our water and will ensure that our city’s water meets or exceeds state and federal regulations. The following is part of our action plan related
to PFAS:
- Continue monitoring PFOA and PFOS levels in our wells through quarterly samplings.
- Make quarterly test results available to the public through our website.
- Notify local government officials of areas served by the city’s groundwater sources that have exceeded the Notification Levels for PFOA and PFOS.
- Stay current with State and Federal regulations to assure our drinking water is always safe for consumption.
- Make plans to remove any source of water that exceeds the Response Level for PFOA and PFOS, should that occur.
-
Continue to review
long-term solutions with the OCWD, which manages the groundwater basin where our wells are located.
It is important to note that the groundwater Santa Ana supplies to residents does not come directly from the Santa Ana River. We drill up to 1,000 feet into the deep aquifers comprising the Orange County Groundwater Basin, which act as a natural filter for the groundwater we pump through our
is conducting additional monitoring (sampling and testing). Santa Ana has retested its
12
2020 | WATER QUALITY
REPORT
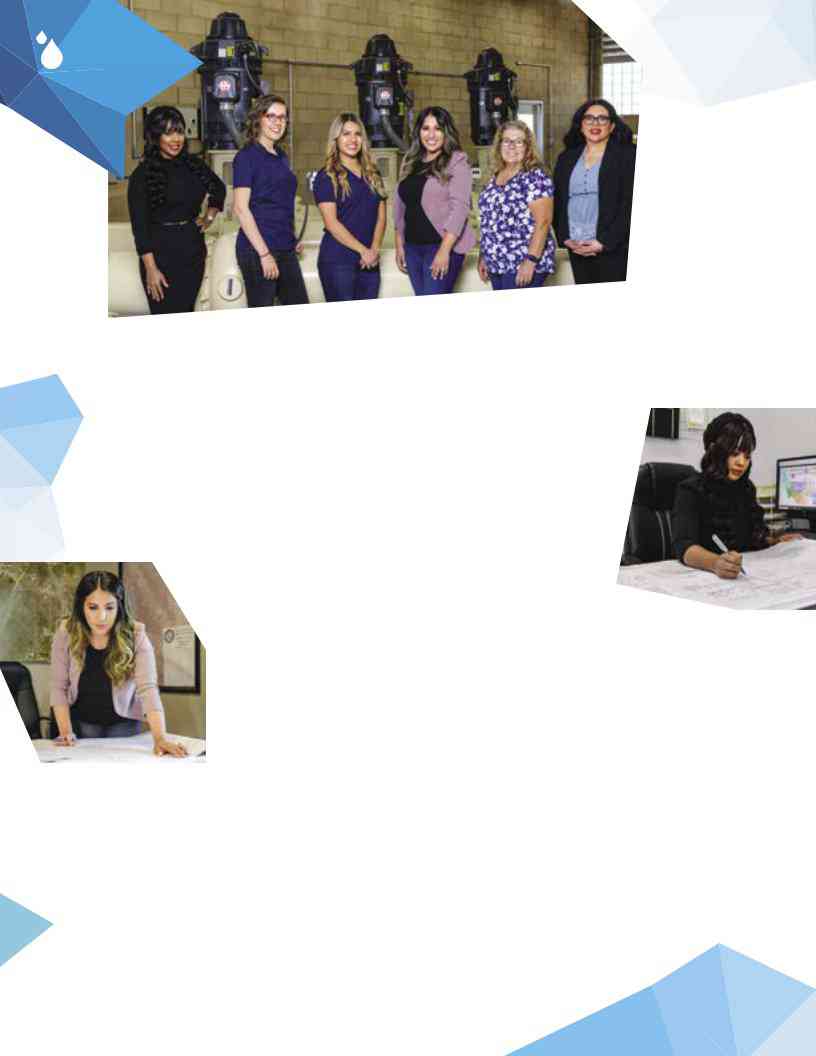
Women In Water
13
2020 | WATER QUALITY
REPORT
Just a decade ago, few women were working in the water sector. What’s more, even fewer served in technical and managerial positions. But change is happening and nowhere is this more evident than at Santa Ana’s Water Resources Division.
Meet some of the women who are a driving force behind your water quality, treatment, distribution and planning.
Engineering
Yolanda’s interest in water peaked when she took several college courses in water as she was working on her degree in civil engineering. While her career took another route after receiving her degree, she was excited to join the Water Resources Division in December 2020 after learning about the importance of her role.
“I didn’t have to think twice about accepting this position,” she explains. “We all use and need water to live. How amazing is it that we get to work behind the scenes and provide water to thousands of people.”
In her role as Assistant Engineer, she works primarily with Capital Improvement Projects, designing plans for pipeline replacement and preparing specifications and engineers’ estimates. These are used to prepare requests for proposals and agreements in procuring services. She then sees these projects through construction, reviewing contractors’ submittals and visiting construction sites.
Fallon is also an Assistant Engineer. She has a bachelor’s degree in mechanical engineering and a master’s degree in civil engineering. She joined the Water Resources team more than six months ago and works
primarily with Water Production.
She enjoys the
in modernizing the City’s water infrastructure.
She prepares
requests for proposals, pump and motor specifications, water pumping projection plans, and reports pertaining to water projects such as upgrading pumping facilities and rehabilitating groundwater wells. She assists in project oversight, which entails reviewing engineering plans, interfacing with contractors and other water agencies and collaborating with system operators on a daily basis.
“The employees here are passionate about providing great water to the residents,” she says. “I love how much history is involved in water production. I research historical records about annual water usage and calculate future water usage. It’s interesting to see how water usage has changed and is trending towards conservation.”

Water Quality
Preserving the quality and availability of our water supply through water conservation is where Nadiya wants to make a difference.
“With only about 0.3% of earth’s water available for human consumption, drinkable water is a valuable and scarce resource,” explains Nadiya. “We are fortunate to live in Santa Ana which
is situated on the deepest part of a large aquifer from which we draw the
As a Water Quality Inspector, Nadiya works hard to ensure that this great- tasting water is ready for consumption for all Santa Ana residents. Drawing on her bachelor’s degree in civil- environmental engineering, she
is responsible for water quality compliance and water conservation. Her responsibilities range from water quality sampling and reporting to performing inspections and engaging the public with
Solving different issues each day is a challenge Nadiya welcomes in her role; so is finding new ways to educate the public on the high quality of their potable water and its conservation.
“Together we can make impactful and
Joining Nadiya as a Water Quality Inspector is Itzel. She worked part time reading water meters for other cities while attending Orange Coast College for respiratory therapy. During her tenure at the City of Huntington Beach, she cross trained in different departments including water quality, water conservation and the meter shop, where she helped program AMI smart meters.
She later enrolled in Santiago Canyon College’s program to take courses on water treatment and distribution before joining the City of Santa Ana.
Itzel focuses on taking weekly samples at Santa Ana’s reservoirs, responding to customer calls about water pressure and water quality, and addressing resident concerns around water waste.
“When I respond to a call, people expect a guy to come out,” she explains. “I don’t let that phase me. I’m confident in my skills and knowledge.”
Itzel is also actively involved in educating the public about water quality and conservation.
“I love interacting with the community and educating people about the safety of their tap water. I know I make a difference in the community when I respond to each call.”
14
2020 | WATER QUALITY
REPORT

|
“I enjoy the variety of |
|
my |
|
that touches upon |
|
every aspect of the |
|
Water Resources |
|
Division,” she said. “But |
|
most of all, I enjoy the |
15 |
people I work with!” |
|
Administration/Management
When Kathia started with Public Works 11 years ago as an accounting assistant, she was at a loss. She had a degree, but didn’t feel she had many career options.
Soon after, everything changed. She said being surrounded by people who were passionate about the City’s sewer and water system was not only impressive, it was aspirational.
“It helped me fine tune my career options and return to school to gain a better understanding of Public Works,” she explains. “I officially joined the City’s water team four years ago and a new professional world opened up for me.”
As Projects Manager, her duties include administration and contracts management, ultimately ensuring
“If people only knew all the expertise and resources that go into our infrastructure and processes to deliver
Few people can say they have served the Santa Ana community for more than three decades. Lucy is one exception.
She enjoyed a long tenure with Santa Ana’s Park & Recreation Department before joining the Water Resources team eleven years ago. She had many choices at the time, but it was the friendly and
Lucy juggles a wide range of activities in her position as Senior Office Assistant. She processes purchasing requests and orders supplies. She covers the dispatch line, which is the central number residents call for questions about utility bills, trash pickup and street sweeping, and for reporting graffiti, water waste, and water and sewer emergencies. She schedules new employee interviews and processes annual employee evaluations. She even processes rental permits for fire hydrants, which are temporary water service connections needed for construction sites.
Whether you are interested in management or a technical career, such as engineering, we hope each of the women profiled here are an inspiration and example of the many opportunities available in the water and sewer industry.
Advice for Other Women Interested in a Similar Career
There are limitless opportunities in our field. Don’t allow yourself to feel intimidated by the challenges, instead accept them as lessons to learn from. – Yolanda
For women currently in science, technology, engineering, and mathematics (STEM), you are a trailblazer for future generations of women. Continue to show your
– Fallon
Do not get intimidated with things that ‘seem’ unachievable. Pursue your dreams and don’t let anything or anyone stop you! – Nadiya
Go for it and learn as much as you can. Your skills and knowledge will give you the confidence to advance in this field. I’ve met other women in water and they motivate me to work harder because they also advocate ‘there’s nothing we cannot do’. – Itzel
It’s my hope that other women will be inspired by our stories and take a moment to explore new career opportunities in the water and sewer industry. Providing essential services to the community is a fulfilling career path and one to be proud of. – Kathia
Enjoy each and every day! – Lucy
2020 | WATER QUALITY
REPORT
How To Read The
Data Tables
You will find three data tables showing a list of chemicals tested in each of the following water sources:
- Santa Ana Distribution System
- Santa Ana Groundwater
- Metropolitan Water District of Southern California Treated Surface Water
For each table, begin with the chemical and read across.
1 |
The column marked “Chemicals” |
|
lists the substances found in the |
water Santa Ana delivers.
2 MCL is the highest level of substance (contaminant) allowed.
3 MCLG is the goal level for that substance (this may be lower than what is allowed). Average Amount is the average level measured for the substance (less is better).
4 |
Range of Detections is the highest |
|
and lowest amounts measured. |
5 |
A “No” under MCL Violation |
|
indicates government requirements |
|
were met. |
6 |
Typical Sources in Drinking Water |
|
tells you where the constituent |
usually originates.
Note: “Unregulated Constituents” are measured, but maximum allowed contaminant (MCL) levels have not been established by the government.
16
2020 | WATER QUALITY
REPORT

Glossary
Use this glossary to understand the terms, abbreviations and measurements used in the data tables.
Terms & Abbreviations
Chemicals
Components or elements found in drinking water.
Maximum Contaminant
Level (MCL)
The highest level of a contaminant that is allowed in drinking water. Primary MCLs are set as close to the PHGs
(or MCLGs) as is economically and technologically feasible. Secondary MCLs are set to protect the color, odor, taste, and appearance of drinking water.
Maximum Contaminant Level Goal (MCLG)
The level of a contaminant in drinking water below which there is no known or expected risk to health. MCLGs are set
by the U.S. EPA.
Maximum Residual Disinfectant Level (MRDL)
The highest level of a disinfectant allowed in drinking water. There is convincing evidence that addition of a disinfectant is necessary for control of microbial contaminants.
Primary Drinking Water Standard (PDWS)
The MCLs and MRDLs for contaminants that affect health along with their monitoring and reporting requirements, and water treatment requirements.
Public Health Goal (PHG)
The level of a contaminant in drinking water below which there is no known or expected risk
to health. PHGs are set by the California Environmental Protection
Agency (Cal/EPA).
Regulatory Action Level
The concentration of a contaminant, which, if exceeded, triggers treatment or other requirements that a water system must follow.
Treatment Technique (TT)
A required process intended to reduce the level of contaminants in drinking water that are difficult and sometimes impossible to measure directly.
Maximum Residual Disinfectant Level Goal (MRDLG)
The level of a drinking water disinfectant below which there is no known or expected risk to health. MRDLGs
do not reflect the benefits of the use of disinfectants to control
microbial contaminants.
Variances and Exemptions
Permissions from the State Water Board to exceed an MCL or not comply with a treatment technique under certain conditions.
17
2020 | WATER QUALITY
REPORT
Measurements
Santa Ana conducts extensive sampling and testing to ensure your water meets all water quality standards. In 2020, we collected 16,705 water quality samples at various sampling points in our water system; all of which were below state and federal maximum allowable levels.
Contaminants are measured in:
Parts per million (ppm)
or milligrams per liter (mg/L)
Parts per billion (ppb)
or micrograms per liter (μg/L)
PicoCuries per liter (pCi/L)
A measurement of radioactivity in water.
Micromhos per centimeter (umho/cm)
A measurement for conductivity of water.
Grains per gallon (grains/gal)
A measurement of water hardness often used for sizing household water softeners. One grain per gallon is equal to 17.1 mg/L of hardness.
Nephelometric Turbidity
Units (NTU)
A measurement of the clarity of water. Turbidity in excess of 5 NTU is noticeable to the average person.
Additional Abbreviations
AL |
= Regulatory Action Level |
NA |
= Not Applicable |
ND |
= Not Detected |
NL |
= Notification Level |
SMCL |
= Secondary MCL |
18
2020 | WATER QUALITY
REPORT
2020 Water
Quality Tables
2020 CITY OF SANTA ANA DISTRIBUTION SYSTEM WATER QUALITY
1 |
2 |
3 |
4 |
5 |
6 |
Type
MCL |
Average Amount |
Range of Detections |
(MRDL/MRDLG) |
MCL
Violation?
Typical Sources 0f Chemical
DISINFECTANT RESIDUAL AND DISINFECTION
Chlorine Residual (ppm) |
(4 / 4) |
0.88 |
ND - 2.66 |
|
No |
Disinfectant Added for Treatment |
Total Trihalomethanes (ppb) 1 |
80 |
27 |
ND - 32 |
|
No |
Byproducts of Chlorine Disinfection |
Haloacetic Acids (ppb) 1 |
60 |
9 |
ND - 13 |
|
No |
Byproducts of Chlorine Disinfection |
AESTHETIC QUALITY |
|
|
|
|
|
|
Odor (threshold odor number) |
3* |
1 |
1 - 2 |
|
No |
|
|
|
|
|
|
|
|
Turbidity (ntu) |
5* |
<0.1 |
ND - 0.8 |
|
No |
Erosion of natural deposits |
|
|
|
|
|
|
|
Eight locations in the distribution system are tested quarterly for total trihalomethanes and haloacetic acids. |
|
|
||||
Fifty locations are tested monthly for color, odor and turbidity. Color was not detected in 2020 |
|
|
||||
Microbiological |
MCL |
MCLG |
Highest Monthly |
MCL |
Typical Sources of Chemical |
|
Percent Positives |
Violation? |
|||||
|
|
|
|
|||
2 |
5.0 |
0 |
0.49% |
No |
Naturally present in the environment |
|
Total Coliform Bacteria |
No more than 5.0% of the monthly samples may be positive for total coliform bacteria.
The occurrence of 2 consecutive total coliform positive samples, one of which contains fecal coliform/E.coli, constitutes an acute MCL violation.
LEAD AND COPPER ACTION LEVELS AT RESIDENTIAL TAPS
Chemical |
Action Level |
Public |
90th Percentile |
Sites Exceeding AL / |
AL |
Typical SourcesOf Chemical |
||
(AL) |
Health Goal |
Value |
Number of Sites |
Violation? |
||||
|
|
|
||||||
Lead |
|
15 |
0.2 |
ND |
0 / 135 |
No |
Internal corrosion of household water plumbing |
|
|
systems; discharges from industrial |
|||||||
(ppb) 3 |
||||||||
|
|
|
|
|
manufacturers; erosion of natural deposits |
|||
Copper |
1.3 |
0.3 |
0.14 |
0 / 135 |
No |
Internal corrosion of household water plumbing |
||
(ppm) |
3 |
systems; discharges from industrial |
||||||
|
|
|
|
|
manufacturers; erosion of natural deposits |
|||
|
|
|
|
|
|
|
||
|
|
|
|
|
|
|
|
|
In 2018, 135 residences were tested for lead and copper
UNREGULATED CHEMICALS REQUIRING MONITORING IN THE DISTRIBUTION SYSTEM
Chemical |
Notification |
PHG |
Average |
Range of |
Most Recent |
|
Level |
Amount |
Detections |
Sampling Date |
|||
|
|
|||||
Bromochloroacetic acid (ppb) |
NA |
NA |
0.94 |
ND - 3.9 |
2020 |
|
Bromodichloroacetic acid (ppb) |
NA |
NA |
0.68 |
ND - 2.1 |
2020 |
|
Chlorodibromoacetic acid (ppb) |
NA |
NA |
0.47 |
ND - 1.4 |
2020 |
|
Dibromoacetic acid (ppb) |
NA |
NA |
0.88 |
ND - 2.6 |
2020 |
|
Dichloroacetic acid (ppb) |
NA |
MCLG = 0 |
1.2 |
ND - 6.1 |
2020 |
|
Monobromoacetic acid (ppb) |
NA |
NA |
0.1 |
ND - 0.6 |
2020 |
|
Trichloroacetic acid (ppb) |
NA |
MCLG = 20 |
0.7 |
ND - 2.5 |
2020 |
- Total chromium is regulated with an MCL of 50 ppb but was not detected, based on the detection limit for purposes of reporting of 10 ppb. Total chromium was included as part of the unregulated chemicals requiring monitoring.
19
2020 | WATER QUALITY
REPORT
2020 Water
Quality Tables
|
|
2020 CITY OF SANTA ANA GROUNDWATER QUALITY |
||||||
|
1 |
2 |
2 |
3 |
4 |
5 |
|
6 |
|
|
|
|
|
|
|
|
|
|
Chemical |
MCL |
PHG |
Average |
Range of |
MCL |
Most Recent |
Typical Source of Chemical |
|
(MCLG) |
Amount |
Detections |
Violation? |
Sampling Date |
|||
|
|
|
|
|||||
|
Radiologicals |
|
|
|
|
|
|
|
|
Gross Alpha (pCi/L) |
15 |
(0) |
<3 |
ND - 13.98 |
No |
2020 |
Erosion of Natural Deposits |
|
|
|
|
|
|
|
|
|
|
Uranium (pCi/l) |
20 |
0.43 |
3 |
ND - 8.18 |
No |
2020 |
Erosion of Natural Deposits |
|
|
|
|
|
|
|
|
|
|
Inorganic Chemicals |
|
|
|
|
|
|
|
|
Barium (ppm) |
1 |
2 |
< 0.1 |
ND - 0.14 |
No |
2020 |
Erosion of Natural Deposits |
|
|
|
|
|
|
|
|
|
|
Fluoride (ppm) |
2 |
1 |
0.34 |
0.18 - 0.47 |
No |
2020 |
Erosion of Natural Deposits |
|
|
|
|
|
|
|
|
|
|
Nitrate (ppm as N) |
10 |
10 |
1.88 |
0.45 - 4 |
No |
2020 |
Runoff and Leaching from Fertilizer Use; |
|
Leaching from Septic Tanks and Sewage; |
|||||||
|
|
|
|
|
|
|
|
Erosion of Natural Deposits |
|
|
|
|
|
|
|
|
|
|
Nitrate + Nitrite (ppm as N) |
10 |
10 |
1.88 |
0.45 - 4 |
No |
2020 |
Runoff and Leaching from Fertilizer Use; |
|
Leaching from Septic Tanks and Sewage; |
|||||||
|
|
|
|
|
|
|
|
Erosion of Natural Deposits |
|
|
|
|
|
|
|
|
|
|
Perchlorate (ppb) |
6 |
1 |
<4 |
ND - 4.5 |
No |
2020 |
Discharge from Industrial Operations |
|
|
|
|
|
|
|
|
|
|
Secondary Standards* |
|
|
|
|
|
|
|
|
Chloride (ppm) |
500* |
NA |
54 |
19.3 - 99.9 |
No |
2020 |
Erosion of Natural Deposits |
|
Color (color units) |
15* |
NA |
<1 |
ND - 3 |
No |
2020 |
|
|
|
|
|
|
|
|
|
|
|
Specific Conductance (umho/cm) |
1,600* |
NA |
686 |
525 - 961 |
No |
2020 |
Substance That Forms Ions When In Water |
|
Sulfate (ppm) |
500* |
NA |
92.2 |
61.8 - 125 |
No |
2020 |
Erosion of Natural Deposits |
|
Total Dissolved Solids (ppm) |
1,000* |
NA |
413 |
292 - 606 |
No |
2020 |
Erosion of Natural Deposits |
|
|
|
|
|
|
|
|
|
|
Turbidity (ntu) |
5* |
NA |
<0.1 |
ND - 0.3 |
No |
2020 |
Soil Runoff |
|
Unregulated Constituents |
|
|
|
|
|
|
|
|
Alkalinity, total (ppm as CaCO3) |
Not Regulated |
NA |
168 |
156 - 195 |
NA |
2020 |
Erosion of Natural Deposits |
|
Bicarbonate (ppm as HC03) |
Not Regulated |
NA |
204 |
190 - 238 |
NA |
2020 |
Erosion of Natural Deposits |
|
Boron (ppm) |
NL = 1 |
NA |
<0.1 |
ND - 0.11 |
NA |
2020 |
Erosion of Natural Deposits |
|
Calcium (ppm) |
Not Regulated |
NA |
77 |
52.5 - 116 |
NA |
2020 |
Erosion of Natural Deposits |
|
Hardness, total (grains/gal) |
Not Regulated |
NA |
15 |
11 - 22 |
NA |
2020 |
Erosion of Natural Deposits |
|
Hardness, total (ppm as CaCO3) |
Not Regulated |
NA |
255 |
180 - 379 |
NA |
2020 |
Erosion of Natural Deposits |
|
Magnesium (ppm) |
Not Regulated |
NA |
14.8 |
10.9 - 21.8 |
NA |
2020 |
Erosion of Natural Deposits |
|
Perfluoro butane sulfonic acid (ppt) |
NL = 500 |
NA |
6.5 |
ND - 9.2 |
NA |
2020 |
Industrial Discharge |
|
|
|
|
|
|
|
|
|
|
Perfluoro heptanoic acid (ppt) |
Not Regulated |
NA |
4.5 |
ND - 6.6 |
NA |
2020 |
Industrial Discharge |
|
Perfluoro hexane sulfonic acid (ppt) |
Not Regulated |
NA |
12.2 |
7.2 - 15.5 |
NA |
2020 |
Industrial Discharge |
|
|
|
|
|
|
|
|
|
|
Perfluoro octane sulfonic acid (ppt) |
NL = 6.5 |
NA |
21.4 |
12.5 - 27.9 |
NA |
2020 |
Industrial Discharge |
|
Perfluoro octanoic acid (ppt) |
NL = 5.1 |
NA |
15.5 |
9.7 - 20 |
NA |
2020 |
Industrial Discharge |
|
Perfluorohexanoic acid (ppt) |
Not Regulated |
NA |
8.1 |
5.2 - 11 |
NA |
2020 |
Industrial Discharge |
|
pH (pH units) |
Not Regulated |
NA |
7.9 |
7.6 - 8.1 |
NA |
2020 |
Acidity, Hydrogen Ions |
|
|
|
|
|
|
|
|
|
|
Potassium (ppm) |
Not Regulated |
NA |
2.2 |
1.6 - 3.1 |
NA |
2020 |
Erosion of Natural Deposits |
|
|
|
|
|
|
|
|
|
|
Sodium (ppm) |
Not Regulated |
NA |
43.7 |
34.5 - 55.2 |
NA |
2020 |
Erosion of Natural Deposits |
|
|
|
|
|
|
|
|
|
*Contaminant is regulated by a secondary standard to maintain aesthetic qualities (taste, odor, color).
UNREGULATED CHEMICALS REQUIRING MONITORING
Chemical |
Notification |
PHG |
Average |
Range of Detections |
Most Recent Sampling Date |
|
Level |
Amount |
|||||
|
|
|
|
|||
Germanium (ppb) |
NA |
NA |
0.1 |
ND - 0.4 |
2018 |
|
|
|
|
|
|
|
|
Manganese (ppb) ** |
SMCL = 50 |
NA |
2.2 |
0.8 - 3.3 |
2018 |
|
|
|
|
|
|
|
- Manganese is regulated with a secondary standard of 50 ppb but was not detected, based on the detection limit for purposes of reporting of 20 ppb. Manganese was included as part of the unregulated chemicals requiring monitoring.
2020 | WATER QUALITY
REPORT
2020 Water
Quality Tables
|
2020 MWD TREATED SURFACE WATER |
|||||||
1 |
2 |
2 |
3 |
|
4 |
5 |
6 |
|
|
|
|
|
|
|
|
|
|
Chemical |
MCL |
PHG |
Average |
|
Range of |
MCL |
Typical Source of Chemical |
|
(MCLG) |
Amount |
|
Detections |
Violation ? |
||||
|
|
|
|
|||||
Radiologicals - Tested in 2020 |
|
|
|
|
|
|
||
Alpha Radiation (pCi/L) |
15 |
(0) |
ND |
|
ND - 3 |
No |
Erosion of Natural Deposits |
|
|
|
|
|
|
|
|
|
|
Beta Radiation (pCi/L) |
50 |
(0) |
ND |
|
ND - 5.9 |
No |
Decay of Natural and |
|
|
|
|
|
|
|
|
|
|
Uranium (pCi/L) |
20 |
0.43 |
2 |
|
1 - 3 |
No |
Erosion of Natural Deposits |
|
|
|
|
|
|
|
|
|
|
Inorganic Chemicals - Tested in 2020 |
|
|
|
|
|
|
||
|
|
|
|
|
|
|
|
|
Aluminum (ppm) |
1 |
0.6 |
0.137 |
|
ND - 0.26 |
No |
Treatment Process Residue, Natural Deposits |
|
|
|
|
|
|
|
|
|
|
Barium (ppm) |
1 |
2 |
0.107 |
|
0.107 |
No |
Refinery Discharge, Erosion of Natural Deposits |
|
|
|
|
|
|
|
|
|
|
Bromate (ppb) |
10 |
0.1 |
1.9 |
|
ND - 1.3 |
No |
Byproduct of Drinking Water Ozonation |
|
|
|
|
|
|
|
|
|
|
Fluoride (ppm) |
2 |
1 |
0.7 |
|
0.5 - 0.9 |
No |
Water Additive for Dental Health |
|
|
|
|
|
|
|
|
|
|
Secondary Standards - Tested in 2020 |
|
|
|
|
|
|
||
|
|
|
|
|
|
|
|
|
Aluminum (ppm) |
200* |
600 |
137 |
|
ND - 260 |
No |
Treatment Process Residue, Natural Deposits |
|
Chloride (ppm) |
500* |
NA |
94 |
|
93 - 94 |
No |
Runoff or Leaching from Natural Deposits |
|
Color (color units) |
15* |
NA |
1 |
|
1 |
No |
||
Odor (threshold odor number) |
3* |
NA |
2 |
|
2 |
No |
||
Specific Conductance (µmho/cm) |
1,600* |
NA |
970 |
|
964 - 975 |
No |
Substances That Form Ions In Water |
|
Sulfate (ppm) |
500* |
NA |
216 |
|
215 - 217 |
No |
Runoff or Leaching from Natural Deposits |
|
Total Dissolved Solids (ppm) |
1,000* |
NA |
592 |
|
582 - 603 |
No |
Runoff or Leaching from Natural Deposits |
|
Unregulated Constituents - Tested in 2020 |
|
|
|
|
|
|||
|
|
|
|
|
|
|
|
|
Alkalinity, total as CaCO3 (ppm) |
Not Regulated |
NA |
118 |
|
117 - 120 |
NA |
Runoff or Leaching from Natural Deposits |
|
Boron (ppm) |
NL = 1 |
NA |
0.13 |
|
0.13 |
NA |
Runoff or Leaching from Natural Deposits |
|
Calcium (ppm) |
Not Regulated |
NA |
66 |
|
65 - 67 |
NA |
Runoff or Leaching from Natural Deposits |
|
Hardness, total as CaCO3 (ppm) |
Not Regulated |
NA |
265 |
|
261 - 269 |
NA |
Runoff or Leaching from Natural Deposits |
|
Hardness, total (grains/gallon) |
Not Regulated |
NA |
15 |
|
15 |
NA |
Runoff or Leaching from Natural Deposits |
|
Magnesium (ppm) |
Not Regulated |
NA |
26 |
|
25 |
NA |
Runoff or Leaching from Natural Deposits |
|
NL = 10 |
NA |
3.1 |
|
3.1 |
NA |
Byproduct of Drinking Water Chloramination, |
||
|
Industrial Processes |
|||||||
|
|
|
|
|
|
|
||
pH (pH units) |
Not Regulated |
NA |
8.1 |
|
8.1 |
NA |
Hydrogen Ion Concentration |
|
Potassium (ppm) |
Not Regulated |
NA |
4.6 |
|
4.5 - 4.7 |
NA |
Runoff or Leaching from Natural Deposits |
|
|
|
|
|
|
|
|
|
|
Sodium (ppm) |
Not Regulated |
NA |
96 |
|
93 |
NA |
Runoff or Leaching from Natural Deposits |
|
|
|
|
|
|
|
|
|
|
Total Organic Carbon (ppm) |
TT |
NA |
2.4 |
|
2.2 - 2.7 |
NA |
Various Natural and |
|
|
|
|
|
|
|
|
||
Turbidity - combined filter effluent |
Treatment |
Turbidity |
TT |
Typical Source of Chemical |
||||
Metropolitan Water District Diemer Filtration Plant |
Technique |
Measurements |
Violation? |
|||||
|
||||||||
1) Highest single turbidity measurement |
0.3 NTU |
0.04 |
|
No |
Soil Runoff |
|||
2) Percentage of samples less than 0.3 NTU |
95% |
100% |
No |
Soil Runoff |
||||
|
|
|
|
|
|
|
|
|
Turbidity is a measure of the cloudiness of the water, an indication of particulate matter, some of which might include harmful microorganisms. Low turbidity in Metropolitan’s treated water is a good indicator of effective filtration. Filtration is called a “treatment technique” (TT). A treatment technique is a required process intended to reduce the level of chemicals in drinking water that are difficult and sometimes impossible to measure directly.
NTU = nephelometric turbidity units
UNREGULATED CHEMICALS REQUIRING MONITORING
|
Chemical |
Notification |
PHG |
Average |
Range of Detections |
Most Recent Sampling Date |
|
|
Level |
Amount |
|||||
|
|
|
|
|
|||
21 |
Germanium (ppb) |
NA |
NA |
0.1 |
ND - 0.4 |
2018 |
|
|
|
|
|
|
|
||
Manganese (ppb) ** |
SMCL = 50 |
NA |
2.2 |
0.8 - 3.3 |
2018 |
||
|
|||||||
|
|
|
|
|
|
|
- Manganese is regulated with a secondary standard of 50 ppb but was not detected, based on the detection limit for purposes of reporting of 20 ppb. Manganese was included as part of the unregulated chemicals requiring monitoring.
2020 | WATER QUALITY
REPORT
Notes
2020 Water Quality Tables
-
Trihalomethanes and Haloacetic Acids.
Twelve locations in the distribution system are tested quarterly for total trihalomethanes (TTHMs) and haloacetic acids (HAAS). - Coliform.
No more than 5% of the monthly samples may be positive for total coliform bacteria. The occurrence of 2 consecutive total coliform positive samples, one of which contains fecal coliform/E.coli, constitutes an acute MCL violation. This Consumer Confidence Report (CCR) reflects changes in drinking water regulatory requirements during 2016. All water systems are required to comply with the state Total Coliform Rule. Effective April 1, 2016,
all water systems are also required to comply with the federal Revised Total Coliform Rule. The new federal rule maintains the purpose to protect public health by ensuring the integrity of the drinking water distribution system and monitoring for the presence of microbials (i.e., total coliform and E. coli bacteria). The U.S. EPA anticipates greater public health protection as the new rule requires water systems that are vulnerable to microbial contamination to identify and fix problems. Water systems that exceed a specified frequency of total coliform occurrences are required to conduct an assessment to determine if any sanitary defects exist. If found, these must be corrected by the water system.
3. Lead and Copper.
In 2018, 135 residences were tested for lead and copper
A regulatory action level (AL) is the concentration of a contaminant which, if exceeded, triggers treatment or other requirements that a water system must follow. In 2020, no school submitted a
request to be sampled for lead.
4.Combined Filter Effluent
Turbidity (NTU).
Turbidity is a measure of the cloudiness of the water, an indication of particulate matter, some of which might include harmful microorganisms. Low turbidity in MWD’s treated water is a good indicator of effective filtration. Filtration is called a “treatment technique” (TT).
A treatment technique is a required process intended to reduce the level of chemicals in drinking water that are difficult and sometimes impossible to
measure directly.
22
2020 | WATER QUALITY
REPORT
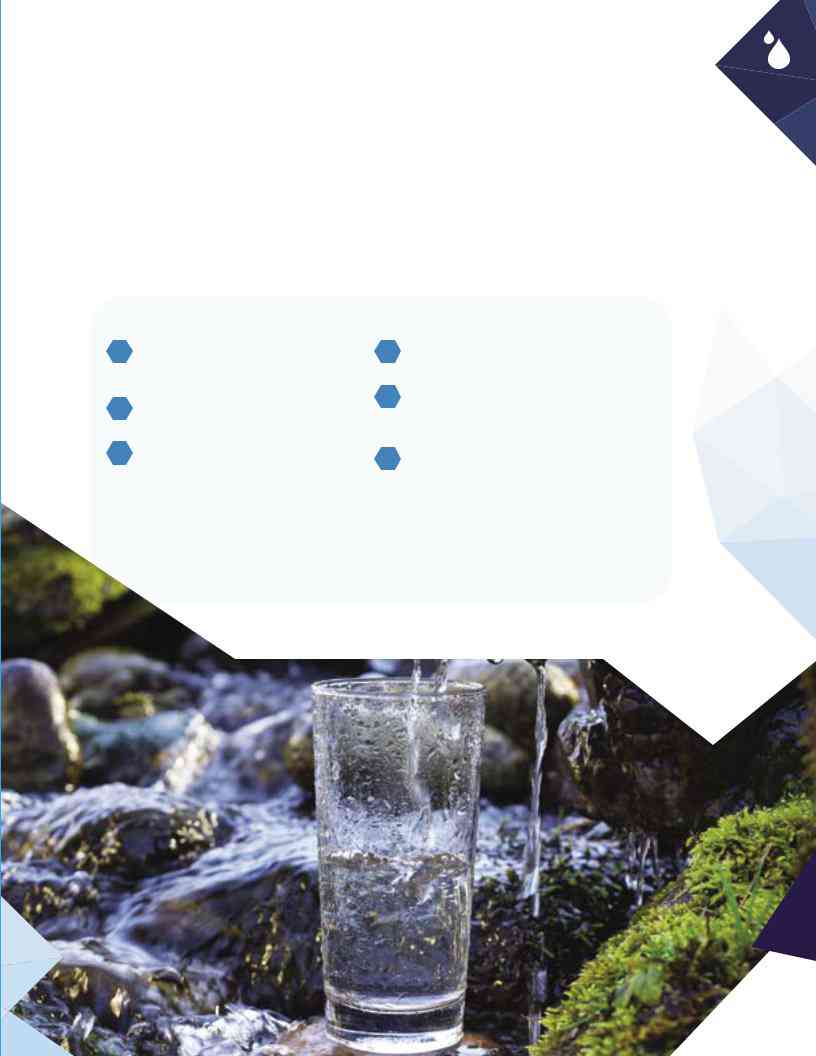
Trust the Tap
Good Tasting, Safe Drinking Water is as Close as Your Kitchen Faucet
If you could choose to drink something that tastes great, is good for your health, easy to access,
Santa Ana‘s drinking water is stringently treated and tested. It not only consistently meets and exceeds all federal and state drinking water standards; it also enjoys
a long history of winning competitive industry awards.
Beginning in 2011, we have captured multiple coveted honors – including bronze, silver and gold – in the annual Berkeley Springs International Water Tasting competition, which is dedicated to preserving and protecting drinking water. The awards are given to agencies demonstrating the
Reasons Why Tap vs Bottled Wins!
Is bottled water cheaper than tap? Definitely not! Bottled water costs about 80 cents per gallon. Santa Ana tap is half a cent per gallon.
Is bottled water better for the environment? No. Bottled water produces up to 1.5 million tons of plastic waste per year. According to Food and Water Watch, that plastic requires up to 47 million gallons of oil per year to produce.
container when on the go.
Is bottled water safer? No. As a highly regulated public agency, Santa Ana must meet higher standards, including strict California regulations, than producers of bottled water.
What About
No matter how, when and where you enjoy a refreshing drink of Santa Ana water, we want you to know you can always …
TRUST THE TAP!
23
2020 | WATER QUALITY
REPORT
Keeping Funds
Flowing
Securing State and Federal
Grants Keeps Projects and
Water on Course
Just as the water that reaches Santa Ana faucets comes from miles away, ensuring its uninterrupted daily flow begins years in advance!
Not only are designing and engineering new Santa Ana Water infrastructure projects and rehabilitation programs years in the making, procuring the funding to construct, operate and maintain them requires advance planning too.
A few years ago the decision was made to ease the cost burden of having infrastructure enhancement coming solely from Santa Ana’s municipal budget, and seek support from State and Federal programs. We began by researching the funding programs available through California and U.S. agencies. Then, with the help of
how these projects were an essential investment in the
and safety of Santa Ana residents.
To date more than $6.5 million in direct support for water delivery systems and sustainability projects has been awarded to Santa Ana’s Public Works Agency. These State and Federal funds leave more of Santa Ana’s precious community assets available for other services and infrastructure needs.
Read the accompanying article for more information about these projects on page 25.
“The more successful we are at procuring this support from beyond our city limits,” said Water Resources Manager Cesar Barrera, “the better we’re able to keep water rates down within Santa Ana. It’s allowed us to keep the commitment we adopted with our last rate structuring. We pledged to prioritize
Below is an overview of current projects, and the sources and amounts of the funding received for them.
Current Water Projects and their Funding
- The AMI Project has received $4 million from the California Department of Natural Resources, and $1.5 million from the Federal Bureau of Reclamation.
-
Another Federal Bureau of Reclamation grant, in the amount of $750,000, went to the Well 32
Rehabilitation Project. - The Washington Well Project received $100,000 for engineering from Santa Ana Watershed Project Authority and $750,000 from the Federal Bureau of Reclamation for its construction.
-
And, the
SA-1 Federal Bureau of Reclamation is providing $300,000 to support Hydroelectric
Improvements.
24
2020 | WATER QUALITY
REPORT
Infrastructure
CIP: Securing Our Future Today
The Capital Improvement Program generates projects to meet water delivery demand for generations
to come.
25
2020 | WATER QUALITY
REPORT
The
-
Santa Ana’s 27.2
square-mile service area means anticipating new challenges, new technologies, and the changing needs of a growing residential and business community.
The Capital Improvement Program, or CIP, is where the pivotal projects required to meet these challenges are imagined, incubated and initiated. This evolving slate of
Three major CIP projects are currently in the works, with several more on line to begin within the next 18 months. Together they will add resilience to our water supply and wastewater treatment facilities while keeping the City’s infrastructure operating efficiently and increasing our capacity to meet future demand.
In the process, we will construct new wells and maintain our 21 groundwater wells, seven import water connections, seven pump stations, ten reservoirs and 480 miles of transmission and distribution pipelines.
See related story on funding sources for CIP projects on page 24.
Projects in the Works
Automated Meter
Infrastructure (AMI)
Phase One of the
the software before shifting to extensive installation in August on the way to a
The communications system already has four new antenna towers built, one on City Hall and three more at the West, East and South Water Pump Stations.
Transitioning to smart meters that communicate via radio or similar technology will allow us to provide ongoing technological upgrades as they are developed. These include automated meter reads, leak detection and usage notifications as well as interactive customer portals.
Accurately tracking water consumption is the key to efficient management and planning. In the long term, it will mean that we will have access to more granular information to better gauge the community’s water needs. Residents, too, will have their consumption data at their finger tips for more informed decisions about their own water usage.
Studies show that communities that upgraded to AMI systems reduce water usage by as much as 15 percent.
San Lorenzo Sewer Lift Station
Construction is underway on the San Lorenzo Sewer Lift Station. Already built are the large concrete underground tanks where wastewater will be held before it is pumped out and transferred via the Orange County Sanitation District’s Santa Ana Trunk sewer pipeline to the OCSD Treatment Plant. We are now adding the supporting pipelines and mechanicals.
Project completion is slated for the end of 2021 or beginning of 2022.
Ongoing Infrastructure Replacement
Among our CIP projects are those directed at fulfilling items included within the Santa Ana Water District’s Master Plan. One example is the ongoing replacement of aging pipeline. Each year, we replace 5 miles of underground pipeline, oftentimes in conjunction with street improvements to minimize disruptions to residents
and commuters while reducing overall construction costs.
Projects Coming in 2022
Two projects on tap to begin in 2022 are related to Per- and
PFAS Treatment Projects
The City of Santa Ana Public Works Agency constantly monitors its well system for traces of PFAS. Testing conducted in early 2021 revealed a detection of PFAS in Wells 27, 28, 31, 38 and 40. A decision was made to take all five wells immediately
PFAS levels in four of these wells exceeded a threshold set in our standing agreement with Orange County Water District (OCWD). As a result, the OCWD will fund whatever treatment or other remediation is required to bring those levels into the permitted range at these wells.
However, since the City of Santa Ana strives to provide water to our residents that is free of PFAS, even wells that do not meet the threshold for OCWD funding will be treated. Well 38 is one example. We placed it off line while we determine how much funding will be required for treatment and to get it operating again.
Fortunately, Santa Ana has created a “redundant” water system that can generate more than enough groundwater, so shutting down these wells has not impacted production. Also supporting our ability to meet the Santa Ana’s water needs is the community’s conservation efforts, which have reduced Santa Ana’s water consumption over the past
We hope to bring these wells back on line to meet the needs of our community, particularly in the Northeast Zone above Interstate 5, where all wells are offline and water is being solely supplied from imported sources from the Metropolitan Water District (MWD).
Water Well Rehab and
Blending Project
The Morrison Park well, number 32, has now been offline for about a decade after testing showed unacceptable nitrate levels. An upcoming CIP project, Water Well Rehab And Blending, will breath life back into well 32.
As you might expect, it is more
15 million gallons of water in its tanks. At the Garthe Station, well 32 water will be treated through a blending treatment approach.
26
2020 | WATER QUALITY
REPORT
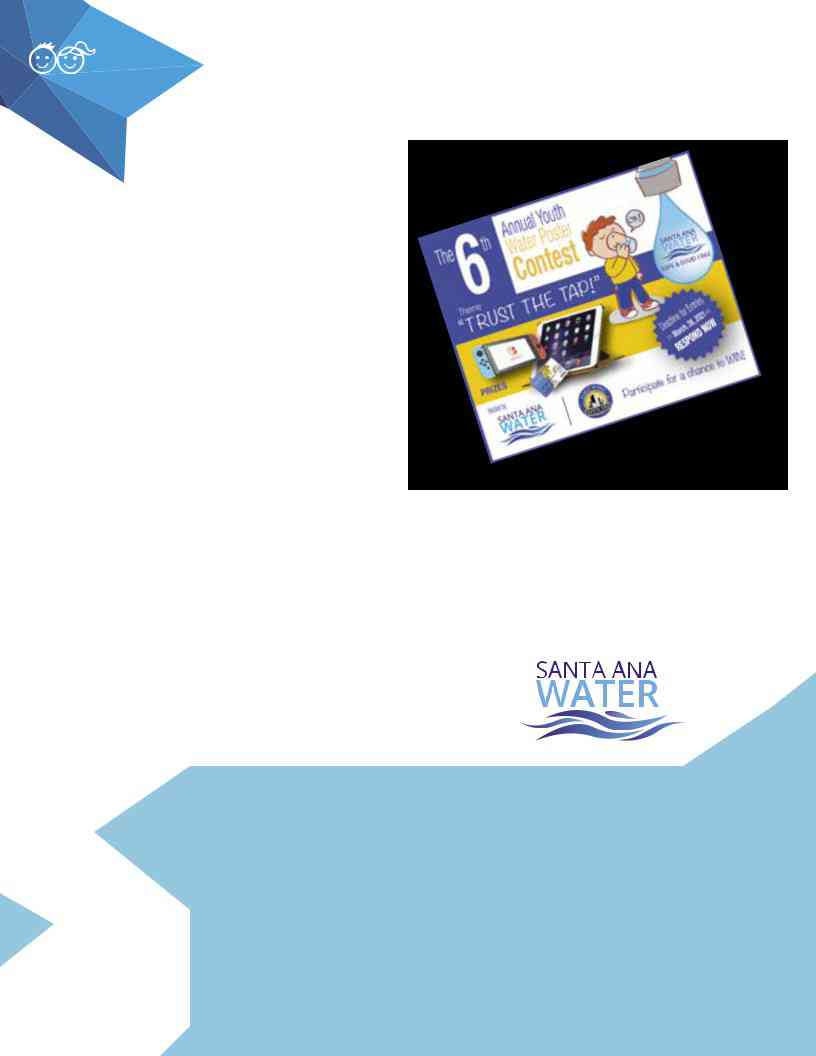
“The contest offers parents and their children the opportunity to explore various
27
2020 | WATER QUALITY
REPORT
Santa Ana Students Illustrate How Their Tap Water is Safeguarded by The City
The City Announces 2021 Youth
Water Poster Contest Winners
The City of Santa Ana recently concluded its 2021 Youth Water Poster Contest and announced the 11 winning posters.
The contest is held
While there were fewer entries this time due to the pandemic, we are proud of all those who participated and their outstanding work!
A big “thank you” to our judges Robyn MacNair, Arts & Culture Commissioner, Ward 4, and Frank Gutierrez, Arts & Culture Commissioner, Ward 6, for volunteering their time to evaluate all the poster entries and choose the winners. We also would like to thank Tram Le, our Arts & Culture Specialist for the City of Santa Ana, for organizing the judging of this Poster Contest and the ones in prior years. Judges used four scoring criteria: level of originality, visual and word clarity, and adherence to this year’s theme “Trust The Tap!,” illustrating how their tap water is protected from
All participants received a certificate and a gift card for participating this year! Winners were awarded prizes ranging from a Nintendo Switch to iPads.
We extend a special congratulations to the following grand prize winners
and finalists.
2021 WINNERS
Ages |
Ages |
Mateo Mascarenas, Grand prize winner |
Deziree Huerta, Grand prize winner |
Mario Herta, Finalist |
Yojana Hernandez, Finalist |
Elyssa Anyelie Flores, Finalist |
Martin Aguilar, Finalist |
Ages |
Ages |
Sophia Tran, Grand prize winner |
Teresa Isabel Gutierrez, Grand prize winner |
Evan Velazquez Moreno, Finalist |
Elizabeth Llamas, Finalist |
Andrea Gonzalez, Finalist |
|
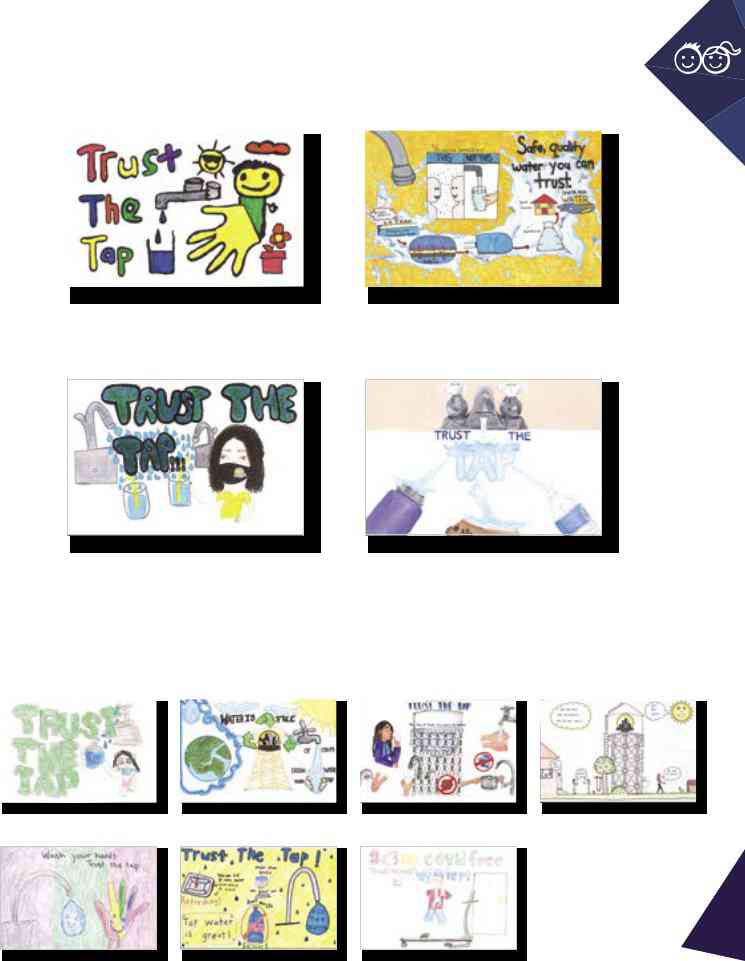
Grand Prize Winners 2021
Ages |
|
Ages |
|
|
|
|
|
|
Mateo Mascarenas
Ages 13-14
Sophia Tran
Ages 15-18
Deziree Huerta |
Teresa Isabel Gutierrez |
Finalists 2021
Ages |
|
Ages |
|
Ages |
|
Ages |
|
|
|
|
|
|
|
|
|
|
|
|
|
|
Mario Herta |
Evan Velazquez |
Yojana Hernandez |
Elizabeth Llamas |
28
Elyssa Anyelie |
Andrea Gonzalez |
Martin Aguilar |
2020 | WATER QUALITY
REPORT
The Facts About COVID
& Your Drinking Water
FACT:
on the quality or safety of your drinking water.
-
According to the Centers for Disease Control and Prevention (CDC),
COVID-19 is spread person to person, not through water. To date, the novel coronavirus has not been found in drinking water supplies and has no impact on the quality and safety of tap water. - It is safe to use and drink tap water as usual.
29
2020 | WATER QUALITY
REPORT
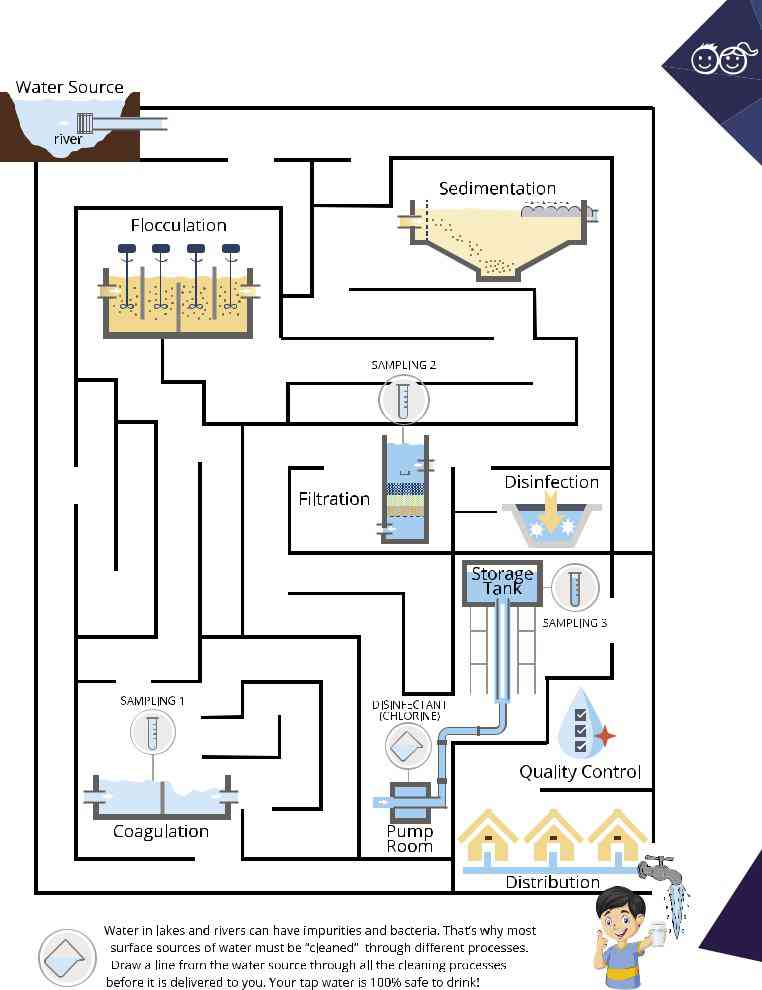
Water Treatment Maze
30
2020 | WATER QUALITY
REPORT
Look out for updates on this program later this year. We look forward to helping Santa Ana residents create a bright green future for themselves, our community and Planet Earth!
One of four design samples prepared by a landscape architect for the Landscape Transformation Program.
31
2020 | WATER QUALITY
REPORT
Planned for Next Year:
City-Sponsored
Residential
Landscape
Transformation
Program
Santa Ana is working on securing a
The ongoing California drought makes this program more important than ever. Here are a few details.
-
If funding is received, the
two-year project kicks off in February 2022. -
The program is offered to DAC residents to offset high
up-front costs homeowners typically pay to remove existing turf, create a landscape design and install native plants with awater-wise irrigation system. - It will improve the City’s water efficiency, increase climate resilience, decrease residents’ water bills and increase property values.
-
It also will provide green jobs to
at-risk youth, who will be hired to help create the new sustainable landscapes in their neighborhoods. -
Homeowners who live outside of DACs can continue taking advantage of the City’s ongoing
water-smart landscape program with the use of rebates offered through the Metropolitan Water District (MWD).
Awards - CWEA Honors Santa Ana!
Ask any of the California Water Environment Association’s 10,000 wastewater professionals to name their “favorite annual industry award” and you’re sure to hear about CWEA’s own annual award ceremony.
For so many essential workers in our field, the honors CWEA hands out each year are welcome recognition for excellence across the state’s wastewater systems.
But there are also awards presented within the many sections that make up CWEA.
CWEA is made up of 17 sections divided between the Northern and Southern Regions. The City of Santa Ana’s water resources division is part of the Santa Ana River Basin Section, or SARBS, one of seven sections here in the Southern Region.
SARBS has its own awards and in 2019 our Santa Ana team entered the competition for the first time. Last June, when the winners were announced, we were honored as “Best Medium Size Sewer Collection System.”
The awards are as serious as the work they honor. A panel of expert judges bases its decision on how each system complies with the many regulations governing environmental safeguards, safety, and the quality of staff training (both basic knowledge and ability to use the various tools required for their work).
They look at our fleet vehicles and other equipment, checking to see how well we use modern technology to deliver our services. They also look at our management team to evaluate our financial management as well as how we operate our sewer system.
We thank the SARBS judges for the honor. The plaque we received proudly hangs in our offices, signifying that Santa Ana is a leading steward of our environment.
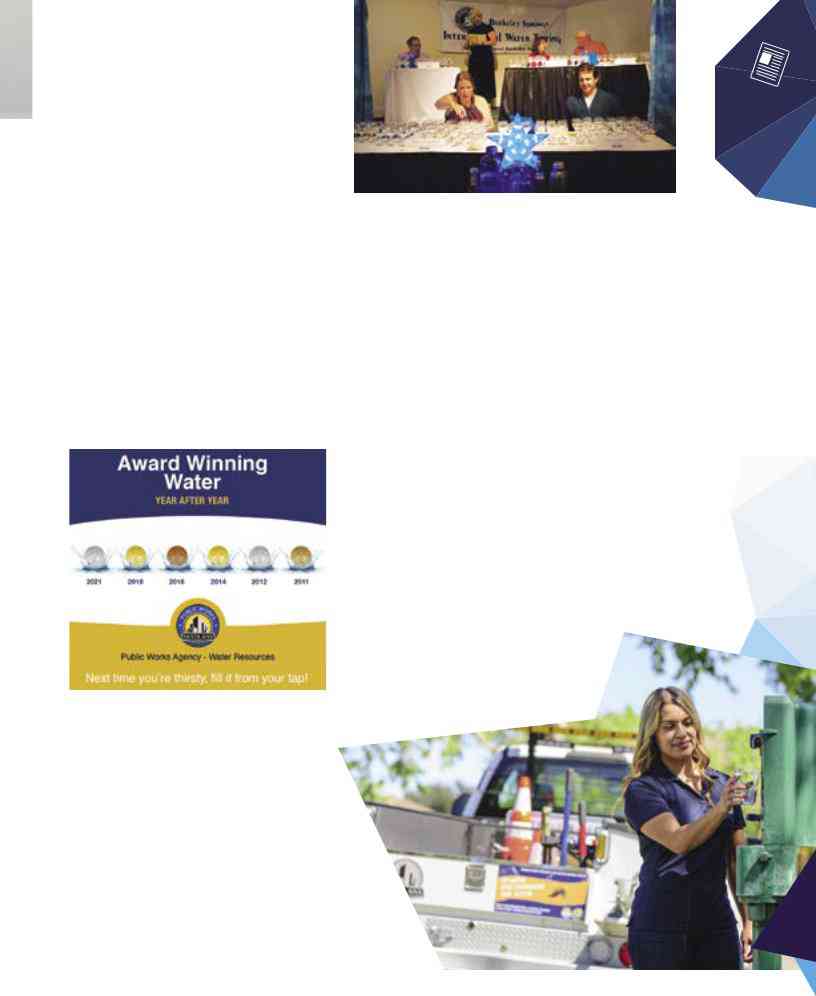
Santa Ana’s Tap:
Award Winning
Year After Year
Santa Ana recently won the coveted honor of producing some of the “Best Municipal Water in the
Judging at the 31st annual Berkeley Springs International Water Tasting (Photo credit: Van Smith)
Metropolitan Water District of Southern
Over the past 10 years of participating
in this competition, the City of Santa Ana has won six awards including the gold medal in 2018 and 2014 as well as the silver and bronze medals in 2012 and 2011, respectively.
This long history of awards reflects Santa Ana’s commitment to ensuring a healthy, reliable and safe drinking water supply for residents that exceeds the drinking water health standards requirement by both state and federal agencies.
“Winning one of the nation’s top awards in our category is phenomenal. Winning the award six times over the past ten years attests to the high standards we set for our tap water and the dedication of our certified specialists who are committed to serving our customers,” says Robert Hernandez, Water Services Quality Supervisor for the City of Santa Ana.
While some may take the quality of their drinking water for granted, Santa Ana does not. Behind the scenes, the Water Resources Division performs
Residents can take pride knowing that the nine judges at the Berkeley Springs International Water Tasting chose Santa Ana’s tap water after spending hours tasting and selecting from waters sourced in 19 states, three Canadian provinces and fourteen foreign countries. Similar to a wine tasting, they rated the water for each attribute including appearance (should be clear), aroma (should be none), taste (should taste clean), mouth feel (should feel light), and aftertaste (should leave people thirsty for more).
“The consistency in winners from year to year with different panels of judges validates the choices,” remarked Berkeley Springs’ water master, Arthur von Wiesenberger. “It also speaks to the impressively high caliber of the waters entered.”
The next time you think about drinking bottled water, we invite you to turn on the tap, fill your glass and enjoy our award winning water!
32
2020 | WATER QUALITY
REPORT

We’re Here To Serve You!
Building Inspection Request Line
City Manager
Fire Department
(call 911 for emergencies)
Mayor and City Council
Parks & Recreation
Planning & Building, Planning Division
(Environmental Review, Historic
Preservation & New Development)
Police Department
(call 911 for emergencies)
Public Library
Public Works Emergency Repairs (after hours)
Public Works Information
Maintenance Services
Curb & Sidewalks
Graffiti Removal
Graffiti Task Force
33
Water Resources
Sewer/Storm Drain Maintenance
Water Administration
Water & Sewer Permits
Water Customer Service and Billing
Water Engineering
Water Maintenance & Construction
Water Production
Water Quality & Conservation
Water Service & Main Location
Traffic and Transportation
Signal Repairs - 8
Signal Repairs - Police Department (Evenings/Weekends)
Street Work Permits
Traffic Operations
2020 | WATER QUALITY
REPORT
Refuse Collection
New Trash Cart/Order Dumpster
Recycle Used Car Oil & Filter
Public Works
General Maintenance and Repairs
Sanitation
Shopping Cart Removal
Street Lights
Street Sweeping
Trees
Weed Abatement
Other Helpful Numbers
Bus Information
Noise Complaints
Overcrowding
Poison Center
34
2020 | WATER QUALITY
REPORT
You can request a copy of the most recent summary of the Watershed Sanitary Surveys and the Source Water Assessment by calling MWD at
For a copy of the complete assessments for Santa Ana’s distribution system and groundwater, call the Santa Ana Water Resources Division at
City of Santa Ana, Water Resources Division
Cesar E. Barrera P.E., Deputy Public Works Director/Water Resources Manager Rudy Rosas P.E., Principal Civil Engineer
Robert Hernandez, Water Services Quality Supervisor
220 South Daisy Avenue, Bldg A Santa Ana, California 92703
phone:
web: www.santaanaccr.org
Get Involved
If you would like to be involved in issues and decisions that affect the quality and cost of your drinking water, City Council meetings are open to the public and held at 5:45 p.m. on the first and third Tuesday of each month. The meeting location is at City Council Chambers, 22 Civic Center Plaza Santa Ana, CA 92701.
For more information, contact: Santa Ana City Council
20 Civic Center Plaza P.O. Box 1988, M31 Santa Ana, CA 92702
phone:
Follow Us
www.facebook.com/CityofSantaAna/
www.instagram.com/cityofsantaana/
www.santaanaccr.org
Este informe contiene información importante sobre su agua potable. Favor de comunicarse con la División de Recursos Hídricos de la ciudad de Santa Ana al
Báo cáo này chứa thông tin quan trọng về nước uống. Vui lòng liên hệ với Thành phố Santa Ana, Phòng Tài nguyên Nước theo số
Contaminants
City of Santa Ana
EWG's drinking water quality report shows results of tests conducted by the water utility and provided to the Environmental Working Group by the California State Water Resources Control Board, as well as information from the U.S. EPA Enforcement and Compliance History database (ECHO). For the latest quarter assessed by the U.S. EPA (January 2019 - March 2019), tap water provided by this water utility was in compliance with federal health-based drinking water standards.
Utility details
- Serves: 329815
- Data available: 2012-2017
- Data Source: Purchased surface water
- Total: 25
Contaminants That Exceed Guidelines
- Arsenic
- Bromodichloromethane
- Bromoform
- Chloroform
- Chromium (hexavalent)
- Dibromochloromethane
- Dichloroacetic acid
- Nitrate
- Nitrate and nitrite
- Total trihalomethanes (TTHMs)
- Trichloroacetic acid
- Uranium
Other Detected Contaminants
- 1%2C1-Dichloroethylene
- 1%2C4-Dioxane
- Barium
- Bromide
- Chlorate
- Dibromoacetic acid
- Fluoride
- Haloacetic acids (HAA5)
- Molybdenum
- Monochloroacetic acid
- Perchlorate
- Strontium
- Vanadium
Reminder
Always take extra precautions, the water may be safe to drink when it leaves the sewage treatment plant but it may pick up pollutants during its way to your tap. We advise that you ask locals or hotel staff about the water quality. Also, note that different cities have different water mineral contents.
Sources and Resources
Sources Cited
Additional Resources
Santa Ana Tap Water
Santa Ana CA is one of the most beautiful places in California. The weather is amazing, the beaches are gorgeous and Santa Ana has more local shops than most cities in California put together. Yet, one of the scariest things you have to deal with while visiting Santa Ana is the contamination of your tap water. Since most of the population here consumes water from the tap in a glass or pitcher, the city’s tap water has been rated No. 3 in the world in a taste
The reason for this is primarily due to the large population of people in a small area. Each one of these people needs to use the same faucet in order to get their water. So all of their water is contaminated. The contamination of tap water is so bad that even if you buy the most expensive bottled water you will still have to pay for the bottles. The best thing that you can do if you wish to drink tap water safe drink is to install a home water purifier device. These units are great because they can remove almost all types of contaminants from your water.
They use ultraviolet light to kill bacteria, then they use a carbon filter to remove chlorine. Then they put a micron filter in so that your water is purified again. Drinking water safe to drink in Santa Ana is just a few steps away from being a reality. There is a water filtration system in the works in Santa Ana, and a lot of companies are trying to get into this market. If you want to go down this road today, it might be worth your while to check out some of the available options. You might be surprised at just what you find out.
Santa Ana Water Quality
Santa Ana is one of the most beautiful places to visit. It has such a warm and inviting feel to it. The beaches are always clear blue, and there’s no shortage of things to do. Many tourists come here to swim, relax on the beach or just to hang out by the pool. Unfortunately, Santa Ana is at risk from two major pollutants: chlorine and volatile organic chemicals (VOCs).
Chloramine is one of the most common substances found in groundwater throughout the country. This compound is often used as an additive to disinfect water, in order to kill bacteria and ensure that it is potable. While it kills harmful microorganisms, it also reacts with natural proteins found in living material, like rock, in order to form compounds called chloramines. These compounds can irritate the skin and possibly cause irritation, headaches, asthma attacks, and other health complications. They can also convert natural oxygen into carbon dioxide, which is a major contributor to the greenhouse effect.
VOCs are found in the vapor, steam, and mist produced by skimmers, water heaters, and hot tubs. While some people are comfortable with VOCs, others are not. The gases create an acidic vapor that turns normal water into an unsafe medium to live in, and they are particularly dangerous to young children who can get severely ill from exposure to it. Because of this, Santa Ana water quality is an issue that local agencies and water treatment companies work hard to improve.
Santa Ana, CA safe drinking water supply exceeds the drinking water health standards required by both state and federal standards.