Table of Contents
Can You Drink Tap Water in Westminster?
Yes, Westminster's tap water is generally considered safe to drink as Westminster has no active health based violations of the Safe Drinking Water Act (SDWA) that we are aware of. Other factors such as lead piping in a home, or low levels of pollutants on immunocompromised individuals, should also be considered, however. To find more recent info we might have, you can check out our boil water notice page or the city's water provider website.
According the EPA’s ECHO database, from April 30, 2019 to June 30, 2022, Westminster's water utility, City of Westminster, had 0 violations of the Safe Drinking Water Act. For more details on the violations, please see our violation history section below. The last violation for Westminster was resolved on Jan. 31, 2013. This assessment is based on the City of Westminster water system, other water systems in the city may have different results.
While tap water that meets the EPA health guidelines generally won’t make you sick to your stomach, it can still contain regulated and unregulated contaminants present in trace amounts that could potentially cause health issues over the long-run. These trace contaminants may also impact immunocompromised and vulnerable individuals.
The EPA is reviewing if it’s current regulations around pollutant levels in tap water are strict enough, and the health dangers posed by unregulated pollutants, like PFAS.
Water Quality Report for Westminster Tap Water
The most recent publicly available numbers for measured contaminant levels in Westminster tap water are in its 2020 Water Quality Report. As you can see, there are levels which the EPA considers to be acceptable, but being below the maximum allowable level doesn’t necessarily mean the water is healthy.
Lead in tap water, for example, is currently allowed at up to 15ppb by the EPA, but it has set the ideal goal for lead at zero. This highlights how meeting EPA standards doesn’t necessarily mean local tap water is healthy.
EPA regulations continue to change as it evaluates the long term impacts of chemicals and updates drinking water acceptable levels. The rules around arsenic, as well as, lead and copper are currently being re-evaluated.
There are also a number of "emerging" contaminants that are not currently. For example, PFAS (Per- and polyfluoroalkyl substances), for which the EPA has issued a health advisory. PFAS are called "forever chemicals" since they tend not to break down in the environment or the human body and can accumulate over time.
We recommend looking at the contaminants present in Westminster's water quality reports, or getting your home's tap water tested to see if you should be filtering your water.
Westminster Tap Water Safe Drinking Water Act Violation History - Prior 10 Years
Below is a ten year history of violations for the water system named City of Westminster for Westminster in California. For more details please see the "What do these Violations Mean?" section below.
From Jan. 1, 2013 to Jan. 31, 2013, Westminster had 1 non-health based Safe Drinking Water Act violation with the violation category being Monitoring and Reporting, more specifically, the violation code was Monitoring, Routine Minor (TCR) which falls into the Microbials rule code group, and the Total Coliform Rules rule code family for the following contaminant code: Coliform (TCR).
Is there Lead in Westminster Water?
Based on the EPA’s ECHO Database, 90% of the samples taken from the Westminster water system, City of Westminster, between sample start date and sample end date, were at or below, 0.00141 mg/L of lead in Westminster water. This is 9.4% of the 0.015 mg/L action level. This means 10% of the samples taken from Westminster contained more lead.
While Westminster water testing may have found 0.00141 mg/L of lead in its water, that does not mean your water source has the same amount. The amount of lead in water in a city can vary greatly from neighborhood to neighborhood, or even building to building. Many buildings, particularly older ones, have lead pipes or service lines which can be a source of contamination. To find out if your home has lead, we recommend getting you water tested.
No amount of lead in water is healthy, only less dangerous. As lead accumulates in our bodies over time, even exposure to relatively small amounts can have negative health effects. For more information, please check out our Lead FAQ page.
Are there PFAS in Westminster Tap Water?
Currently, testing tap water for PFAS isn’t mandated on a national level. We do have a list of military bases where there have been suspected or confirmed leaks. There appears to be at least one military base - Joint Forces Training Base - near Westminster with suspected leaks.
With many potential sources of PFAS in tap water across the US, the best information we currently have about which cities have PFAS in their water is this ewg map, which you can check to see if Westminster has been evaluated for yet.
Our stance is better safe than sorry, and that it makes sense to try to purify the tap water just in case.
Westminster SDWA Violation History Table - Prior 10 Years
| Compliance Period | Status | Health-Based? | Category Code | Code | Rule Code | Contaminant Code | Rule Group Code | Rule Family Code |
|---|---|---|---|---|---|---|---|---|
| 01/01/2013 - 01/31/2013 | Resolved | No | Monitoring and Reporting (MR) | Monitoring, Routine Minor (TCR) (24) | Total Coliform Rule (110) | Coliform (TCR) (3100) | Microbials (100) | Total Coliform Rules (110) |
What do these Violations Mean?
Safe Drinking Water Act Violations categories split into two groups, health based, and non-health based. Generally, health based violations are more serious, though non-health based violations can also be cause for concern.
Health Based Violations
- Maximum contaminant levels (MCLs) - maximum allowed contaminant level was exceeded.
- Maximum residual disinfectant levels (MRDLs) - maximum allowed disinfectant level was exceeded.
- Other violations (Other) - the exact required process to reduce the amounts of contaminants in drinking water was not followed.
Non-Health Based Violations
- Monitoring and reporting violations (MR, MON) - failure to conduct the required regular monitoring of drinking water quality, and/or to submit monitoring results on time.
- Public notice violations (Other) - failure to immediately alert consumers if there is a serious problem with their drinking water that may pose a risk to public health.
- Other violations (Other) - miscellaneous violations, such as failure to issue annual consumer confidence reports or maintain required records.
SDWA Table Key
| Field | Description |
|---|---|
| Compliance Period | Dates of the compliance period. |
| Status |
Current status of the violation.
|
| Health-Based? | Whether the violation is health based. |
| Category Code |
The category of violation that is reported.
|
| Code | A full description of violation codes can be accessed in the SDWA_REF_CODE_VALUES (CSV) table. |
| Contaminant Code | A code value that represents a contaminant for which a public water system has incurred a violation of a primary drinking water regulation. |
| Rule Code |
Code for a National Drinking Water rule.
|
| Rule Group Code |
Code that uniquely identifies a rule group.
|
| Rule Family Code |
Code for rule family.
|
For more clarification please visit the EPA's data dictionary.
Westminster Water - Frequently Asked Questions
| By Phone: | 714-548-3693 |
| By Email: | smiller@westminster-ca.gov |
| By Mail: | 14381 OLIVE STREET WESTMINSTER, CA, 92683 |
Existing customers can login to their City of Westminster account to pay their Westminster water bill by clicking here.
If you want to pay your City of Westminster bill online and haven't made an account yet, you can create an account online. Please click here to create your account to pay your Westminster water bill.
If you don't want to make an account, or can't remember your account, you can make a one-time payment towards your Westminster water bill without creating an account using a one time payment portal with your account number and credit or debit card. Click here to make a one time payment.
Moving to a new house or apartment in Westminster means you will often need to put the water in your name with City of Westminster. In order to put the water in your name, please click the link to the start service form below. Start service requests for water bills typically take two business days.
Leaving your house or apartment in Westminster means you will likely need to take your name off of the water bill with City of Westminster. In order to take your name off the water bill, please click the link to the stop service form below. Stop service for water bills requests typically take two business days.
USER SUBMITTED RATINGS
- Drinking Water Pollution and Inaccessibility
- Water Pollution
- Drinking Water Quality and Accessibility
- Water Quality
The above data is comprised of subjective, user submitted opinions about the water quality and pollution in Westminster, measured on a scale from 0% (lowest) to 100% (highest).
Related FAQS
Westminster Water Quality Report (Consumer Confidence Report)
The EPA mandates that towns and cities consistently monitor and test their tap water. They must report their findings in an annual Consumer Confidence Report. Below is the most recent water quality report from Westminster's Water. If you would like to see the original version of the report, please click here.
Westminster Well 4 ~ Gillespie Park
The Variable Frequency Drive pump (VFD) that powers Well 4 automatically adjusts the electrical power frequency to modulate the pressure and flow to match demand. When installed in 2010, Southern California Edison offered a financial incentive for the conversion, as VFD uses less electricity to run. And coupled with a new, more efficient pump design, it helped cut operational costs by 20%, which was passed on to the City’s consumers. This helped keep our water costs in the lowest 1/3 compared to the rest of Orange County.
CITY OF
WESTMINSTER
WATER DIVISION
2021
Water Quality
Report
Our Water Quality Meets
State & Federal Standards
As you read this report, you will find laboratory test results show that the City of Westminster’s water system once again meets all the water quality standards put forth by the U.S. Environmental Protection Agency and the State Water Resources Control Board, Division of Drinking Water.
Your drinking water was tested more than 64,000 times last year for regulated and
The
Colorado
River
Your 2021 Water Quality Report
Since 1990, California public water utilities have been providing an annual Water
Quality Report to their customers. This year’s report covers all drinking water
quality testing performed in calendar year 2020.
The City of Westminster Water Division vigilantly safeguards its water supply and, as in years past, the water delivered to your home meets the quality standards required by federal and state regulatory agencies. The U.S. Environmental Protection Agency (USEPA) and the State Water Resources Control Board, Division of Drinking Water (SWRCB) are the agencies responsible for establishing and enforcing drinking water quality standards.
In some cases, the City goes beyond what is required by testing for unregulated constituents that may have known health risks but do not have drinking water standards. In addition, the Orange County Water District (OCWD), which manages
the groundwater basin, and the Metropolitan Water District of Southern California (MWDSC), which supplies imported treated surface water to the City, test for unregulated constituents in our water supply. Unregulated constituent monitoring helps USEPA and SWRCB determine where certain constituents occur and whether new standards need to be established for those constituents.
Through drinking water quality compliance testing programs carried out by OCWD for groundwater, MWDSC
for treated surface water, and the Westminster Water Division for the water production and distribution system,
|
|
|
your drinking water is constantly monitored |
|
|
|
|
||
Quality Water is Our Priority |
from source to tap for regulated and |
|||
unregulated constituents. |
||||
urn the tap and the water flows, as if by magic. |
|
|
||
|
|
The State allows Westminster to monitor |
||
|
|
|||
TOr so it seems. The reality is considerably |
|
|
||
|
|
for some contaminants less than once per |
||
different, however. Delivering |
|
|
year because the concentrations of these |
|
water to our customers is a scientific and |
|
|
||
|
|
|
||
engineering feat that requires considerable effort |
|
|
contaminants do not change frequently. |
|
and talent to ensure the water is always there, |
|
|
Some of our data, though representative, |
|
always safe to drink. |
|
|
are more than one year old. |
|
|
|
|||
Because tap water is highly regulated by state and federal laws, |
||||
|
||||
water treatment and distribution operators must be licensed and are |
This report contains important information |
|||
required to complete |
about your drinking water. Translate it, |
|||
before becoming a state certified operator. |
or speak with someone who understands it. |
|||
Our licensed water professionals have an understanding of a wide |
Este informe contiene información muy importante |
|||
range of subjects, including mathematics, biology, chemistry, physics, |
||||
sobre su agua potable. Para mas información ó traducción, |
||||
and engineering. Some of the tasks they complete on a regular basis |
||||
favor de contactar a Mr. Roberto Anaya. |
||||
include: |
Telefono: (714) |
|||
- Operating and maintaining equipment to purify and clarify water;
- Monitoring and inspecting machinery, meters, gauges, and operating conditions;
- Conducting tests and inspections on water and evaluating the results;
- Documenting and reporting test results and system operations to regulatory agencies; and
- Serving our community through customer support, education, and
outreach.
So, the next time you turn on your faucet, think of the skilled professionals who stand behind every drop.
~ 2 ~
Constant Monitoring Ensures Continued Excellence
Sources of Supply
The City of Westminster’s water supply is a blend of groundwater managed by the Orange County Water District (OCWD) and water imported from Northern California and the Colorado River. Imported
water is purchased from MWDSC by the Municipal Water District of Orange County (MWDOC), who distributes it to water agencies in Orange County. Groundwater comes from a natural under- ground aquifer that is replenished with water from the Santa Ana River, local rainfall, and imported water. The groundwater basin is 350 square miles and lies beneath north and central Orange County from Irvine to the Los Angeles border, and from Yorba Linda to the Pacific Ocean.
Westminster has 10 groundwater wells located throughout the City and three import water connections. On average, 75% of our drinking water is produced from our groundwater wells and 25% is imported.
Orange County’s Water Future
For years, Orange County has enjoyed an abundant, seemingly endless supply of
OCWD and MWDOC work cooperatively to evaluate new and innovative water management and supply development programs, including water reuse and recycling, wetlands expansion, recharge facility construction, ocean and brackish water desalination, surface storage and water use efficiency programs. These efforts are helping to enhance
Westminster would consider future participation in the Ocean Water Desalination Program if costs of program participation and costs of water supplied by the Program were comparable to that of groundwater or imported water. More information from OCWD and MWDOC would be needed to determine how Westminster could be incorporated into the regional water system used for the delivery of desalinated water.
Basic Information About Drinking Water Contaminants
The sources of drinking water (both tap water and bottled water) include rivers, lakes, streams, ponds, reservoirs, springs and wells. As water travels over the surface of land or through the layers of the ground it dissolves naturally occurring minerals
and, in some cases, radio- active material, and can pick up substances result- ing from the presence of animal and human activity.
Contaminants that may be present in source water include:
- Microbial contaminants, such as viruses and bacteria, may come from sewage treatment plants, septic systems, agricultural livestock operations and wildlife.
- Inorganic contaminants, such as salts and metals, can be naturally occurring or result from urban storm runoff, industrial or domestic wastewater discharges, oil and gas production, mining and farming.
- Radioactive contaminants can be naturally occurring or the result of oil and gas production or mining activities.
-
Organic chemical contaminants, including synthetic and volatile organic chemicals, are
by-products of industrial
processes and petroleum production, and can also come from gasoline stations, urban storm water runoff, agricultural application and septic systems.
- Pesticides and herbicides may come from a variety of sources such as agriculture, urban storm water runoff and residential uses.
In order to ensure that tap water is safe to drink, USEPA and the SWRCB prescribe regulations that limit the amount of certain contaminants in water provided by public water systems.
The U.S. Food and Drug Administration regulations and California law also establish limits for
contaminants in bottled water that must provide the same protection for public health. Drinking water, including bottled water, may reasonably be expected to contain at least small amounts of some contaminants. The presence of contaminants does not necessarily indicate that water poses a health risk.
More information about contaminants and potential health effects can be obtained by calling the USEPA’s Safe Drinking Water Hotline at (800)
~ 3 ~
To Safeguard Against Issues that May Affect Your Health
We Comply with All State & Federal Water Quality Regulations
Chloramines
The City of Westminster imports treated drinking water from MWDSC. Metropolitan treats its filtered surface water with chloramines, which are chemical disinfectants formed by combining chlorine with ammonia.
Chloramines are effective killers of microscopic organisms that may cause disease and chloramines also help prevent
People who use kidney dialysis machines may want to take special precautions and consult their physician for the appropriate type of water treatment.
Customers who maintain fish ponds, tanks or aquariums should also make necessary adjustments in water quality treatment as these chloramines are toxic to fish.
For further information or if you have any questions about chloramines, please call Paul Kalix at (714)
Immunocompromised People
Some people may be more vulnerable to contaminants in drinking water than the general population.
Immunocompromised people, such as those with cancer who are undergoing chemotherapy, persons who have had organ transplants, people with HIV/AIDS or other immune system disorders, some elderly persons, and infants can be particularly at risk to infection. These people should seek advice about drinking water from their health care providers.
USEPA/Centers for Disease Control (CDC) guidelines on appropriate means to lessen the risk of infection by Crypto- sporidium and other microbial
contaminants are available from the Safe Drinking Water Hotline
Total Coliform Rule
This Consumer Confidence Report (CCR) reflects changes in drinking water regulatory requirements instituted during 2016. All water systems are required to comply with the state Total Coliform Rule. Effective April 1, 2016, all water systems are also required to comply with the federal Revised Total Coliform Rule.
The federal rule protects public health by ensuring the integrity of the drinking water distribution system by monitoring for the presence of microbials (i.e., total coliform and E. coli bacteria). The USEPA anticipates greater public health protection as the rule requires water systems that are vulnerable to microbial contamination to identify and resolve
potential issues. Water systems that exceed a specified frequency of total coliform occurrences are required to conduct an assessment to determine if any sanitary defects exist. If found, these must be corrected by the water system.
About Lead in Tap Water
If present, elevated levels of lead can cause serious health problems, especially for pregnant women and young children. Lead
in drinking water is primarily from materials and components associated with service lines and home plumbing.
The City of Westminster Water Division is responsible for providing high quality drinking water, but cannot control the variety of materials used in plumbing components in your home.
When your water has been sitting for several hours, you can minimize the potential for lead exposure by flushing
your tap for 30 seconds to 2 minutes before using water for drinking or cooking.
If you are concerned about lead in your water, you may wish to have your water tested.
Information on lead in drinking water, testing methods, and steps you can take to minimize exposure is available from the Safe Drinking Water Hotline or at: www.epa.gov/safewater/lead.
Arsenic Advisory
While your drinking water meets the Federal and State standard for arsenic, it does contain low levels of arsenic. The arsenic standard balances the current understanding of arsenic’s possible health effects against the costs of removing arsenic from drinking water. The U.S. Environmental Protection Agency continues to research the health effects of low levels
of arsenic, which is a mineral known to cause cancer in humans at high concentrations and is linked to other health effects such as skin damage and circulatory problems.
~ 4 ~

2020 City of Westminster Drinking Water Quality
Local Groundwater and Metropolitan Water District (MWD) of Southern California Treated Surface Water
|
|
PHG |
Avg. Local |
Avg. MWD |
Range of |
MCL |
Typical Source |
||
Constituent |
MCL |
(MCLG) |
Groundwater |
Surface Water |
Detections |
Violation? |
in Drinking Water |
||
Radiologicals – Tested in 2020 |
|
|
|
|
|
|
|
|
|
Alpha Radiation (pCi/L) |
15 |
(0) |
<3 |
<3 |
ND – 3.94 |
No |
Erosion of Natural Deposits |
||
Beta Radiation (pCi/L) |
50 |
(0) |
NR |
<4 |
ND – 7 |
No |
Decay of Natural and |
|
|
Combined Radium (pCi/L) |
5 |
(0) |
<1 |
ND |
ND – 1.16 |
No |
Erosion of Natural Deposits |
|
|
Uranium (pCi/L) |
20 |
0.43 |
5.28 |
2 |
1 – 9.3 |
No |
Erosion of Natural Deposits |
|
|
Inorganic Chemicals – Tested in 2020 |
|
|
|
|
|
|
|
|
|
Aluminum (ppm) |
1 |
0.6 |
ND |
0.137 |
ND – 0.26 |
No |
Treatment Process Residue, Natural Deposits |
||
Arsenic (ppb) |
10 |
0.004 |
<2 |
ND |
ND – 5.6 |
No |
Runoff or Leaching from Natural Deposits |
|
|
Barium (ppm) |
1 |
2 |
<0.1 |
0.107 |
ND – 0.107 |
No |
Refinery Discharge, Erosion of Natural Deposits |
|
|
Bromate (ppb) |
10 |
0.1 |
NR |
1.9 |
ND – 1.3 |
No |
Byproduct of Drinking Water Ozonation |
|
|
Fluoride (ppm) |
2 |
1 |
0.49 |
NR |
0.39 |
– 0.56 |
No |
Runoff or Leaching from Natural Deposits |
|
Fluoride (ppm) |
2 |
1 |
NR |
0.7 |
0.5 |
– 0.9 |
No |
Water Additive for Dental Health |
|
Nitrate (ppm as N) |
10 |
10 |
1.63 |
ND |
ND – 4.65 |
No |
Agriculture Runoff and Sewage |
|
|
Nitrate+Nitrite (ppm as N) |
10 |
10 |
1.63 |
ND |
ND – 4.66 |
No |
Agriculture Runoff and Sewage |
|
|
Secondary Standards* – Tested in 2020 |
|
|
|
|
|
|
|
|
|
Aluminum (ppb) |
200* |
600 |
ND |
137 |
ND – 260 |
No |
Treatment Process Residue, Natural Deposits |
||
Chloride (ppm) |
500* |
n/a |
38.1 |
94 |
12.1 – 94 |
No |
Runoff or Leaching from Natural Deposits |
|
|
Color (color units) |
15* |
n/a |
ND |
1 |
ND – 1 |
No |
Runoff or Leaching from Natural Deposits |
|
|
Manganese (ppb) |
50* |
n/a |
<20 |
ND |
ND – 40.1 |
No |
Runoff or Leaching from Natural Deposits |
|
|
Odor (threshold odor number) |
3* |
n/a |
ND |
2 |
ND – 2 |
No |
|
||
Specific Conductance (µmho/cm) |
1,600* |
n/a |
617 |
970 |
408 |
– 975 |
No |
Substances that Form Ions in Water |
|
Sulfate (ppm) |
500* |
n/a |
78.3 |
216 |
35.4 – 217 |
No |
Runoff or Leaching from Natural Deposits |
|
|
Total Dissolved Solids (ppm) |
1,000* |
n/a |
376 |
592 |
248 |
– 603 |
No |
Runoff or Leaching from Natural Deposits |
|
Turbidity (NTU) |
5* |
n/a |
<0.1 |
ND |
ND – 0.2 |
No |
Soil Runoff |
|
|
Unregulated Constituents – Tested in 2018 and 2020 |
|
|
|
|
|
|
|
||
Alkalinity, total (ppm as CaCO3) |
Not Regulated |
n/a |
174 |
118 |
117 |
– 211 |
n/a |
Runoff or Leaching from Natural Deposits |
|
Boron (ppm) |
Not Regulated |
n/a |
ND |
0.13 |
ND – 0.13 |
n/a |
Runoff or Leaching from Natural Deposits |
|
|
Bromide (ppm) |
Not Regulated |
n/a |
0.12 |
NR |
0.035 |
– 0.341 |
n/a |
Refinery Discharge |
|
Calcium (ppm) |
Not Regulated |
n/a |
74.8 |
66 |
40.7 – 124 |
n/a |
Runoff or Leaching from Natural Deposits |
|
|
Germanium (ppb) |
Not Regulated |
n/a |
ND |
0.1 |
ND – 0.4 |
n/a |
Erosion of Natural Deposits; Industrial Discharge |
|
|
Hardness, total (ppm as CaCO3) |
Not Regulated |
n/a |
239 |
265 |
133 |
– 396 |
n/a |
Runoff or Leaching from Natural Deposits |
|
Magnesium (ppm) |
Not Regulated |
n/a |
12.7 |
26 |
7.7 – 26 |
n/a |
Runoff or Leaching from Natural Deposits |
|
|
Manganese (ppb)** |
50* |
n/a |
ND |
1.7 |
ND – 2.5 |
n/a |
Runoff or Leaching from Natural Deposits |
|
|
NL = 10 |
n/a |
NR |
3.1 |
3.1 |
n/a |
Byproduct of Drinking Water Chloramination, |
|
||
|
|
|
|
|
|
|
|
Industrial Processes |
|
pH (pH units) |
Not Regulated |
n/a |
7.9 |
8.1 |
7.8 |
– 8.1 |
n/a |
Hydrogen Ion Concentration |
|
Potassium (ppm) |
Not Regulated |
n/a |
3.1 |
4.6 |
2.1 |
– 4.7 |
n/a |
Runoff or Leaching from Natural Deposits |
|
Sodium (ppm) |
Not Regulated |
n/a |
37.4 |
96 |
32.5 – 98 |
n/a |
Runoff or Leaching from Natural Deposits |
|
|
TOC (ppm) – Surface water |
TT |
n/a |
NR |
2.4 |
2.2 |
– 2.7 |
n/a |
Various Natural and |
|
TOC (Unfiltered) (ppm) – Groundwater*** |
Not Regulated |
n/a |
0.18 |
NR |
0.07 |
– 0.31 |
n/a |
Various Natural and |
|
ppb =
- = average is less than the detection limit for reporting purposes; MCL = Maximum Contaminant Level; (MCLG) = federal MCL Goal; PHG = California Public Health Goal; ND = not detected;
NL = Notification Level; TOC = Total Organic Carbon; TT = treatment technique; NR = Not Required to be analyzed; |
*Constituent is regulated by a secondary standard. |
|
**Manganese was included as part of the unregulated constituents requiring monitoring. |
***TOC (Unfiltered) was included as part of the unregulated constituents requiring monitoring. |
|
Turbidity – combined filter effluent |
Treatment |
Turbidity |
TT |
Typical Source |
|
|
Metropolitan Water District Diemer Filtration Plant |
Technique |
Measurements |
Violation? |
in Drinking Water |
||
1) |
Highest single turbidity measurement |
0.3 NTU |
0.04 |
No |
Soil Runoff |
|
2) |
Percentage of samples less than 0.3 NTU |
95% |
100% |
No |
Soil Runoff |
|
Turbidity is a measure of the cloudiness of the water, an indication of particulate matter, some of which might include harmful microorganisms. |
NTU = nephelometric turbidity units |
|||||
Low turbidity in the treated water is a good indicator of effective filtration. Filtration is called a ”treatment technique” (TT).
A treatment technique is a required process intended to reduce the level of chemicals in drinking water that are difficult and sometimes impossible to measure directly.
Chart Legend
What are Water Quality Standards?
Drinking water standards established by USEPA and SWRCB set limits for substances that may affect consumer health or aesthetic qualities of drinking water. The charts in this report show the following types of water quality standards:
- Maximum Contaminant Level (MCL): The highest level of a contaminant that is allowed in drinking water. Primary MCLs are set as close to the PHGs (or MCLGs) as is economically and technologically feasible.
- Maximum Residual Disinfectant Level (MRDL): The highest level of a disinfectant allowed in drinking water. There is convincing evidence that addition of a disinfectant is necessary for control of microbial contaminants.
- Secondary MCLs are set to protect the odor, taste, and appearance of drinking water.
- Primary Drinking Water Standard: MCLs for contaminants that affect health along with their monitoring and reporting requirements and water treatment requirements.
- Regulatory Action Level (AL): The concentration of a contaminant which, if exceeded, triggers treatment or other requirements that a water system must follow.
What is a Water Quality Goal?
In addition to mandatory water quality standards, USEPA and SWRCB have set voluntary water quality goals for some contaminants. Water quality goals are often set at such low levels that they are not achievable in practice and are not directly measurable. Nevertheless, these goals provide useful guideposts and direction for water management practices. The charts in this report include three types of water quality goals:
- Maximum Contaminant Level Goal (MCLG): The level of a contaminant in drinking water below which there is no known or expected risk to health. MCLGs are set by USEPA.
- Maximum Residual Disinfectant Level Goal (MRDLG): The level of a drinking water disinfectant below which there is no known or expected risk to health. MRDLGs do not reflect the benefits of the use of disinfectants to control microbial contaminants.
- Public Health Goal (PHG): The level of a contaminant in drinking water below which there is no known or expected risk to health. PHGs are set by the California Environmental Protection Agency.
How are Contaminants Measured?
Water is sampled and tested |
S parts per million (ppm) or milligrams per liter (mg/L) |
throughout the year. |
S parts per billion (ppb) or micrograms per liter (µg/L) |
Contaminants are measured in: |
S parts per trillion (ppt) or nanograms per liter (ng/L) |
~ 5 ~
2020 City of Westminster Distribution System Water Quality
|
MCL |
Average |
Range of |
MCL |
Typical Source |
|
(MRDL/MRDLG) |
Amount |
Detections |
Violation? |
of Contaminant |
|
|
|
|
|
|
Aesthetic Quality |
|
|
|
|
|
Color (color units) |
15* |
0.04 |
ND – 4 |
No |
Erosion of Natural Deposits |
Turbidity (NTU) |
5* |
<0.1 |
ND – 1 |
No |
Erosion of Natural Deposits |
|
|
|
|
|
|
Disinfection Byproducts** |
|
|
|
|
|
Total Trihalomethanes (ppb) |
80 |
17 |
ND – 24 |
No |
Byproducts of Chlorine Disinfection |
Haloacetic Acids (ppb) |
60 |
7 |
ND – 5.2 |
No |
Byproducts of Chlorine Disinfection |
Chlorine Residual (ppm) |
(4 / 4) |
0.91 |
0.19 – 2.8 |
No |
Disinfectant Added for Treatment |
|
|
|
|
|
|
Eight locations in the distribution system are tested quarterly for disinfection byproducts;
fifteen locations are tested monthly for color, odor and turbidity. Odor was not detected in 2020. MRDL = Maximum Residual Disinfectant Level; MRDLG = Maximum Residual Disinfectant Level Goal *Constituent is regulated by a secondary standard to maintain aesthetic qualities.
**Disinfection Byproducts average values are based on a locational running annual average.
Lead and Copper Action Levels at Residential Taps
|
Action Level |
Public |
90th Percentile |
Sites Exceeding AL / |
AL |
Typical Source |
|
(AL) |
Health Goal |
Value |
Number of Sites |
Violation? |
in Drinking Water |
Lead (ppb) |
15 |
0.2 |
ND |
0 / 32 |
No |
Corrosion of Household Plumbing |
Copper (ppm) |
1.3 |
0.3 |
0.23 |
0 / 32 |
No |
Corrosion of Household Plumbing |
|
|
|
|
|
|
|
Every three years, 32 residences are tested for lead and copper
Lead was not detected in any of the samples. Copper was detected in 19 samples; none exceeded the action level.
A regulatory action level is the concentration of a constituent which, if exceeded, triggers treatment or other requirements that a water system must follow.
In 2020, no school submitted a request to be sampled for lead.
Unregulated Chemicals Requiring Monitoring in the Distribution System
|
Notification |
|
Average |
Range of |
Most Recent |
Chemical |
Level |
PHG |
Amount |
Detections |
Sampling Date |
Bromochloroacetic Acid (ppb) |
n/a |
n/a |
0.5 |
ND – 2.7 |
2020 |
Bromodichloroacetic Acid (ppb) |
n/a |
n/a |
0.25 |
ND – 2.1 |
2020 |
Chlorodibromoacetic Acid (ppb) |
n/a |
n/a |
0.25 |
ND – 1.3 |
2020 |
Dibromoacetic Acid (ppb) |
n/a |
n/a |
0.53 |
ND – 2.8 |
2020 |
Dichloroacetic Acid (ppb) |
n/a |
MCLG = 0 |
0.43 |
ND – 2.8 |
2020 |
Manganese (ppb) |
SMCL = 50 |
n/a |
4 |
ND – 24.4 |
2020 |
Monobromoacetic Acid (ppb) |
n/a |
n/a |
0.05 |
ND – 0.6 |
2020 |
Trichloroacetic Acid (ppb) |
n/a |
MCLG = 20 |
0.23 |
ND – 2.5 |
2020 |
|
|
|
|
|
|
SMCL = secondary MCL
Source Water Assessments
Imported (MWDSC) Water Assessment
Every five years, MWDSC is required by SWRCB to examine possible sources of drink- ing water contamination in its State Water Project and Colorado River source waters.
The most recent watershed sanitary surveys of its source water supplies from the Colorado River was updated in 2015 and the State Water Project was
updated in 2016.
Water from the Colorado River is considered to be most
vulnerable to contamination from recreation, urban/stormwater
runoff, increasing urbanization in the watershed, and wastewater.
Water supplies from Northern California’s State Water Project are most vulnerable to contamination from urban/stormwater runoff,
wildlife, agriculture, recreation, and wastewater.
USEPA also requires MWDSC to complete one Source Water Assessment (SWA) that utilizes information collected in the watershed sanitary surveys. MWDSC completed its SWA in December 2002. The SWA is used to evaluate the vulnerability of water sources to contamination and helps determine whether more protective measures are needed.
A copy of the most recent summary of either Watershed Sanitary Survey or the SWA can be obtained by calling MWDSC at (800)
Groundwater Assessment
An assessment of the drinking water sources for the City of Westminster was completed in December of 2002 and is continuously being updated.
Westminster groundwater supply wells are considered most vulnerable to the following potential contaminant sources: gas stations, high density housing, dry cleaners, parks, and road right of ways.
You may request a summary or copy of this assessment by contacting Scott Miller, Water Superintendent, Westminster Water Division at (714)
~ 6 ~
Shasta
TrinityLake
Lake
REDDING
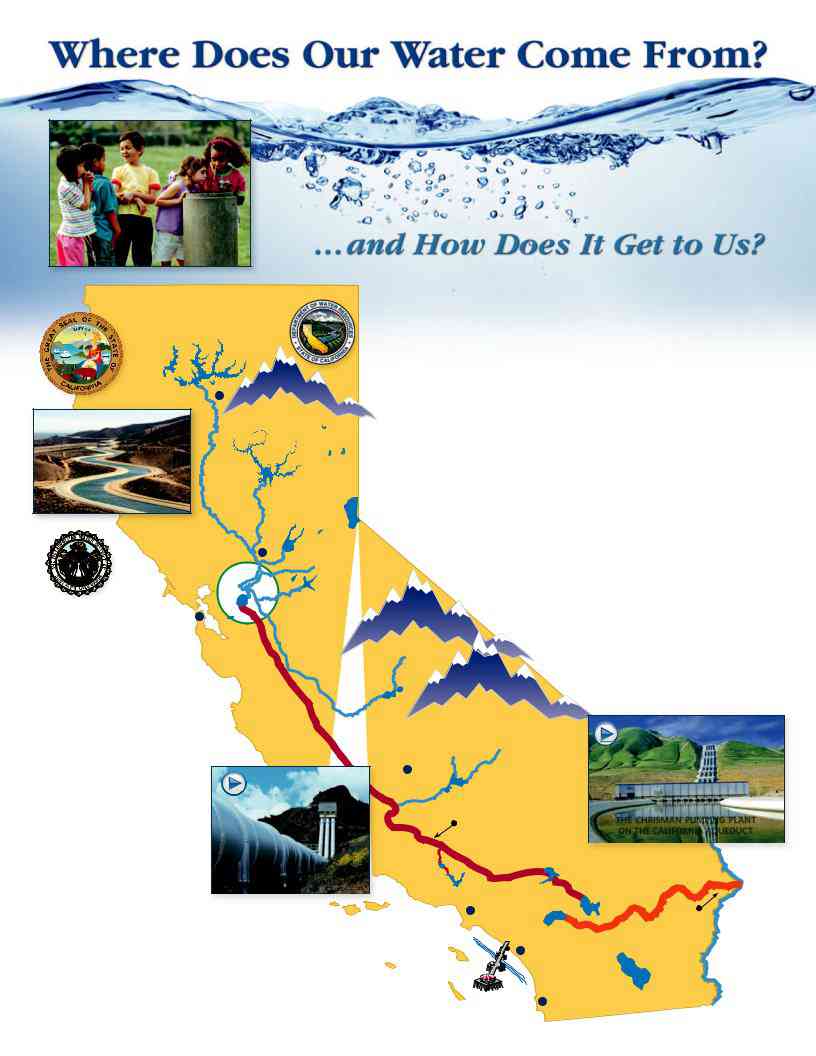
Have you ever wondered where your water comes from? Here in the City of Westminster our water is drawn from local groundwater supplies then blended with water imported from both Northern California and the Colorado River.
Water from Northern California travels to us through a complex delivery system known as the California State Water Project. Designed and built in the 1960s, the State Water Project is one of the largest public water and power utilities in the world, providing drinking water for more than 25 million people statewide.
THE |
|
|
|
Managed by the California Department of Water Resources, the project stretches |
|||
CALIFORNIA |
|
|
|
over 700 miles, from Lake Oroville in the north to Lake Perris in the south. Water |
|||
AQUEDUCT |
|
|
|
||||
|
|
Lake |
|
stored in Lake Oroville, Folsom Lake, and other tributaries, and fed by snow melt |
|||
|
Oroville |
|
|||||
|
|
from the Sierra Nevada Mountains, flows into the Sacramento and San Joaquin |
|||||
|
|
|
|
||||
|
|
|
Feather |
rivers, and from there into reservoirs in the |
|||
Sacramento |
|
River |
From the |
||||
|
|
||||||
River |
|
|
|||||
|
|
Aqueduct, there to flow southward to cities and farms in Central and Southern |
|||||
|
|
|
Folsom |
||||
SACRAMENTO |
|
|
|
||||
Lake |
California. Composed mainly of |
||||||
|
|
|
New |
|
includes over 20 miles of tunnels, more than 130 miles of pipelines, |
||
|
|
|
Hogan |
|
and 27 miles of siphons. Along the way, the water is pumped |
||
|
|
|
Reservoir |
|
|||
|
|
|
|
|
|
||
Managed by the Metropolitan |
|
|
The |
|
2,882 feet over the Tehachapi Mountains. The Edmonston |
||
|
|
|
|||||
Water District of Southern |
|
|
|
Pumping Plant alone lifts millions of gallons a day up |
|||
|
|
|
|
||||
California, the Colorado River |
SAN |
San |
|
1,926 feet, the highest single water lift in the world. |
|||
Joaquin |
|
||||||
Aqueduct begins near Parker Dam |
FRANCISCO |
|
|
|
|||
River |
|
Is it any wonder the State Water Project is the |
|||||
|
|
|
|||||
|
|
|
|
||||
on the Colorado River. There, the |
|
|
Millerton |
||||
|
|
largest single consumer of power in the |
|||||
Gene Pumping Station lifts the water |
|
Lake |
|||||
|
|
|
|||||
|
|
|
State of California? |
||||
over 300 feet as it begins its 242 mile |
|
|
|
||||
|
|
|
|
|
|||
journey to Lake Mathews, just outside |
|
California Aqueduct |
|
||||
the City of Corona. Along the way, the water |
STATE WATER PROJECT |
|
|||||
|
|
|
|
||||
passes through two reservoirs, five |
|
|
|
|
|
|
|
pumping stations, 62 miles of |
|
|
BAKERSFIELD |
Lake |
|
||
|
|
|
|
Isabella |
|
||
canals, and 176 miles of tunnels, |
|
|
|
|
|
||
|
|
|
|
|
|
||
buried conduits and siphons. All |
|
|
|
|
Chrisman |
||
told, the water is lifted four times, |
|
|
|
|
Pumping |
||
|
|
|
|
Plant |
|||
|
|
|
|
|
|
||
a total of more than 1,300 feet. |
|
|
|
|
Silverwood |
Colorado |
|
After its journey across the Mojave |
Pyramid |
Lake |
Aqueduct |
||||
|
|||||||
Lake |
Castaic |
||||||
|
|||||||
Desert, the water descends into |
|
Lake |
|||||
|
|
||||||
|
|
|
|
Lake |
|||
|
|
|
|
LOS |
Perris |
||
the Coachella Valley and through the San Gorgonio Pass. |
|
||||||
|
|
||||||
|
ANGELES |
Gene |
|||||
Near Cabazon, the aqueduct flows underground, passing beneath |
P A C I F I C |
|
Pumping |
||||
Lake |
Station |
||||||
the San Jacinto Mountains and continuing until it reaches its |
O C E A N |
Mathews |
Colorado |
||||
ORANGE |
|||||||
terminus at Lake Mathews. From there, 156 miles of distribution lines, |
|
||||||
|
River |
||||||
|
COUNTY |
||||||
|
|
||||||
along with eight more tunnels and five drinking water treatment plants, |
|
|
|||||
delivers treated water throughout Southern California. |
|
SAN |
|
||||
|
|
|
|
|
DIEGO |
|
|
Water from State Water Project
|
Reservoir |
Colorado River |
|
|
|
|
Aqueduct |
|
|
|
|
|
Water |
Santa |
Water |
|
|
Ana |
|
|
|
Disinfection |
River |
|
Treatment |
Metropolitan |
|
Facility |
|
Plant |
|
|
|
|
Water District |
Well |
Percolation Pond |
|
|
|
|
|||
|
of Southern California |
(for Orange County Water District Groundwater Basin) |
||
|
(via MWD of Orange County) |
|
||
|
|
|
|
|
Storage
Tank
Commercial Building
The City of Westminster Water Division vigorously works to ensure the safety of your drinking water and, in conjunction with MWDSC and OCWD, continuously monitors the water to verify adherence with drinking water regulations.
How Does Our Water Get to Us?
Importing water from hundreds of miles away is only the start to providing you clean, fresh water. Once the water is in the southland, the Municipal Water District of Orange County, in partnership with the Metropolitan Water District of Southern California, pumps the water to individual cities throughout Orange County. The Orange County Water District, which manages the groundwater basin beneath the county, ensures the quality and supply of groundwater throughout its service area. The City of Westminster sits atop the county aquifer and draws water from this local source, then blends it with the imported surface water.
Big Bear |
San Bernardino |
Cascading from its source high in the San Bernardino |
|
||
Reservoir |
|
||||
|
Mountains |
Mountains, the Santa Ana River is fed by a watershed |
|||
|
|
over 2,500 square miles in area. River water is |
|
||
|
|
|
captured behind Prado Dam and slowly released |
||
|
|
Seven to help replenish the Orange County groundwater |
|||
|
|
Oaks |
basin. Percolation ponds in Anaheim and Orange |
||
|
Wetlands |
Dam |
|||
|
|
hold this water so it can seep into the basin. |
|
||
|
|
|
|
||
|
Prado |
|
|
|
|
|
Dam |
|
|
|
|
|
|
|
|
Drinking Water |
To |
|
|
Santa Ana River |
Ocean |
||
|
|
Supply Well |
➥ |
||
Percolation
Ponds
Orange County
Groundwater Basin
(Aquifer)
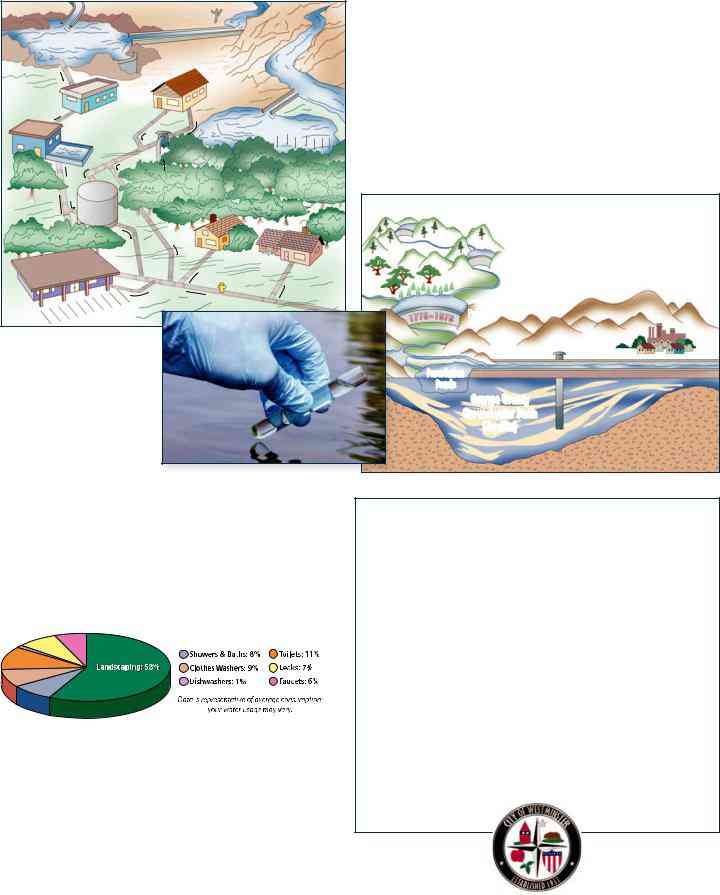
Where Do We Use Water the Most?
Outdoor watering of lawns and gardens makes up approximately
60% of home water use. By reducing your outdoor water use — by
either cutting back on irrigation or planting more drought tolerant
landscaping — you can dramatically reduce your overall water use.
Save the most where you use the most: Make your outdoor use efficient.
Where Can You Learn More?
There’s a wealth of information on the internet about Drinking Water Quality and water issues in general. Some good sites to begin your own research are:
Metropolitan Water District of So. California:
California Department of Water Resources: www.water.ca.gov The Water Education Foundation: www.watereducation.org
To learn more about Water Conservation & Rebate Information: www.bewaterwise.com S www.ocwatersmart.com
And to see the Aqueducts in action, checkout these two videos: Wings Over the State Water Project: youtu.be/8A1v1Rr2neU Wings Over the Colorado Aqueduct: youtu.be/KipMQh5t0f4
We Invite You to Learn More About
Your Water’s Quality
For information about this report, or your water quality in general, please contact Paul Kalix at (714)
-
898-3311. The City Council meets every second and fourth Wednesday in the Council Chambers at 8200 Westminster Boulevard. We are also reachable by mail at the City of Westminster Water Division, 14381 Olive Street, Westminster, California 92683.
For more information about the health effects of the listed contaminants in the enclosed tables, call the USEPA hotline at (800)426-4791.
City of Westminster Water Division
14381 Olive Street S Westminster, California 92683
(714)
Contaminants
City of Westminster
EWG's drinking water quality report shows results of tests conducted by the water utility and provided to the Environmental Working Group by the California State Water Resources Control Board, as well as information from the U.S. EPA Enforcement and Compliance History database (ECHO). For the latest quarter assessed by the U.S. EPA (January 2019 - March 2019), tap water provided by this water utility was in compliance with federal health-based drinking water standards.
Utility details
- Serves: 91169
- Data available: 2012-2017
- Data Source: Purchased surface water
- Total: 23
Contaminants That Exceed Guidelines
- Arsenic
- Bromodichloromethane
- Chloroform
- Chromium (hexavalent)
- Dibromochloromethane
- Nitrate
- Nitrate and nitrite
- Total trihalomethanes (TTHMs)
- Uranium
Other Detected Contaminants
- 1%2C4-Dioxane
- Barium
- Bromide
- Bromoform
- Chlorate
- Dibromoacetic acid
- Dichloroacetic acid
- Fluoride
- Haloacetic acids (HAA5)
- Manganese
- Molybdenum
- Strontium
- Trichloroacetic acid
- Vanadium
Reminder
Always take extra precautions, the water may be safe to drink when it leaves the sewage treatment plant but it may pick up pollutants during its way to your tap. We advise that you ask locals or hotel staff about the water quality. Also, note that different cities have different water mineral contents.