Table of Contents
Can You Drink Tap Water in Santa Clarita?
Yes, Santa Clarita's tap water is generally considered safe to drink as Santa Clarita has no active health based violations of the Safe Drinking Water Act (SDWA) that we are aware of. Other factors such as lead piping in a home, or low levels of pollutants on immunocompromised individuals, should also be considered, however. To find more recent info we might have, you can check out our boil water notice page, the city's water provider website, or Santa Clarita's local Twitter account.
According the EPA’s ECHO database, from April 30, 2019 to June 30, 2022, Santa Clarita's water utility, Santa Clarita Valley W.A.-Santa Clarita, had 0 violations of the Safe Drinking Water Act. For more details on the violations, please see our violation history section below. This assessment is based on the Santa Clarita Valley W.A.-Santa Clarita water system, other water systems in the city may have different results.
While tap water that meets the EPA health guidelines generally won’t make you sick to your stomach, it can still contain regulated and unregulated contaminants present in trace amounts that could potentially cause health issues over the long-run. These trace contaminants may also impact immunocompromised and vulnerable individuals.
The EPA is reviewing if it’s current regulations around pollutant levels in tap water are strict enough, and the health dangers posed by unregulated pollutants, like PFAS.
Water Quality Report for Santa Clarita Tap Water
The most recent publicly available numbers for measured contaminant levels in Santa Clarita tap water are in its 2020 Water Quality Report. As you can see, there are levels which the EPA considers to be acceptable, but being below the maximum allowable level doesn’t necessarily mean the water is healthy.
Lead in tap water, for example, is currently allowed at up to 15ppb by the EPA, but it has set the ideal goal for lead at zero. This highlights how meeting EPA standards doesn’t necessarily mean local tap water is healthy.
EPA regulations continue to change as it evaluates the long term impacts of chemicals and updates drinking water acceptable levels. The rules around arsenic, as well as, lead and copper are currently being re-evaluated.
There are also a number of "emerging" contaminants that are not currently. For example, PFAS (Per- and polyfluoroalkyl substances), for which the EPA has issued a health advisory. PFAS are called "forever chemicals" since they tend not to break down in the environment or the human body and can accumulate over time.
We recommend looking at the contaminants present in Santa Clarita's water quality reports, or getting your home's tap water tested to see if you should be filtering your water.
Santa Clarita Tap Water Safe Drinking Water Act Violation History - Prior 10 Years
Below is a ten year history of violations for the water system named Santa Clarita Valley W.A.-Santa Clarita for Santa Clarita in California. For more details please see the "What do these Violations Mean?" section below.
Is there Lead in Santa Clarita Water?
Based on the EPA’s ECHO Database, 90% of the samples taken from the Santa Clarita water system, Santa Clarita Valley W.A.-Santa Clarita, between sample start date and sample end date, were at or below, 0.0 mg/L of lead in Santa Clarita water. This is 0% of the 0.015 mg/L action level. This means 10% of the samples taken from Santa Clarita contained more lead.
While Santa Clarita water testing may have found 0.0 mg/L of lead in its water, that does not mean your water source has the same amount. The amount of lead in water in a city can vary greatly from neighborhood to neighborhood, or even building to building. Many buildings, particularly older ones, have lead pipes or service lines which can be a source of contamination. To find out if your home has lead, we recommend getting you water tested.
No amount of lead in water is healthy, only less dangerous. As lead accumulates in our bodies over time, even exposure to relatively small amounts can have negative health effects. For more information, please check out our Lead FAQ page.
Are there PFAS in Santa Clarita Tap Water?
Currently, testing tap water for PFAS isn’t mandated on a national level. We do have a list of military bases where there have been suspected or confirmed leaks. There appears to be at least one military base - Air Force Plant 42 - near Santa Clarita with suspected leaks.
With many potential sources of PFAS in tap water across the US, the best information we currently have about which cities have PFAS in their water is this ewg map, which you can check to see if Santa Clarita has been evaluated for yet.
Our stance is better safe than sorry, and that it makes sense to try to purify the tap water just in case.
What do these Violations Mean?
Safe Drinking Water Act Violations categories split into two groups, health based, and non-health based. Generally, health based violations are more serious, though non-health based violations can also be cause for concern.
Health Based Violations
- Maximum contaminant levels (MCLs) - maximum allowed contaminant level was exceeded.
- Maximum residual disinfectant levels (MRDLs) - maximum allowed disinfectant level was exceeded.
- Other violations (Other) - the exact required process to reduce the amounts of contaminants in drinking water was not followed.
Non-Health Based Violations
- Monitoring and reporting violations (MR, MON) - failure to conduct the required regular monitoring of drinking water quality, and/or to submit monitoring results on time.
- Public notice violations (Other) - failure to immediately alert consumers if there is a serious problem with their drinking water that may pose a risk to public health.
- Other violations (Other) - miscellaneous violations, such as failure to issue annual consumer confidence reports or maintain required records.
SDWA Table Key
| Field | Description |
|---|---|
| Compliance Period | Dates of the compliance period. |
| Status |
Current status of the violation.
|
| Health-Based? | Whether the violation is health based. |
| Category Code |
The category of violation that is reported.
|
| Code | A full description of violation codes can be accessed in the SDWA_REF_CODE_VALUES (CSV) table. |
| Contaminant Code | A code value that represents a contaminant for which a public water system has incurred a violation of a primary drinking water regulation. |
| Rule Code |
Code for a National Drinking Water rule.
|
| Rule Group Code |
Code that uniquely identifies a rule group.
|
| Rule Family Code |
Code for rule family.
|
For more clarification please visit the EPA's data dictionary.
Santa Clarita Water - Frequently Asked Questions
| By Phone: | 661-388-4934 |
| By Email: | kabercrombie@scvwa.org |
| By Mail: | 23780 NORTH PINE STREET NEWHALL, CA, 91321 |
Existing customers can login to their Santa Clarita Valley W.A.-Santa Clarita account to pay their Santa Clarita water bill by clicking here.
If you want to pay your Santa Clarita Valley W.A.-Santa Clarita bill online and haven't made an account yet, you can create an account online. Please click here to create your account to pay your Santa Clarita water bill.
If you don't want to make an account, or can't remember your account, you can make a one-time payment towards your Santa Clarita water bill without creating an account using a one time payment portal with your account number and credit or debit card. Click here to make a one time payment.
Moving to a new house or apartment in Santa Clarita means you will often need to put the water in your name with Santa Clarita Valley W.A.-Santa Clarita. In order to put the water in your name, please click the link to the start service form below. Start service requests for water bills typically take two business days.
Leaving your house or apartment in Santa Clarita means you will likely need to take your name off of the water bill with Santa Clarita Valley W.A.-Santa Clarita. In order to take your name off the water bill, please click the link to the stop service form below. Stop service for water bills requests typically take two business days.
The estimated price of bottled water
$1.60 in USD (1.5-liter)
USER SUBMITTED RATINGS
- Drinking Water Pollution and Inaccessibility
- Water Pollution
- Drinking Water Quality and Accessibility
- Water Quality
The above data is comprised of subjective, user submitted opinions about the water quality and pollution in Santa Clarita, measured on a scale from 0% (lowest) to 100% (highest).
Related FAQS
Santa Clarita Water Quality Report (Consumer Confidence Report)
The EPA mandates that towns and cities consistently monitor and test their tap water. They must report their findings in an annual Consumer Confidence Report. Below is the most recent water quality report from Santa Clarita's Water. If you would like to see the original version of the report, please click here.
2021
Water Quality Report
Clean, Safe Water That Our Customers Can Trust
The State Water Resources Control Board Division of Drinking Water (DDW) requires community water systems to publish and make available an annual Consumer Confidence Report to provide background on the quality of your water and to show compliance with federal and state drinking water standards.
This 2021 Annual Water Quality Report is a snapshot of the quality of local water supplies in the Santa Clarita Valley during 2020. Included are details about where your water comes from, what it contains and how it compares to strict Federal and State standards. We are committed to providing you with information because informed
customers are our best allies.
Our Promise to Our Customers:
WAT
SANTA CLARITA VALLEY SUPPLY PORTFOLIO
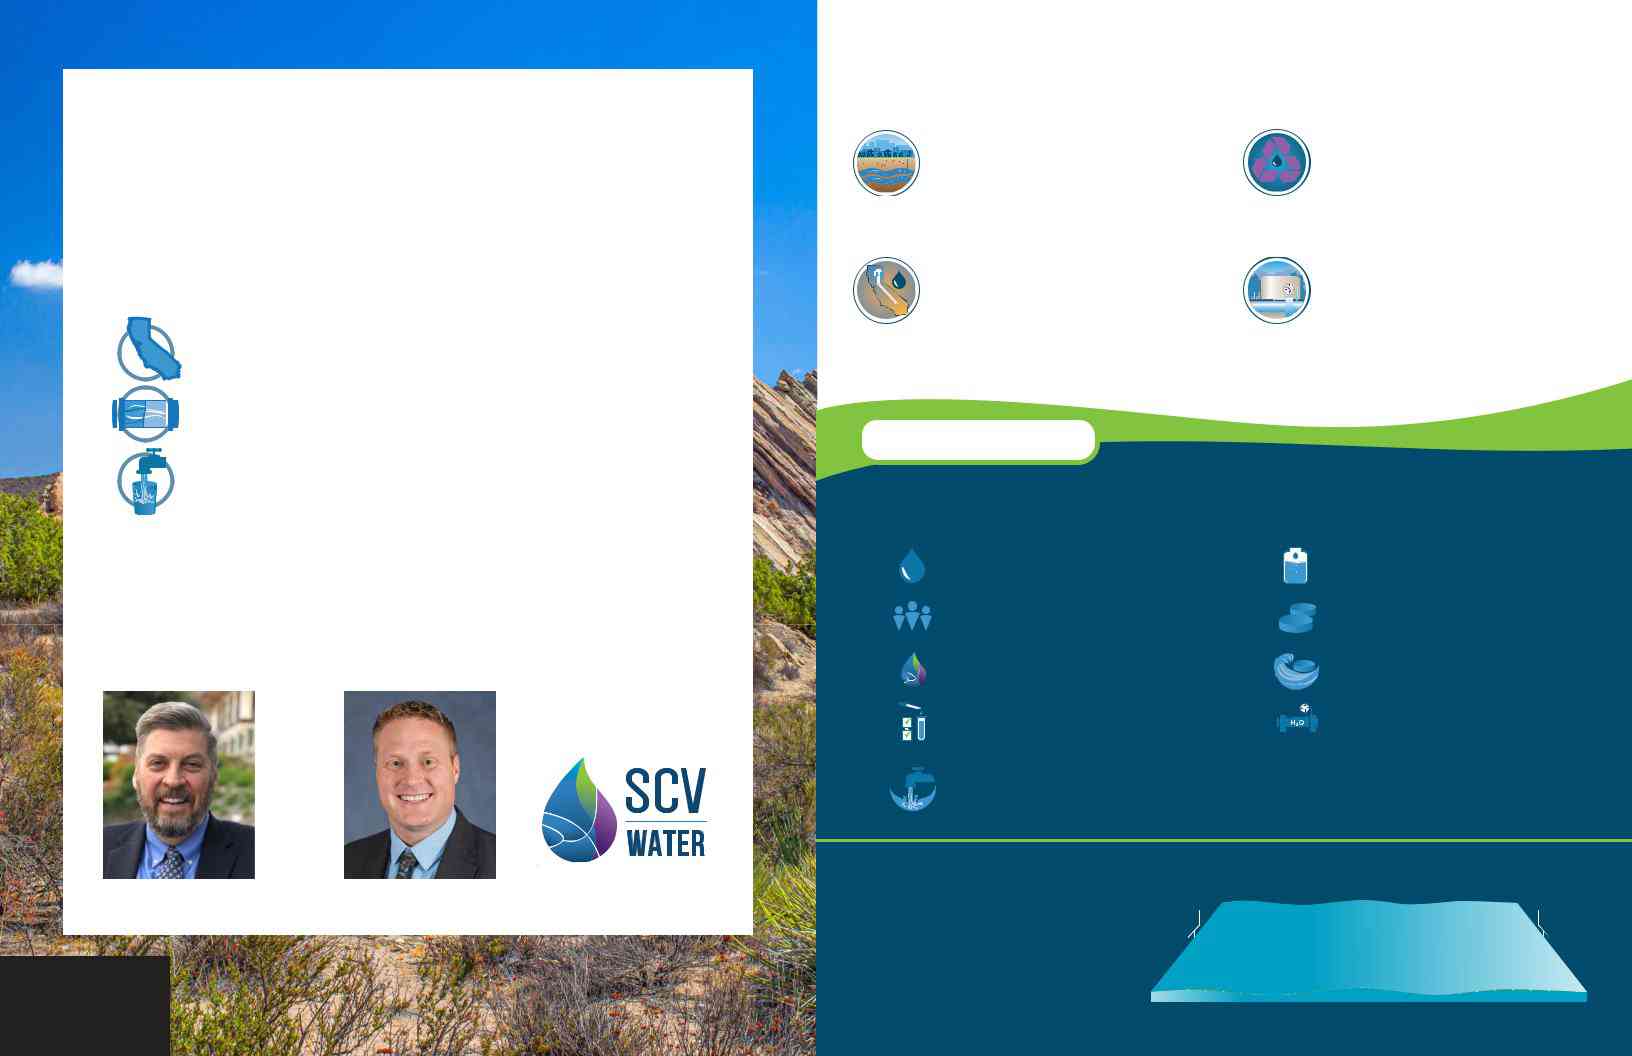
SCV Water’s water supply comes from four main sources, imported water, groundwater, recycled water and water banking (storage). Leveraging multiple sources of water ensures our customers always have water when they need it.
Clean, Safe Water That You Can Trust
Dear Customer:
The past year has brought all of us challenges and uncertainty. One thing that our customers can rest assured about is that our team of essential workers continues to provide you with clean, safe water day and night.
SCater and aterworks District ve worked together to provide you with our ater t e
Where your water comes from
How we treat and monitor it thousands of times per year
WAT
More than a quarter (17,300
AT
We rely on imported water from the State Water project for nearly 75 percent (48,300
AT
Less than one percent of our water currently comes from recycled water. Future plans will expand our recycled water use for outdoor irrigation to ensure our customers have a reliable water source for years to come.
AT
Our Agency also stores (banks) 141,000
How we ensure its safety when it reaches your tap
ead this report, you’ll also find important information on our e planning efforts, programs and initiatives.
e appreciate playing such a large role in the fabric of the Santa Clarita alley and being a trusted source for your water supply.
Matthew G. Stone |
Russ Bryden |
ater |
ector C |
AT
Serving our community safe, reliable water that meets or surpasses rigorous state and federal standards is a hallmark of our agency. It takes a lot of testing, storage reservoirs, and pipes, along with our talented team of water professionals, to make sure water is delivered to your homes 24/7.
75,000 |
141,000 |
Service Connections |
Water Stored in Kern County |
274,000 |
95 |
Population Served |
Local Water Storage Tanks |
195 |
163 Million |
Square Miles of Service Area |
Gallons of Water Storage Capacity |
20,000 |
879 Miles |
Water Tests Per Year |
Pipeline |
20+ Billion
Gallons of Water Served to Customers
Water Talk
in an
One
2 | SCV WATER |
SCV WATER | 3 |
2 | SCV WATER |
PLANNING FOR OUR FUTURE
ater is undertaking several multiter planning efforts to ensure our customers have access to reliable water today and tomorrow. ter plans and programs will enhance our water reliability, , environmental sustainability and delivery
WATER YOU CAN TRUST
SCV Water’s 2021 Water Quality Report
Your health and safety is our top priority. Before reaching your tap, our water must withstand rigorous rounds of treating, monitoring and testing thousands of times per year.
ter.comor more info.
GROUNDWATER SUSTAINABILITY PLAN alley oundwater esponsibly manages
our vital groundwater, which is stored underground in the alley e our oundwater eed by
the oundwater t is tailored to the resources and needs
of our community to maintain and improve resource management. f this plan is to demonstrate sustainable groundwater management within 20 years.
RECYCLED WATER PLANNING
Recycled water is a renewable resource and has been used for outdoor irrigation in our service area since 2003. Using recycled water extends our drinking water supply, reduces our reliance on costly imported water and expands our local water supply.
on a recycled water management plan to guide future efforts.
Protecting Our Water Source
e regularly sample where our water comes om
a Source ater Assessmente work with scientists and eom the state to ensure that any contaminants ound in our water are proactively addressed.
Cleaning Our Water
ter travels om the source to one o
treatment plants, we use multiple processes to treat and clean our water. Here harmganisms, like viruses and bacteria, are removed or inactivated.
Sampling and Testing Our Water
o ensure our water system is working as it should and that water meets or surpasses all state and ederal health and saety standards, we conduct more than ,ter
tests each year.
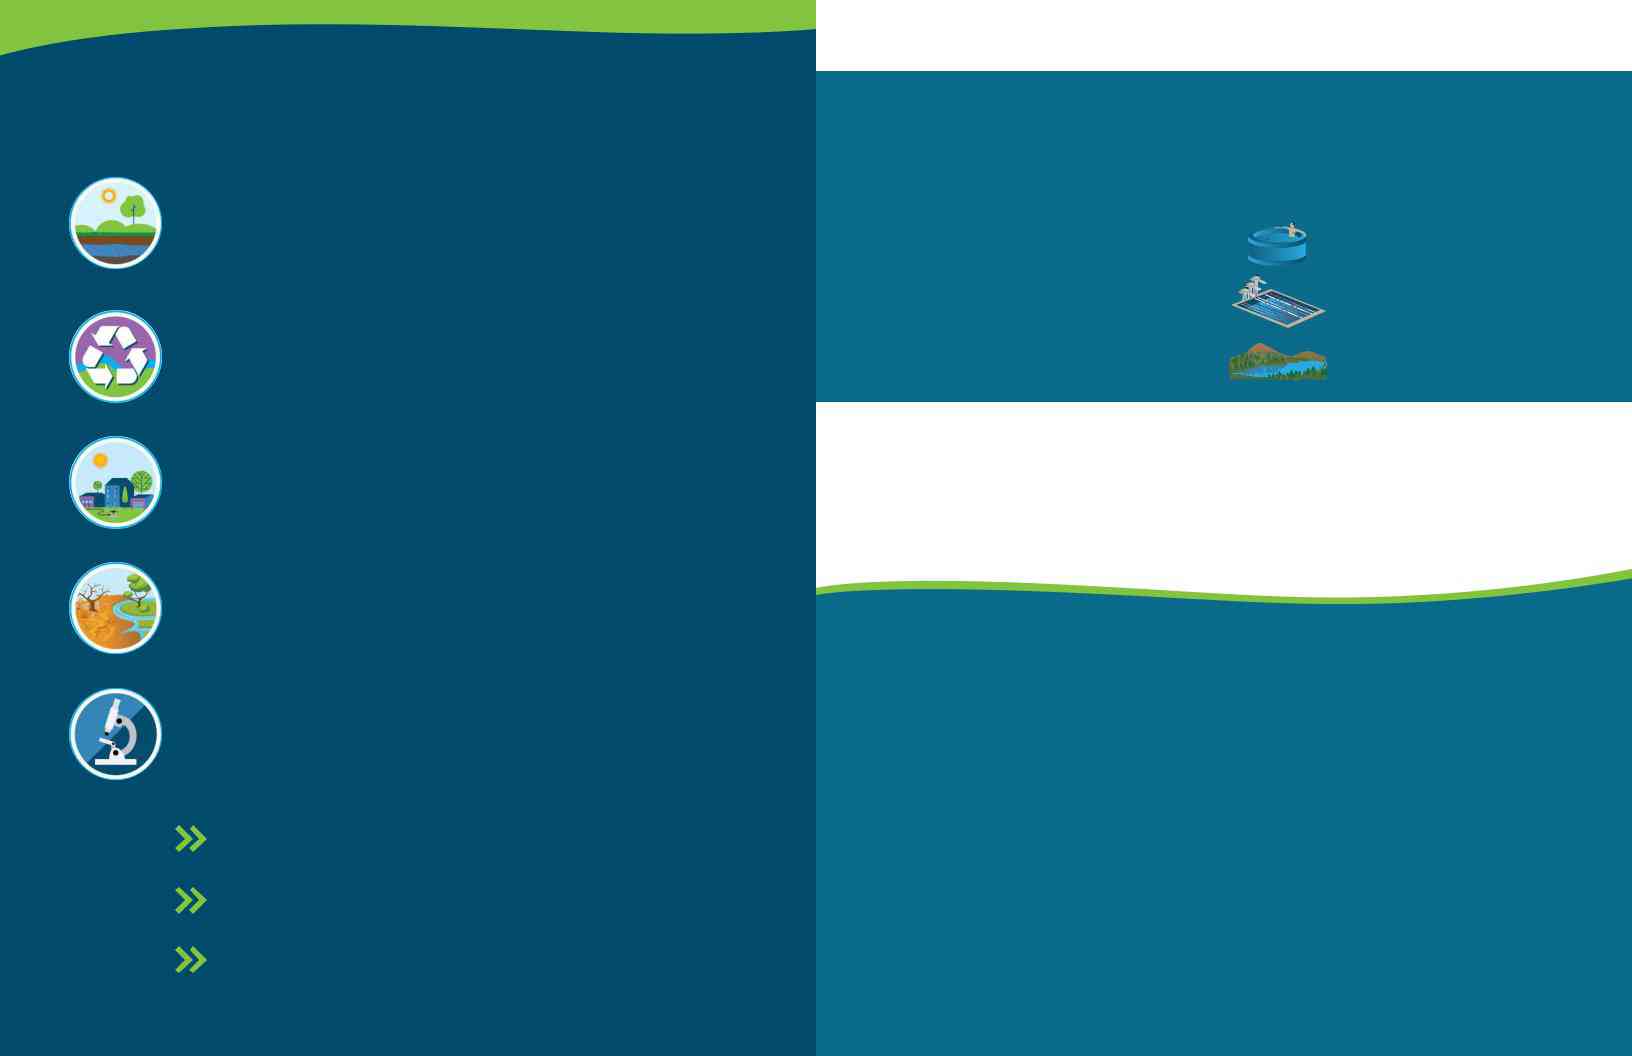
Water Talk: What is a PPM, PPB, PPT?
oughout our water eport, you will see contaminants measured by parts per million or
per billion or ograms/
or e’s a breakdown ot these measurements translate to in real lie.
op
in a hot tub
ograms/op
in an e swimming pool
rillion or op in a acre lake
URBAN WATER MANAGEMENT PLAN ater’s team is preparing our Urban ater te.
stateeed update will direct our longesource planning to guarantee adete water supplies are available to meet future water needs.
WATER SHORTAGE CONTINGENCY PLAN
IMPORTANT INFO FROM THE EPA ON DRINKING WATER
Some people may be more vulnerable to contaminants in drinking water than the general population.
other immune system disorders, some elderly, and int risk om inections. about drinking water om their health care providers. .S. A/or ol opriate means to lessen the risk oection by obial contaminants are available om the .S. A’s Sae ater Hotline
esults in this report were analyed in eport was
not detected or was detected below the detection level or purposes oeporting. our local water supplier is in compliance with all drinking water regulations unless a specific violation is noted.
o ensure that we have adete water supplies now and in the future, ater is preparing our ater eed by the state and will
improve water conservation and water shortage planning, especially during a drought or catastrophic event.
PFAS TREATMENT
e many communities throughout the nation, very small amounts of polyfluoralkyl substancese in our water. ater, and other agencies, did not put these chemicals in our water but over time these chemicals enter our water supply through manufacturing, product use and wastewater discharge – which are all potential sources for . essing ter supply, ater is
using a threeonged approach
TESTINGoactively monitors the f the water from our wells
to ensure it meets the state’s regulations for , which are some of the most stringent in the nation.
TREATMENT, innovative strategies and proven treatment options, ater is taking immediate steps to address oundwater.
TRANSPARENCYrom our website to social media and community meetings to direct mail, ater is making sure our customers have the most current information.
4 | SCV WATER
MICROBIOLOGICAL
obial contaminants, such as viruses and bacteria, can be naturally occurring or result om urban storm water runoff, sewage treatment plants, septic systems, agricultural livestock operations and wildlie.
ter is tested throughout the distribution systems weekly or otal orm e naturally occurring
in the environment and are indicators or finding possible
or esults or
larger systems and two positive samples per month in smaller systems. Iough routine testing,
the water is ed or
indicates the potential oecal contamination.
detected in any drinking water system in the Santa alley ter system was out o
the otal orm ter-
borne parasites dia lamblia in any sample oeated imported surter.
All water systems are reed to comply with the state otal orm ederal otal orm
that took effect April . ederal rule protects public health by ensuring the integrity oter distribution system and monitoring or the presence oobials and .S. onmental otection Agency
Ates greater public health protections as the
new rule rees water systems that are vulnerable to microbial contamination to identioblems. ater systems that
eceed a specified eorm occurrences are
reed to conduct an assessment to determine i deects eect them.
METALS AND SALTS
e reed to be tested in groundwater once
every three years and in surter every month. turally occurring salts are ound in both suroundwater.
include chloride, fluoride, nitrate, nitrite, calcium, magnesium, potassium and sodium. , these are reerred to as otal
e up what
is known as water hardness which can cause scaling om the precipitates. ter. Any
fluoride detection is naturally occurring in the groundwater.
te in drinking water at levels above ogen is a health risk or in
levels can interere with the capacity o carry oesulting in a serious illness shortness oeath and blueness o nitrate levels may also aect the ability o oegnant woman and
those with certain ene caring or an
ine pregnant, you should ask advice om your health care provider. te was not detected above the in any sample.
SCV WATER | 5
LEAD AND COPPER
Every three yearster system is reed to sample for
lead and copper at specific customer taps as part of the Copper e also tested in source water
supplies (i.e.oundwater and surface water). ater also tested all public
of lead were detected in any source waters in the Valley by any of the local water systems.
fants and young children are typically more vulnerable to lead in drinter than the general population
health problems could result. our water system is responsible for providing high ter but cannot control the
materials used in customer plumbing components. e
DRINKING WATER SOURCE ASSESSMENT AND PROTECTION
The sources of drinter (both tap water and bottled water) include riverseseamseservoirs
water travels over the surface of the land or through the ground dissolves naturally occurring minerals and
materialesulting from the presence of animals or from human activity.
Contaminants that may be present in source water include:
- obial contaminants such as viruses and bacteria that may come from sewage treatment plants agricultural livestoctions and wildlife.
-
ganic contaminantst can be
naturally occurring or result from urban stormwater runoff industrial or domestic wastewater discharges production -
t may come from a variety of
sources such as agricultureter runoff and residential uses. -
Organic chemical contaminants
volatile organic chemicals that areby-products of industrial processes and petroleum productionom
gas stationster runofftion and septic systems. -
t can be naturally occurring or be
the result of oil and gas production and mining activities.
To ensure that tap water is safe to drintate ater ces Control d (f ater
ORGANIC COMPOUNDS
Organic chemical contaminants including synthetic and volatile organic compounds (VOC) are
the oblems and an increased risf cancer.
TURBIDITY
Turbidity is a measure of the cloudiness of the water. e monitor it because it is a good indicator of water .
can hinder the effectiveness of disinfectants. urthermoret the treatment plantsed because it is a good
indicator of the effectiveness of our filtration systems.
6 | SCV WATER
that lead levels at your home may be higher than at other homes in the community as a result of materials used in your home’s plumbing.
e concerned about elevated lead levels in your home’s waterve your water tested by a private
laboratory. ter has been sitting for several hours can flush your tap for ore using
tap water. formation on lead in drinter testing methodse to minimie ee
is available from the ’s fe ater (t www.epa.gov
(escribe regulations that limit the amount of certain contaminants in water provided by public water systems. ..
tion regulations and California law
also establish limits for contaminants in bottled water that provide protection for public health. formation on bottled water is available on the California f
ograms fdbprogramsoodsafetyprogramter.asp
Every water division completed the ater ce otection (ogram for e
groundwater sources in e also completed
for each new groundwater well placed into service by water systems. Each s at vulnerability to contamination
and assesses potential sources of contamination from sources such asepair shopstions
facilitiested in the vicinity of each groundwater source.
f the drinter sourceell Eor the Valencia ater ea was completed
f the permitting process for the new well. There are no ces detected in the water
supply. ell Eed most vulnerable to chemical petroleum pipeline and electricalonic manufacturing
that is not associated with any detectable contaminants. The well is located west of The Old f
-
Commerce Center e information regarding
following websiteterboards.ca.govter drinter.html. ou may ref
the assessment be sent to you by contacting the
district engineer at (.
SCV WATER SOURCES OF WATER SUPPLY
ater provides drinter from multiple sources. tate ater oter is imported from ornia
treated through one of our two treatment plants and then enters the distribution system. oundwater is pumped from two natural underground aerstion.
ter is also provided for some irrigation uses. These
sources are served in various proportions to service areas within the ater ater
and Valencia ater Vovides treated water to aterwors .
LOS ANGELES COUNTY WATERWORKS DISTRICT #36 serves approtely ted in
Val Verdeough ed connections. The
water supply is composed of oundwater from one well pumping from the ormation beneath the
area and f imported water.
District 36 will begin work to replace an aged water main in the unincorporated community of Val Verde, on Del Valle Road, Hasley Canyon Road to Lincoln ews will install a new
water main to enhance water consertion and improter supply throughout the district
ough ch
SCV WATER - NEWHALL WATER DIVISION ser located in the Castaic, ee and esoro del Valle areas, Castaic customers receiter
and oundwater, ecei
imported water and oundwateree customers receiter, and esoro del Valle customers receiter
SCV WATER - SANTA CLARITA WATER DIVISION pro water to a portion of the City of ted
areas of Los , and eceiotely
water and oundwater in
SCV WATER - VALENCIA WATER DIVISION supplies water to customers in Valencia, tef Castaic,
, customers recei
water, oundwater and ecycled water ed to large landscape customers
CHEMICALS IN THE NEWS
PERCHLORATE
chlorate is an inorganic chemical used in solid rocket propellant, fireworks, ef industries
usually gets into drinking water as a result of enonmental contamination from historic industrial operations that used, stored, or disposed of perchlorate and its saltschlorate has been shown to interfere with uptake of iodide by the thyroid gland, and thereby reduce the production of thyroid hormones leading to adects associated with inadete hormone
le
chlorate contaminant plume has been identified and seor perchlorate
-
the DDf 6 ugor perchlorate Diater , ,
authorif the perchlorateeatment facility and, on , oduced the
ABBREVIATIONS
AL = Action Level
DLR = Detection Limit for Reporting
MRL = Minimum Reporting Level
ESFP = Earl Schmidt Filtration Plant
MCL = Maximum Contaminant Level
MCLG = Maximum Contaminant Level Goal
MG / L = milligrams / Liter
UG / L = micrograms / Liter
NG / L = nanograms / Liter
US / CM = microsiemens / centimeter
NA = Not Analyzed / Not Applicable
NTU = Nephlometric Turbidity Units
PCI / L = picocuries / Liter
PHG = Public Health Goal
treated water into the distribution system in full compliance with the reements of its amended water
PER- AND POLYFLUOROALKYL SUBSTANCES (PFAS) polyfluoroalkyl substances e a group of chemicals that are resistant to heat, water, and oil
the tates onmental otection
emerging contaminant on the national landscape
forceable drinking water standards, called maor these substances, but they haf
nanograms per liter or a combined lef two of the more preooctanoic acid
perfluorooctanesulfonic acid ornia
tate ater Resources Control d – Dif Drinking ater has set notification and response lefor and notification leor constituents
lacking an ees public notification for constituents eceeding these esponse leegulatory, precautionary, healthe, where DDecommends remoter source from seroeatment if
that option is a
-
DDor esponse leor f
ch , DDf orders related
to the sampling for ound of monitoring, ater emoom ser
which eceeded the combined RL, DD reor
ater
responded by remoadditional wells from ser - additional wells were emo
from seretions
approaching the RL, ater brought the first ion echange treatment for ee wells back into serently, ater is in f
design and construction for eatment plants to return more of these wells back into ser
esults tabulated in the table of this report are for the calendar year, ater is continuing
in wellsta in the table may reflect wells that are no longer in sere information and resources on ,
yourter
RVWTP = Rio Vista Water Treatment Plant
- = Treatment Technique
RL = Response Level
* SWRCB considers 50 pCi/L to be the level of concern for Beta particles
- Refer to the first Import column for values left blank in Pinetree and Tesoro, except in the specific rows shown
- Depending on annual temperatures
- There are three MCLs for this parameter:
The first is the recommended long term MCL
The second is the upper long term MCL
The third is the short term MCL
4 The NL for Boron = 1000 ug/L or 1 mg/L
- There is currently no MCL for hexavalent chromium. The previous MCL of 10ug/L was withdrawn on September 11, 2017.
SCV WATER | 7
|
|
|
|
|
SANTA CLARITA VALLEY WATER AGENCY |
SANTA CLARITA VALLEY WATER AGENCY |
SANTA CLARITA VALLEY WATER AGENCY |
SANTA CLARITA VALLEY WATER AGENCY |
SANTA CLARITA VALLEY WATER AGENCY |
SANTA CLARITA VALLEY WATER AGENCY |
SANTA CLARITA VALLEY WATER AGENCY |
SANTA CLARITA VALLEY WATER AGENCY |
LOS ANGELES COUNTY |
|
|||||||||||||||||||||||||||||
CONSTITUENTS |
UNITS |
NL |
RL |
CCRDL |
|
IMPORT DIVISION |
|
|
IMPORT DIVISION |
|
NEWHALL WATER DIVISION |
NEWHALL WATER DIVISION |
NEWHALL WATER DIVISION |
NEWHALL WATER DIVISION |
WATERWORKS DISTRICT |
|
|||||||||||||||||||||||||||
|
|
|
|
SANTA CLARITA WATER DIVISION |
VALENCIA WATER DIVISION |
|
|||||||||||||||||||||||||||||||||||||
|
|
|
|
|
(% GROUNDWATER AND % SURFACE WATER) |
PERCHLORATE TREATMENT PLANT |
|
|
CASTAIC |
|
|
|
NEWHALL |
|
|
|
PINETREE1 |
|
|
TESORO1 |
|
|
#36 |
|
|
||||||||||||||||||
|
|
|
|
|
|
|
|
|
|
|
|
|
|
|
|
|
|
|
|
|
|
|
|
|
|
|
|||||||||||||||||
|
|
|
|
|
|
RANGE |
|
|
|
RANGE |
|
|
|
RANGE |
|
|
RANGE |
|
|
RANGE |
|
|
RANGE |
|
|
RANGE |
|
RANGE |
|
TYPICAL |
|
RANGE |
|
|
|||||||||
INORGANICS |
|
|
|
|
|
|
|
|
TYPICAL |
|
|
|
|
TYPICAL |
|
|
|
TYPICAL |
|
|
|
TYPICAL |
|
|
|
TYPICAL |
|
|
|
TYPICAL |
|
|
|
TYPICAL |
|
|
|
|
|
|
|
|
TYPICAL |
|
|
|
|
|
MINIMUM |
|
MAXIMUM |
|
|
MINIMUM |
|
MAXIMUM |
|
|
MINIMUM |
|
MAXIMUM |
|
MINIMUM |
|
MAXIMUM |
|
MINIMUM |
|
MAXIMUM |
|
MINIMUM |
|
MAXIMUM |
|
MINIMUM |
|
MAXIMUM |
|
MINIMUM |
|
MAXIMUM |
|
MINIMUM |
|
MAXIMUM |
|
|
Perfluorobutanesulfonic Acid (PFBS) |
ng/L |
|
|
4 |
<CCRDL |
|
<CCRDL |
|
<CCRDL |
NA |
|
NA |
|
NA |
<CCRDL |
|
20.0 |
7.6 |
<CCRDL |
|
20.0 |
7.8 |
<CCRDL |
|
<CCRDL |
<CCRDL |
<CCRDL |
|
10.0 |
5.0 |
NA |
|
NA |
NA |
NA |
|
NA |
NA |
NA |
|
NA |
|
NA |
|
|
|
|
|
|
|
|
|
|
|
|
|
|
|
|
|
|
|
|
|
|
|
|
|
|
|
|
|
|
|
|
|
|
|
|
|
|
|
|
|
|
|
|
Perfluorononanoic Acid (PFNA) |
ng/L |
|
|
4 |
<CCRDL |
|
<CCRDL |
|
<CCRDL |
NA |
|
NA |
|
NA |
<CCRDL |
|
<CCRDL |
<CCRDL |
<CCRDL |
|
<CCRDL |
<CCRDL |
<CCRDL |
|
<CCRDL |
<CCRDL |
<CCRDL |
|
<CCRDL |
<CCRDL |
NA |
|
NA |
NA |
NA |
|
NA |
NA |
NA |
|
NA |
|
NA |
|
|
|
|
|
|
|
|
|
|
|
|
|
|
|
|
|
|
|
|
|
|
|
|
|
|
|
|
|
|
|
|
|
|
|
|
|
|
|
|
|
|
|
|
Perfluorodecanoic Acid (PFDA) |
ng/L |
|
|
4 |
<CCRDL |
|
<CCRDL |
|
<CCRDL |
NA |
|
NA |
|
NA |
<CCRDL |
|
<CCRDL |
<CCRDL |
<CCRDL |
|
<CCRDL |
<CCRDL |
<CCRDL |
|
<CCRDL |
<CCRDL |
<CCRDL |
|
<CCRDL |
<CCRDL |
NA |
|
NA |
NA |
NA |
|
NA |
NA |
NA |
|
NA |
|
NA |
|
|
|
|
|
|
|
|
|
|
|
|
|
|
|
|
|
|
|
|
|
|
|
|
|
|
|
|
|
|
|
|
|
|
|
|
|
|
|
|
|
|
|
|
Perfluorotetradecanoic Acid (PFTA) |
ng/L |
|
|
4 |
<CCRDL |
|
<CCRDL |
|
<CCRDL |
NA |
|
NA |
|
NA |
<CCRDL |
|
<CCRDL |
<CCRDL |
<CCRDL |
|
<CCRDL |
<CCRDL |
<CCRDL |
|
<CCRDL |
<CCRDL |
<CCRDL |
|
<CCRDL |
<CCRDL |
NA |
|
NA |
NA |
NA |
|
NA |
NA |
NA |
|
NA |
|
NA |
|
|
|
|
|
|
|
|
|
|
|
|
|
|
|
|
|
|
|
|
|
|
|
|
|
|
|
|
|
|
|
|
|
|
|
|
|
|
|
|
|
|
|
|
Hexafluoropropylene Oxide Dimer Acid |
ng/L |
|
|
4 |
<CCRDL |
|
<CCRDL |
|
<CCRDL |
NA |
|
NA |
|
NA |
<CCRDL |
|
<CCRDL |
<CCRDL |
<CCRDL |
|
<CCRDL |
<CCRDL |
<CCRDL |
|
<CCRDL |
<CCRDL |
<CCRDL |
|
<CCRDL |
<CCRDL |
NA |
|
NA |
NA |
NA |
|
NA |
NA |
NA |
|
NA |
|
NA |
|
|
|
|
|
|
|
|
|
|
|
|
|
|
|
|
|
|
|
|
|
|
|
|
|
|
|
|
|
|
|
|
|
|
|
|
|
|
|
|
|
|
|
|
ng/L |
|
|
2 |
<CCRDL |
|
<CCRDL |
|
<CCRDL |
NA |
|
NA |
|
NA |
<CCRDL |
|
<CCRDL |
<CCRDL |
<CCRDL |
|
<CCRDL |
<CCRDL |
<CCRDL |
|
<CCRDL |
<CCRDL |
<CCRDL |
|
<CCRDL |
<CCRDL |
NA |
|
NA |
NA |
NA |
|
NA |
NA |
NA |
|
NA |
|
NA |
|
|
|
|
|
|
|
|
|
|
|
|
|
|
|
|
|
|
|
|
|
|
|
|
|
|
|
|
|
|
|
|
|
|
|
|
|
|
|
|
|
|
|
|
|
Perfluoroheptanoic Acid (PFHpA) |
ng/L |
|
|
4 |
<CCRDL |
|
<CCRDL |
|
<CCRDL |
NA |
|
NA |
|
NA |
<CCRDL |
|
9.2 |
<CCRDL |
<CCRDL |
|
13.0 |
3.6 |
<CCRDL |
|
<CCRDL |
<CCRDL |
<CCRDL |
|
<CCRDL |
<CCRDL |
NA |
|
NA |
NA |
NA |
|
NA |
NA |
NA |
|
NA |
|
NA |
|
|
|
|
|
|
|
|
|
|
|
|
|
|
|
|
|
|
|
|
|
|
|
|
|
|
|
|
|
|
|
|
|
|
|
|
|
|
|
|
|
|
|
|
ng/L |
|
|
4 |
<CCRDL |
|
<CCRDL |
|
<CCRDL |
NA |
|
NA |
|
NA |
<CCRDL |
|
<CCRDL |
<CCRDL |
<CCRDL |
|
<CCRDL |
<CCRDL |
<CCRDL |
|
<CCRDL |
<CCRDL |
<CCRDL |
|
<CCRDL |
<CCRDL |
NA |
|
NA |
NA |
NA |
|
NA |
NA |
NA |
|
NA |
|
NA |
|
|
|
|
|
|
|
|
|
|
|
|
|
|
|
|
|
|
|
|
|
|
|
|
|
|
|
|
|
|
|
|
|
|
|
|
|
|
|
|
|
|
|
|
|
Perfluorododecanoic Acid (PFDoA) |
ng/L |
|
|
4 |
<CCRDL |
|
<CCRDL |
|
<CCRDL |
NA |
|
NA |
|
NA |
<CCRDL |
|
<CCRDL |
<CCRDL |
<CCRDL |
|
<CCRDL |
<CCRDL |
<CCRDL |
|
<CCRDL |
<CCRDL |
<CCRDL |
|
<CCRDL |
<CCRDL |
NA |
|
NA |
NA |
NA |
|
NA |
NA |
NA |
|
NA |
|
NA |
|
|
|
|
|
|
|
|
|
|
|
|
|
|
|
|
|
|
|
|
|
|
|
|
|
|
|
|
|
|
|
|
|
|
|
|
|
|
|
|
|
|
|
|
Perfluorotridecanoic Acid (PFTrDA) |
ng/L |
|
|
4 |
<CCRDL |
|
<CCRDL |
|
<CCRDL |
NA |
|
NA |
|
NA |
<CCRDL |
|
<CCRDL |
<CCRDL |
<CCRDL |
|
<CCRDL |
<CCRDL |
<CCRDL |
|
<CCRDL |
<CCRDL |
<CCRDL |
|
<CCRDL |
<CCRDL |
NA |
|
NA |
NA |
NA |
|
NA |
NA |
NA |
|
NA |
|
NA |
|
|
|
|
|
|
|
|
|
|
|
|
|
|
|
|
|
|
|
|
|
|
|
|
|
|
|
|
|
|
|
|
|
|
|
|
|
|
|
|
|
|
|
|
ng/L |
|
|
2 |
<CCRDL |
|
<CCRDL |
|
<CCRDL |
NA |
|
NA |
|
NA |
<CCRDL |
|
<CCRDL |
<CCRDL |
<CCRDL |
|
<CCRDL |
<CCRDL |
<CCRDL |
|
<CCRDL |
<CCRDL |
<CCRDL |
|
<CCRDL |
<CCRDL |
NA |
|
NA |
NA |
NA |
|
NA |
NA |
NA |
|
NA |
|
NA |
|
|
|
|
|
|
|
|
|
|
|
|
|
|
|
|
|
|
|
|
|
|
|
|
|
|
|
|
|
|
|
|
|
|
|
|
|
|
|
|
|
|
|
|
|
Perfluorooctane Sulfonic Acid (PFOS) |
ng/L |
6.5 |
40 |
4 |
<CCRDL |
|
<CCRDL |
|
<CCRDL |
NA |
|
NA |
|
NA |
<CCRDL |
|
18.0 |
7.5 |
<CCRDL |
|
25.0 |
5.8 |
<CCRDL |
|
5.7 |
<CCRDL |
<CCRDL |
|
4.3 |
<CCRDL |
NA |
|
NA |
NA |
NA |
|
NA |
NA |
NA |
|
NA |
|
NA |
|
|
|
|
|
|
|
|
|
|
|
|
|
|
|
|
|
|
|
|
|
|
|
|
|
|
|
|
|
|
|
|
|
|
|
|
|
|
|
|
|
|
|
|
Perfluorooctane Sulfonic Acid (PFHxS) |
ng/L |
|
|
4 |
<CCRDL |
|
4.6 |
|
<CCRDL |
NA |
|
NA |
|
NA |
<CCRDL |
|
12.0 |
5.5 |
<CCRDL |
|
21.0 |
6.1 |
<CCRDL |
|
<CCRDL |
<CCRDL |
<CCRDL |
|
32.0 |
11.5 |
NA |
|
NA |
NA |
NA |
|
NA |
NA |
NA |
|
NA |
|
NA |
|
|
|
|
|
|
|
|
|
|
|
|
|
|
|
|
|
|
|
|
|
|
|
|
|
|
|
|
|
|
|
|
|
|
|
|
|
|
|
|
|
|
|
|
ng/L |
|
|
4 |
<CCRDL |
|
<CCRDL |
|
<CCRDL |
NA |
|
NA |
|
NA |
<CCRDL |
|
<CCRDL |
<CCRDL |
<CCRDL |
|
<CCRDL |
<CCRDL |
<CCRDL |
|
<CCRDL |
<CCRDL |
<CCRDL |
|
<CCRDL |
<CCRDL |
NA |
|
NA |
NA |
NA |
|
NA |
NA |
NA |
|
NA |
|
NA |
|
|
|
|
|
|
|
|
|
|
|
|
|
|
|
|
|
|
|
|
|
|
|
|
|
|
|
|
|
|
|
|
|
|
|
|
|
|
|
|
|
|
|
|
|
Perfluorohexanoic Acid (PFHxA) |
ng/L |
|
|
4 |
<CCRDL |
|
<CCRDL |
|
<CCRDL |
NA |
|
NA |
|
NA |
<CCRDL |
|
24.0 |
4.9 |
<CCRDL |
|
39.0 |
8.5 |
<CCRDL |
|
<CCRDL |
<CCRDL |
<CCRDL |
|
6.6 |
<CCRDL |
NA |
|
NA |
NA |
NA |
|
NA |
NA |
NA |
|
NA |
|
NA |
|
|
|
|
|
|
|
|
|
|
|
|
|
|
|
|
|
|
|
|
|
|
|
|
|
|
|
|
|
|
|
|
|
|
|
|
|
|
|
|
|
|
|
|
Perfluoroundecanoic Acid (PFUnA) |
ng/L |
|
|
4 |
<CCRDL |
|
<CCRDL |
|
<CCRDL |
NA |
|
NA |
|
NA |
<CCRDL |
|
<CCRDL |
<CCRDL |
<CCRDL |
|
<CCRDL |
<CCRDL |
<CCRDL |
|
<CCRDL |
<CCRDL |
<CCRDL |
|
<CCRDL |
<CCRDL |
NA |
|
NA |
NA |
NA |
|
NA |
NA |
NA |
|
NA |
|
NA |
|
|
|
|
|
|
|
|
|
|
|
|
|
|
|
|
|
|
|
|
|
|
|
|
|
|
|
|
|
|
|
|
|
|
|
|
|
|
|
|
|
|
|
|
ng/L |
|
|
2 |
<CCRDL |
|
<CCRDL |
|
<CCRDL |
NA |
|
NA |
|
NA |
<CCRDL |
|
<CCRDL |
<CCRDL |
<CCRDL |
|
<CCRDL |
<CCRDL |
<CCRDL |
|
<CCRDL |
<CCRDL |
<CCRDL |
|
<CCRDL |
<CCRDL |
NA |
|
NA |
NA |
NA |
|
NA |
NA |
NA |
|
NA |
|
NA |
|
Perfluorooctanoic Acid (PFOA) |
ng/L |
5.1 |
10 |
4 |
<CCRDL |
|
<CCRDL |
|
<CCRDL |
NA |
|
NA |
|
NA |
<CCRDL |
|
26.0 |
6.0 |
<CCRDL |
|
31.0 |
9.4 |
<CCRDL |
|
<CCRDL |
<CCRDL |
<CCRDL |
|
4.7 |
<CCRDL |
NA |
|
NA |
NA |
NA |
|
NA |
NA |
NA |
|
NA |
|
NA |
|
|
|
|
|
|
|
|
|
|
|
|
|
|
|
|
|
|
|
|
|
|
|
|
|
|
|
|
|
|
|
|
|
|
|
|
|
|
|
|
|
|
|
|
RADIOLOGICAL TESTS
Radioactive compounds can be found in both ground and surface waters and can be naturally occurring or be the result of oil and gas production and mining activities. Testing is conducted for two types of radioactivity: alpha and beta. If none is detected at concentrations above five picoCuries per liter (pCi/eed. If it is detected
above ter must be checed for uranium and/or radium. or radionuclides can be different for each groundwater well. of thisnot all data may be from the
.
WATER QUALITY DEFINITIONS e vulnerable to contaminants
in drinter than the general population. Immuno compromised persons such as persons with cancer undergoing chemotherapyve undergone
organ transplants
system disordersfants can be particularly
at risom infections. These people should see drinter from their health care providers. The Centers for ol (Copriate
means to lessen the risf infection by Cryptosporidium
and other microbial contaminants and are available from the ’s fe ater
ornia onmental otection ds for the
of drinter. These standards are intended to protect consumers from contaminants in drinter. f the standards are based on the concentration of contaminants but a few are based on a Treatment TechniTTeed process intended to reduce the level of a contaminant in drinter. terter
reasonably be et least small amounts of
some contaminants. The presence of contaminants does not
necessarily indicate that water poses a health rise information about contaminants and potential health effects can be obtained by calling the ’s fe ater
Maximum Contaminant Level (MCL): The highest level of a contaminant that is allowed in drinter.
are set as close to the
technologically feasible. e set to protect the odorf drinter.
Maximum Contaminant Level Goal (MCLG) or Public Health Goal (PHG : The level of a contaminant in drinter below which
there is no e set by Cal/ e set by the
Primary Drinking Water Standard (PDWS): or
contaminants that affect health along with their monitoring and reporting reementster treatment reements.
Maximum Residual Disinfectant Level (MRDL): The highest level of a disinfectant allowed in drinter. There is convincing evidence that addition of a disinfectant is necessary for control of microbial contaminants.
Maximum Residual Disinfectant Level Goal (MRDLG): The level of a drinter disinfectant below which there is no
eeflect the benefits of the
use of disinfectants to control microbial contaminants.
Detection Limit for Purposes of Reporting (DLR): The smallest concentration of a contaminant that can be measured and reported. e set by the
Reporting
Consumer Confidence Report Detection Level (CCRDL): The smallest concentration of a contaminant that can be measured and reportedtion changes in analytical methods.
Regulatory Action Level (AL): The concentration of a contaminant which, if exceeded, triggers treatment or other requirements that a water system must follow.
Notification Level (NL): State guidelines developed by DDW that address the concentration of a contaminant which, if exceeded, triggers public notification.
Response Level (RL): If a chemical is present in drinking water that is provided to consumers at concentrations considerably greater than the notification level, DDW recommends that the drinking water system take the source out of service.
DISINFECTION
SCV Water - Imported Division uses ozone and chloramine to disinfect its water while the water divisions use various forms of chlorine and chloramine to disinfect their groundwater sources. Disinfection
Treatment Technique (TT): A required process intended to reduce the level of a contaminant in drinking water.
Primary Drinking Water Contaminants: Contaminants associated with the protection of public health and that have enforceable standards.
Secondary Drinking Water Contaminants: Contaminants associated with aesthetic considerations such as taste, color and odor, and that have
UNREGULATED CONTAMINANT MONITORING RULE The USEPA requires utilities to sample for emerging contaminates as part of the Unregulated Contaminant Monitoring Rule (UCMR). Every five (5) years the USEPA prepares a list of unregulated contaminants for drinking water suppliers to analyze. UCMR results are then used to assist in the development of future drinking water regulations. We recently completed the fourth round of UCMR sampling (UCMR 4) between
8 | SCV WATER |
SCVSCV WWATERATER || 99 |
PARAMETERS/ |
|
MCL |
PHG |
DLR |
SANTA CLARITA VALLEY WATER AGENCY |
IMPORT DIVISION |
|
SANTA CLARITA VALLEY WATER AGENCY |
SANTA CLARITA VALLEY WATER AGENCY |
SANTA CLARITA VALLEY WATER AGENCY |
SANTA CLARITA VALLEY WATER AGENCY |
SANTA CLARITA VALLEY WATER AGENCY |
SANTA CLARITA VALLEY WATER AGENCY |
|
LOS ANGELES COUNTY |
|
|
||||||||||||||||||||||||||
|
(AL) |
|
IMPORT DIVISION |
|
|
NEWHALL WATER DIVISION |
NEWHALL WATER DIVISION |
NEWHALL WATER DIVISION |
NEWHALL WATER DIVISION |
|
WATERWORKS DISTRICT |
|
|
||||||||||||||||||||||||||||||
CONSTITUENTS |
UNITS |
(MCLG) |
(MRL) |
|
|
PERCHLORATE TREATMENT PLANT |
SANTA CLARITA WATER DIVISION |
VALENCIA WATER DIVISION |
|
|
|
||||||||||||||||||||||||||||||||
(RL) |
(% GROUNDWATER AND % SURFACE WATER) |
|
|
CASTAIC |
|
|
|
NEWHALL |
|
|
|
PINETREE1 |
|
|
|
TESORO1 |
|
|
#36 |
|
|
|
|||||||||||||||||||||
|
|
|
|
|
|
|
|
|
|
|
|
|
|
|
|
|
|
|
|
|
|
|
|
|
|
|
|
|
|
|
|
||||||||||||
|
|
|
|
|
|
RANGE |
|
|
RANGE |
|
|
TYPICAL |
RANGE |
|
|
|
RANGE |
|
|
RANGE |
|
|
RANGE |
|
|
RANGE |
|
|
RANGE |
|
|
RANGE |
|
|
|
||||||||
INORGANICS |
|
|
|
|
|
|
|
|
TYPICAL |
|
|
|
|
|
|
|
TYPICAL |
|
|
|
TYPICAL |
|
|
|
TYPICAL |
|
|
|
TYPICAL |
|
|
|
TYPICAL |
|
|
|
TYPICAL |
|
|
|
|
TYPICAL |
|
|
|
|
|
|
MINIMUM |
|
MAXIMUM |
|
|
MINIMUM |
|
MAXIMUM |
|
|
MINIMUM |
MAXIMUM |
|
MINIMUM |
|
MAXIMUM |
|
MINIMUM |
|
MAXIMUM |
|
MINIMUM |
|
MAXIMUM |
|
MINIMUM |
|
MAXIMUM |
|
MINIMUM |
|
MAXIMUM |
|
MINIMUM |
|
MAXIMUM |
|
|
|
Aluminum |
MG/L |
1 |
0.6 |
0.05 |
<DLR |
|
<DLR |
|
<DLR |
<DLR |
|
<DLR |
|
<DLR |
<DLR |
0.2 |
<DLR |
<DLR |
|
<DLR |
<DLR |
<DLR |
|
<DLR |
<DLR |
<DLR |
|
<DLR |
<DLR |
NA |
|
NA |
NA |
NA |
|
NA |
NA |
<DLR |
|
<DLR |
|
<DLR |
|
|
|
|
|
|
|
|
|
|
|
|
|
|
|
|
|
|
|
|
|
|
|
|
|
|
|
|
|
|
|
|
|
|
|
|
|
|
|
|
|
|
|
|
|
Arsenic |
UG/L |
10 |
0.004 |
2 |
<DLR |
|
<DLR |
|
<DLR |
<DLR |
|
<DLR |
|
<DLR |
<DLR |
2.3 |
<DLR |
<DLR |
|
<DLR |
<DLR |
<DLR |
|
<DLR |
<DLR |
<DLR |
|
<DLR |
<DLR |
NA |
|
NA |
NA |
NA |
|
NA |
NA |
<DLR |
|
<DLR |
|
<DLR |
|
|
|
|
|
|
|
|
|
|
|
|
|
|
|
|
|
|
|
|
|
|
|
|
|
|
|
|
|
|
|
|
|
|
|
|
|
|
|
|
|
|
|
|
|
Fluoride2 |
MG/L |
2 |
1 |
0.1 |
0.1 |
|
0.2 |
|
0.2 |
0.1 |
|
0.3 |
|
0.2 |
0.3 |
0.6 |
0.4 |
0.2 |
|
0.9 |
0.6 |
0.5 |
|
0.5 |
0.5 |
0.3 |
|
0.4 |
0.4 |
NA |
|
NA |
NA |
NA |
|
NA |
NA |
<DLR |
|
<DLR |
|
<DLR |
|
Barium |
MG/L |
1 |
2 |
0.1 |
<DLR |
|
<DLR |
|
<DLR |
<DLR |
|
<DLR |
|
<DLR |
<DLR |
0.1 |
0.1 |
<DLR |
|
0.1 |
<DLR |
<DLR |
|
<DLR |
<DLR |
<DLR |
|
<DLR |
<DLR |
NA |
|
NA |
NA |
NA |
|
NA |
NA |
<DLR |
|
<DLR |
|
<DLR |
|
|
|
|
|
|
|
|
|
|
|
|
|
|
|
|
|
|
|
|
|
|
|
|
|
|
|
|
|
|
|
|
|
|
|
|
|
|
|
|
|
|
|
|
|
Nitrate (as Nitrogen) |
MG/L |
10 |
10 |
0.4 |
<DLR |
|
<DLR |
|
<DLR |
3.4 |
|
4.1 |
|
3.7 |
3.3 |
7.5 |
4.7 |
1.6 |
|
6.0 |
3.1 |
<DLR |
|
<DLR |
<DLR |
2.5 |
|
7.2 |
4.9 |
NA |
|
NA |
NA |
NA |
|
NA |
NA |
1.9 |
|
1.9 |
|
1.9 |
|
ORGANICS |
|
|
|
|
|
|
|
|
|
|
|
|
|
|
|
|
|
|
|
|
|
|
|
|
|
|
|
|
|
|
|
|
|
|
|
|
|
|
|
|
|
|
|
|
|
|
|
|
|
|
|
|
|
|
|
|
|
|
|
|
|
|
|
|
|
|
|
|
|
|
|
|
|
|
|
|
|
|
|
|
|
|
|
|
|
|
|
Trichloroethylene (TCE) |
UG/L |
5 |
1.7 |
0.5 |
<DLR |
|
0.6 |
|
<DLR |
NA |
|
NA |
|
NA |
<DLR |
<DLR |
<DLR |
<DLR |
|
<DLR |
<DLR |
<DLR |
|
<DLR |
<DLR |
<DLR |
|
<DLR |
<DLR |
NA |
|
NA |
NA |
NA |
|
NA |
NA |
<DLR |
|
<DLR |
|
<DLR |
|
|
|
|
|
|
|
|
|
|
|
|
|
|
|
|
|
|
|
|
|
|
|
|
|
|
|
|
|
|
|
|
|
|
|
|
|
|
|
|
|
|
|
|
|
Tetrachloroethylene (PCE) |
UG/L |
5 |
0.06 |
0.5 |
<DLR |
|
0.9 |
|
<DLR |
NA |
|
NA |
|
NA |
<DLR |
<DLR |
<DLR |
<DLR |
|
<DLR |
<DLR |
<DLR |
|
<DLR |
<DLR |
<DLR |
|
<DLR |
<DLR |
NA |
|
NA |
NA |
NA |
|
NA |
NA |
<DLR |
|
<DLR |
|
<DLR |
|
DISINFECTION |
|
|
|
|
|
|
|
|
|
|
|
|
|
|
|
|
|
|
|
|
|
|
|
|
|
|
|
|
|
|
|
|
|
|
|
|
|
|
|
|
|
|
|
|
|
|
|
|
|
|
|
|
|
|
|
|
|
|
|
|
|
|
|
|
|
|
|
|
|
|
|
|
|
|
|
|
|
|
|
|
|
|
|
|
|
|
|
Bromate RVWTP |
UG/L |
10 |
0.1 |
5 |
<DLR |
|
5.4 |
|
4.0 |
NA |
|
NA |
|
NA |
NA |
NA |
NA |
NA |
|
NA |
NA |
NA |
|
NA |
NA |
NA |
|
NA |
NA |
NA |
|
NA |
NA |
NA |
|
NA |
NA |
NA |
|
NA |
|
NA |
|
|
|
|
|
|
|
|
|
|
|
|
|
|
|
|
|
|
|
|
|
|
|
|
|
|
|
|
|
|
|
|
|
|
|
|
|
|
|
|
|
|
|
|
|
Bromate ESFP |
UG/L |
10 |
0.1 |
5 |
<DLR |
|
2.9 |
|
2.6 |
NA |
|
NA |
|
NA |
NA |
NA |
NA |
NA |
|
NA |
NA |
NA |
|
NA |
NA |
NA |
|
NA |
NA |
NA |
|
NA |
NA |
NA |
|
NA |
NA |
NA |
|
NA |
|
NA |
|
|
|
|
|
|
|
|
|
|
|
|
|
|
|
|
|
|
|
|
|
|
|
|
|
|
|
|
|
|
|
|
|
|
|
|
|
|
|
|
|
|
|
|
|
Haloacetic Acids (HAA5) |
UG/L |
60 |
.(0) |
1.0 |
<DLR |
|
8.9 |
|
5.0 |
NA |
|
NA |
|
NA |
<DLR |
9.8 |
5.3 |
<DLR |
|
9.3 |
5.5 |
0.0 |
|
5.5 |
2.4 |
<DLR |
|
7.0 |
1.5 |
4.1 |
|
7.9 |
6.0 |
6.1 |
|
12.0 |
8.2 |
<DLR |
|
<DLR |
|
<DLR |
|
|
|
|
|
|
|
|
|
|
|
|
|
|
|
|
|
|
|
|
|
|
|
|
|
|
|
|
|
|
|
|
|
|
|
|
|
|
|
|
|
|
|
|
|
Trihalomethanes, Total (TTHMs) |
UG/L |
80 |
.(0) |
1.0 |
8.5 |
|
47.0 |
|
20.0 |
NA |
|
NA |
|
NA |
10.0 |
47.0 |
19.2 |
7.7 |
|
49.0 |
26.3 |
5.5 |
|
12.0 |
8.9 |
<DLR |
|
21.0 |
5.4 |
14.0 |
|
28.0 |
18.5 |
19.0 |
|
47.0 |
32.3 |
5.2 |
|
9.1 |
|
6.6 |
|
|
|
|
|
|
|
|
|
|
|
|
|
|
|
|
|
|
|
|
|
|
|
|
|
|
|
|
|
|
|
|
|
|
|
|
|
|
|
|
|
|
|
|
|
MICROBIOLOGICAL
Coliform % Positive Samples / # of Positives |
% |
5 |
0 |
|
|
|
|
CLARITY / TURBIDITY
0
0
0
NA
NA
NA
0
1
0
0
2
0 |
0 |
0 |
0 |
0 |
0 |
0 |
|
|
|
|
|
|
|
0
1
0
0 |
0 |
0 |
0 |
0 |
0 |
|
|
|
|
|
|
Surface Water Only RVWTP |
NTU |
TT = 1 NTU |
|
NONE |
|
|
|
|
|
|
|
|
|
TT = 95% OF SAMPLES |
< 0.2 NTU |
|
|
|
|
|
|
|
|
Surface Water Only ESFP |
NTU |
TT = 1 NTU |
|
NONE |
|
|
|
|
|
|
|
|
|
TT = 95% OF SAMPLES |
< 0.2 NTU |
|
|
|
|
|
|
|
|
RADIOLOGICAL |
|
|
|
|
|
|
|
|
|
|
|
Alpha Activity, Gross |
PCI/L |
15 |
|
(0) |
3 |
|
|
|
|
|
|
Beta Activity, Gross |
PCI/L |
50* |
|
(0) |
3 |
|
|
|
|
|
|
Radium 228 |
PCI/L |
|
0.019 |
1 |
|
|
|
|
|
|
|
Uranium |
PCI/L |
20 |
|
0.43 |
1 |
|
|
|
|
|
|
Year of Analysis |
|
|
|
|
|
NA |
0.35 |
NA |
|
|
|
100 |
NA |
NA |
|
|
|
NA |
0.31 |
NA |
|
|
|
100 |
NA |
NA |
|
|
|
|
|
|
<DLR |
<DLR |
<DLR |
|
|
|
<DLR |
3.5 |
<DLR |
|
|
|
<DLR |
<DLR |
<DLR |
|
|
|
<DLR |
1.2 |
<DLR |
|
|
|
|
2020 |
|
NA |
NA |
NA |
|
|
|
NA |
NA |
NA |
|
|
|
NA |
NA |
NA |
|
|
|
NA |
NA |
NA |
|
|
|
|
|
|
<DLR |
<DLR |
<DLR |
|
|
|
<DLR |
3.3 |
<DLR |
|
|
|
<DLR |
<DLR |
<DLR |
|
|
|
<DLR |
2.2 |
<DLR |
|
|
|
|
2020 |
|
NA |
NA |
NA |
|
|
|
NA |
NA |
NA |
|
|
|
NA |
NA |
NA |
|
|
|
NA |
NA |
NA |
|
|
|
|
|
|
<DLR |
7.1 |
3.6 |
|
|
|
NA |
NA |
NA |
|
|
|
<DLR |
<DLR |
<DLR |
|
|
|
4.4 |
4.4 |
4.4 |
|
|
|
|
2020 |
|
NA |
NA |
NA |
|
|
|
NA |
NA |
NA |
|
|
|
NA |
NA |
NA |
|
|
|
NA |
NA |
NA |
|
|
|
|
|
|
<DLR |
7.5 |
<DLR |
|
|
|
3.8 |
5.0 |
4.4 |
|
|
|
<DLR |
<DLR |
<DLR |
|
|
|
3.1 |
3.5 |
3.3 |
|
|
|
|
2020 |
|
NA |
NA |
NA |
|
|
|
NA |
NA |
NA |
|
|
|
NA |
NA |
NA |
|
|
|
NA |
NA |
NA |
|
|
|
|
|
|
NA |
NA |
NA |
|
|
|
NA |
NA |
NA |
|
|
|
<DLR |
<DLR |
<DLR |
|
|
|
<DLR |
1.2 |
1.1 |
|
|
|
|
|
NA |
NA |
NA |
|
|
|
NA |
NA |
NA |
|
|
|
NA |
NA |
NA |
|
|
|
NA |
NA |
NA |
|
|
|
|
|
|
4.4 |
4.7 |
4.6 |
|
|
|
NA |
NA |
NA |
|
|
|
<DLR |
<DLR |
<DLR |
|
|
|
<DLR |
2.7 |
1.2 |
|
|
|
|
2015 - 2018 |
|
NA |
NA |
NA |
|
|
|
NA |
NA |
NA |
|
|
|
NA |
NA |
NA |
|
|
|
NA |
NA |
NA |
|
|
|
|
|
|
5 |
11 |
8 |
|
|
|
4.5 |
5.7 |
5.1 |
|
|
|
<DLR |
<DLR |
<DLR |
|
|
|
2.4 |
9.3 |
6.7 |
|
|
|
|
2019 |
|
NA |
NA |
NA |
|
|
|
NA |
NA |
NA |
|
|
|
NA |
NA |
NA |
|
|
|
NA |
NA |
NA |
|
|
|
|
|
|
NA |
NA |
NA |
|
|
|
NA |
NA |
NA |
|
|
|
NA |
NA |
NA |
|
|
|
NA |
NA |
NA |
|
|
|
NA |
NA |
NA |
|
|
|
NA |
NA |
NA |
|
|
|
NA |
NA |
NA |
|
|
|
NA |
NA |
NA |
|
|
|
|
|
|
<DLR |
<DLR |
<DLR |
|
|
|
<DLR |
<DLR |
<DLR |
|
|
|
<DLR |
<DLR |
<DLR |
|
|
|
<DLR |
<DLR |
<DLR |
|
|
|
|
2019 |
|
LEAD AND COPPER
Copper - Consumer Taps |
UG/L |
(1300) |
300 |
50 |
|
|
|
|
|
Lead - Consumer Taps |
UG/L |
(15) |
0.2 |
5 |
|
|
|
|
|
Year of Analysis |
|
|
|
|
NA |
NA |
NA |
|
|
|
NA |
NA |
NA |
|
|
|
NA |
NA |
NA |
|
|
|
NA |
NA |
NA |
|
|
|
NA |
NA |
NA |
|
|
|
NA |
NA |
NA |
|
|
|
90TH |
NO. OF |
NO. OF SITES |
90TH |
NO. OF SITES |
NO. OF SITES |
90TH |
NO. OF SITES |
NO. OF SITES |
90TH |
NO. OF SITES |
NO. OF SITES |
90TH |
NO. OF SITES |
NO. OF SITES |
90TH |
NO. OF SITES |
NO. OF SITES |
90TH |
NO. OF SITES |
NO. OF SITES |
PERCENTILE |
SITES TESTED |
ABOVE THE AL |
PERCENTILE |
TESTED |
ABOVE THE AL |
PERCENTILE |
TESTED |
ABOVE THE AL |
PERCENTILE |
TESTED |
ABOVE THE AL |
PERCENTILE |
TESTED |
ABOVE THE AL |
PERCENTILE |
TESTED |
ABOVE THE AL |
PERCENTILE |
TESTED |
ABOVE THE AL |
400 |
50 |
0 |
270 |
50 |
0 |
220 |
20 |
0 |
500 |
30 |
1 |
340 |
21 |
0 |
200 |
20 |
0 |
180 |
23 |
0 |
|
|
|
|
|
|
|
|
|
|
|
|
|
|
|
|
|
|
|
|
|
5.6 |
50 |
1 |
<DLR |
50 |
0 |
<DLR |
20 |
0 |
12 |
30 |
2 |
<DLR |
21 |
1 |
<DLR |
20 |
0 |
0.7 |
23 |
0 |
|
|
|
|
|
|
|
|
|
|
|
|
|
|
|
|
|
|
|
|
|
|
2018 |
|
|
2019 |
|
|
2018 |
|
|
2018 |
|
|
2018 |
|
|
2020 |
|
|
2020 |
|
|
|
|
|
|
|
|
|
|
|
|
|
|
|
|
|
|
|
|
|
|
|
|
|
|
|
|
|
|
|
|
|
|
|
|
|
|
|
|
|
|
|
|
|
|
|
|
|
|
|
|
|
|
|
|
|
|
|
|
|
|
|
|
|
SECONDARY STANDARDS |
|
|
|
|
|
RANGE |
|
|
RANGE |
|
|
RANGE |
|
|
RANGE |
|
|
RANGE |
|
|
RANGE |
|
|
RANGE |
|
|
RANGE |
|
|
RANGE |
|
|||||||||
|
|
|
|
|
|
|
|
TYPICAL |
|
|
|
TYPICAL |
|
|
|
TYPICAL |
|
|
|
TYPICAL |
|
|
|
TYPICAL |
|
|
|
TYPICAL |
|
|
|
TYPICAL |
|
|
|
TYPICAL |
|
|
|
TYPICAL |
|
|
|
|
|
|
MINIMUM |
|
MAXIMUM |
MINIMUM |
|
MAXIMUM |
MINIMUM |
|
MAXIMUM |
MINIMUM |
|
MAXIMUM |
MINIMUM |
|
MAXIMUM |
MINIMUM |
|
MAXIMUM |
MINIMUM |
|
MAXIMUM |
MINIMUM |
|
MAXIMUM |
MINIMUM |
|
MAXIMUM |
||||||||||
|
|
|
|
|
|
|
|
|
|
|
|
|
|
|
|
|
|
|
|
|
|
|
|
||||||||||||||||||
|
Chloride³ |
MG/L |
250/500/600 |
|
|
50 |
|
58 |
52 |
40 |
|
49 |
42 |
67 |
|
140 |
97 |
32 |
|
120 |
83 |
74 |
|
79 |
76 |
45 |
|
49 |
47 |
NA |
|
NA |
NA |
NA |
|
NA |
NA |
16 |
|
16 |
16 |
|
|
|
|
|
|
|
|
|
|
|
|
|
|
|
|
|
|
|
|
|
|
|
|
|
|
|
|
|
|
|
|
|
|
|
|
|
|
|
|
|
|
|
Color |
UNITS |
15 |
|
5 |
<DLR |
|
<DLR |
<DLR |
<DLR |
|
<DLR |
<DLR |
<DLR |
|
<DLR |
<DLR |
<DLR |
|
<DLR |
<DLR |
<DLR |
|
<DLR |
<DLR |
<DLR |
|
<DLR |
<DLR |
NA |
|
NA |
NA |
NA |
|
NA |
NA |
<DLR |
|
<DLR |
<DLR |
|
|
|
|
|
|
|
|
|
|
|
|
|
|
|
|
|
|
|
|
|
|
|
|
|
|
|
|
|
|
|
|
|
|
|
|
|
|
|
|
|
|
|
TON |
3 |
|
1 |
1 |
|
1 |
1 |
1 |
|
1 |
1 |
1 |
|
1 |
1 |
1 |
|
1 |
1 |
1 |
|
1 |
1 |
1 |
|
1 |
1 |
NA |
|
NA |
NA |
NA |
|
NA |
NA |
<5 |
|
3 |
<5 |
|
|
|
|
|
|
|
|
|
|
|
|
|
|
|
|
|
|
|
|
|
|
|
|
|
|
|
|
|
|
|
|
|
|
|
|
|
|
|
|
|
|
|
|
Sulfate³ |
MG/L |
250/500/600 |
|
1 |
44 |
|
53 |
49 |
150 |
|
180 |
160 |
100 |
|
210 |
148 |
68 |
|
460 |
244 |
77 |
|
97 |
86 |
200 |
|
250 |
225 |
NA |
|
NA |
NA |
NA |
|
NA |
NA |
83 |
|
83 |
83 |
|
|
|
|
|
|
|
|
|
|
|
|
|
|
|
|
|
|
|
|
|
|
|
|
|
|
|
|
|
|
|
|
|
|
|
|
|
|
|
|
|
|
|
Turbidity |
NTU |
5 |
|
0.1 |
0.1 |
|
0.1 |
0.1 |
0.1 |
|
0.1 |
0.1 |
<DLR |
|
6.0 |
1.0 |
0.1 |
|
0.7 |
0.4 |
<DLR |
|
0.2 |
<DLR |
0.2 |
|
0.2 |
0.2 |
NA |
|
NA |
NA |
NA |
|
NA |
NA |
0.3 |
|
1.3 |
0.6 |
|
|
|
|
|
|
|
|
|
|
|
|
|
|
|
|
|
|
|
|
|
|
|
|
|
|
|
|
|
|
|
|
|
|
|
|
|
|
|
|
|
|
|
"Total Dissolved Solids³" |
MG/L |
500/1000/1500 |
|
|
210 |
|
280 |
240 |
480 |
|
610 |
540 |
590 |
|
860 |
732 |
400 |
|
1000 |
754 |
370 |
|
450 |
413 |
580 |
|
750 |
665 |
NA |
|
NA |
NA |
NA |
|
NA |
NA |
300 |
|
300 |
300 |
|
|
|
|
|
|
|
|
|
|
|
|
|
|
|
|
|
|
|
|
|
|
|
|
|
|
|
|
|
|
|
|
|
|
|
|
|
|
|
|
|
|
|
Conductivity³ |
US / CM |
900/1600/2200 |
|
|
330 |
|
410 |
370 |
610 |
|
840 |
700 |
930 |
|
1300 |
1144 |
670 |
|
1500 |
1143 |
660 |
|
750 |
713 |
840 |
|
1100 |
970 |
NA |
|
NA |
NA |
NA |
|
NA |
NA |
410 |
|
410 |
410 |
|
|
|
|
|
|
|
|
|
|
|
|
|
|
|
|
|
|
|
|
|
|
|
|
|
|
|
|
|
|
|
|
|
|
|
|
|
|
|
|
|
|
|
Manganese |
UG/L |
50 |
|
20 |
<DLR |
|
<DLR |
<DLR |
<DLR |
|
<DLR |
<DLR |
<DLR |
|
<DLR |
<DLR |
<DLR |
|
<DLR |
<DLR |
<DLR |
|
<DLR |
<DLR |
<DLR |
|
<DLR |
<DLR |
NA |
|
NA |
NA |
NA |
|
NA |
NA |
<DLR |
|
<DLR |
<DLR |
|
|
|
|
|
|
|
|
|
|
|
|
|
|
|
|
|
|
|
|
|
|
|
|
|
|
|
|
|
|
|
|
|
|
|
|
|
|
|
|
|
|
|
Iron |
UG/L |
300 |
|
10 |
<DLR |
|
<DLR |
<DLR |
<DLR |
|
<DLR |
<DLR |
<DLR |
|
1200 |
111 |
<DLR |
|
140 |
30 |
<DLR |
|
<DLR |
<DLR |
<DLR |
|
<DLR |
<DLR |
NA |
|
NA |
NA |
NA |
|
NA |
NA |
12 |
|
12 |
12 |
|
ADDITIONAL TESTS |
|
|
|
|
|
|
|
|
|
|
|
|
|
|
|
|
|
|
|
|
|
|
|
|
|
|
|
|
|
|
|
|
|
|
|
|
|
|
|
|
|
Chromium, hexavalent (CrVI)5 |
UG/L |
50 |
0.02 |
1 |
|
|
|
|
|
|
|
Year of Analysis (CrVI) |
|
N/A |
|
|
|
|
|
|
|
|
|
Boron4 |
MG/L |
|
|
0.1 |
|
Calcium |
MG/L |
|
|
|
|
|
|
|
|
|
|
Magnesium |
MG/L |
|
|
|
|
|
|
|
|
|
|
Perfluorooctanesulfonic acid (PFOS) |
NG/L |
40 |
|
2.0 |
|
|
|
|
|
|
|
Perfluorooctanoic acid (PFOA) |
NG/L |
10 |
|
2.0 |
|
|
|
|
|
|
|
Potassium |
MG/L |
|
|
|
|
|
|
|
|
|
|
Sodium |
MG/L |
|
|
|
|
|
|
|
|
|
|
Hardness as CaCO3 |
MG/L |
|
|
|
|
|
|
|
|
|
|
pH |
UNITS |
|
|
|
|
|
|
|
|
|
10 | SCV WATER |
|
|
|
|
|
|
Alkalinity as CaCO3 |
MG/L |
|
|
|
<DLR |
<DLR |
<DLR |
|
|
|
|
2020 |
|
|
|
|
0.15 |
0.18 |
0.17 |
|
|
|
26 |
32 |
29 |
|
|
|
11 |
13 |
12 |
|
|
|
<MRL |
<MRL |
<MRL |
|
|
|
<MRL |
<MRL |
<MRL |
|
|
|
2.6 |
2.8 |
2.7 |
|
|
|
43 |
50 |
47 |
|
|
|
110 |
130 |
120 |
|
|
|
7.7 |
8.5 |
8.2 |
|
|
|
73 |
87 |
80 |
|
|
|
<DLR |
1.2 |
<DLR |
|
|
|
|
2020 |
|
|
|
|
0.28 |
0.33 |
0.30 |
|
|
|
90 |
100 |
96 |
|
|
|
18 |
21 |
20 |
|
|
|
<MRL |
<MRL |
<MRL |
|
|
|
<MRL |
<MRL |
<MRL |
|
|
|
2.7 |
3.3 |
2.9 |
|
|
|
65 |
74 |
69 |
|
|
|
300 |
350 |
320 |
|
|
|
7.6 |
7.9 |
7.7 |
|
|
|
200 |
220 |
210 |
|
|
|
<DLR |
<DLR |
<DLR |
|
|
|
|
2017 |
|
|
|
|
0.5 |
1.4 |
0.9 |
|
|
|
84 |
140 |
109 |
|
|
|
20 |
51 |
30 |
|
|
|
<MRL |
18.0 |
8.1 |
|
|
|
<MRL |
26.0 |
7.1 |
|
|
|
2.2 |
5.5 |
3.8 |
|
|
|
88 |
130 |
105 |
|
|
|
290 |
490 |
396 |
|
|
|
7.4 |
7.8 |
7.5 |
|
|
|
290 |
340 |
314 |
|
|
|
<DLR |
<DLR |
<DLR |
|
|
|
|
2020 |
|
|
|
|
0.3 |
1.0 |
0.5 |
|
|
|
69 |
150 |
106 |
|
|
|
17 |
46 |
35 |
|
|
|
<MRL |
25.0 |
5.8 |
|
|
|
<MRL |
31.0 |
9.4 |
|
|
|
1.6 |
5.3 |
3.6 |
|
|
|
49 |
130 |
85 |
|
|
|
240 |
560 |
409 |
|
|
|
7.3 |
7.9 |
7.8 |
|
|
|
190 |
310 |
245 |
|
|
|
<DLR |
<DLR |
<DLR |
|
|
|
|
2018 |
|
|
|
|
0.2 |
0.3 |
0.2 |
|
|
|
40 |
52 |
48 |
|
|
|
16 |
20 |
18 |
|
|
|
<MRL |
5.2 |
2.0 |
|
|
|
<MRL |
<MRL |
<MRL |
|
|
|
2.8 |
3.1 |
3.0 |
|
|
|
63 |
71 |
67 |
|
|
|
160 |
210 |
190 |
|
|
|
8.1 |
8.2 |
8.1 |
|
|
|
140 |
180 |
163 |
|
|
|
<DLR |
1.6 |
1 |
|
|
|
|
2018 |
|
|
|
|
0.2 |
0.3 |
0.2 |
|
|
|
82 |
140 |
111 |
|
|
|
15 |
32 |
24 |
|
|
|
<MRL |
4.3 |
2.1 |
|
|
|
<MRL |
4.7 |
2.3 |
|
|
|
2.2 |
2.4 |
2.3 |
|
|
|
56 |
76 |
66 |
|
|
|
270 |
480 |
375 |
|
|
|
7.9 |
8.1 |
8.0 |
|
|
|
180 |
240 |
210 |
|
|
|
NA |
NA |
NA |
|
|
|
|
|
|
NA |
NA |
NA |
|
|
|
NA |
NA |
NA |
|
|
|
NA |
NA |
NA |
|
|
|
NA |
NA |
NA |
|
|
|
NA |
NA |
NA |
|
|
|
NA |
NA |
NA |
|
|
|
NA |
NA |
NA |
|
|
|
NA |
NA |
NA |
|
|
|
NA |
NA |
NA |
|
|
|
NA |
NA |
NA |
|
|
|
NA |
NA |
NA |
|
|
|
|
|
|
NA |
NA |
NA |
|
|
|
NA |
NA |
NA |
|
|
|
NA |
NA |
NA |
|
|
|
NA |
NA |
NA |
|
|
|
NA |
NA |
NA |
|
|
|
NA |
NA |
NA |
|
|
|
NA |
NA |
NA |
|
|
|
NA |
NA |
NA |
|
|
|
NA |
NA |
NA |
|
|
|
NA |
NA |
NA |
|
|
|
<DLR |
<DLR |
<DLR |
|
|
|
|
2019 |
|
|
|
|
NA |
NA |
NA |
|
|
|
27 |
27 |
27 |
|
|
|
5 |
5 |
5 |
|
|
|
NA |
NA |
NA |
|
|
|
NA |
NA |
NA |
|
|
|
2 |
2 |
2 |
|
|
|
71 |
71 |
71 |
|
|
|
86 |
86 |
86 |
|
|
|
7.3 |
7.9 |
7.6 |
|
|
|
160 |
160 |
160 |
|
|
|
|
|
|
LOS ANGELES COUNTY WATERWORKS DISTRICT |
|
|
|
NO. 36 (GOVERNED BY LOS ANGELES COUNTY |
|
|
|
BOARD OF SUPERVISORS) |
|
|
|
Bing Hua, P.E. | (626) |
|
|
|
bhua@dpw.lacounty.gov |
|
|
|
lacwaterworks.org |
|
|
|
Board of Supervisor Meetings |
|
|
|
Tuesdays at 9:30 a.m. (On Tuesdays following a Monday |
|
|
|
holiday, meetings begin at 1 p.m.) |
|
|
|
Kenneth Hahn Hall of Administration |
|
|
|
500 West Temple St., Room 381B |
|
|
|
Los Angeles, CA 90012 |
|
|
|
|
SANTA CLARITA VALLEY WATER AGENCY |
Board of Directors Meetings |
||
(SCV WATER) |
|
First and Third Tuesday of each month at 6:30 p.m. |
|
|
(Dates may vary. Visit www.yourSCVwater.com for |
||
|
|
|
|
Jeff Koelewyn |
Ryan Bye |
an |
|
(661) |
(661) |
Rio Vista Administration Building |
|
jkoelewyn@scvwa.org |
rbye@scvwa.org |
27234 Bouquet Canyon Road |
|
yourSCVwater.com |
|
Santa Clarita, CA 91350 |
|
DEVELOPING A
Our SCV Water team is hard at work developing strategies for
supplies and
But we need your help! We must all must do our part to save Mother Nature’s finest
resource: H20. We thank you for your continued stewardship of our water supply, and we’re committed to being a resource to our customers, so we can all work together to
reduce our water use.
Visit yourSCVwater.com for tips, tools and information on how you can be more
SCV WATER’S NEWHALL,
SANTA CLARITA AND
VALENCIA DIVISIONS
Customer Care
24631 Avenue Rockefeller
Valencia, CA 91355
Water Resources and Outreach
26501 Summit Circle
Santa Clarita, CA 91350
Connect with us on social media
Contaminants
Santa Clarita Water Division
EWG's drinking water quality report shows results of tests conducted by the water utility and provided to the Environmental Working Group by the California State Water Resources Control Board, as well as information from the U.S. EPA Enforcement and Compliance History database (ECHO). For the latest quarter assessed by the U.S. EPA (January 2019 - March 2019), tap water provided by this water utility was in compliance with federal health-based drinking water standards.
Utility details
- Serves: 120900
- Data available: 2012-2017
- Data Source: Purchased surface water
- Total: 25
Contaminants That Exceed Guidelines
- Bromodichloromethane
- Bromoform
- Chloroform
- Chromium (hexavalent)
- Dibromochloromethane
- Dichloroacetic acid
- Nitrate
- Nitrate and nitrite
- Total trihalomethanes (TTHMs)
- Uranium
Other Detected Contaminants
- Barium
- Bromochloroacetic acid
- Chlorate
- Chlorodifluoromethane
- Cobalt
- Dibromoacetic acid
- Fluoride
- Haloacetic acids (HAA5)
- Manganese
- Molybdenum
- Perfluoroheptanoic acid (PFHPA)
- Perfluorooctanoic acid (PFOA)
- Strontium
- Trichloroacetic acid
- Vanadium
Reminder
Always take extra precautions, the water may be safe to drink when it leaves the sewage treatment plant but it may pick up pollutants during its way to your tap. We advise that you ask locals or hotel staff about the water quality. Also, note that different cities have different water mineral contents.
Sources and Resources
Sources Cited
Additional Resources
Santa Clarita Tap Water
If you do not want to use filters, you can also use faucet mount or pitcher style filters, which effectively remove harmful chemicals from the water. However, these filter systems cannot remove dangerous parasites such as the Giardia living in raw water. If you buy faucet mount filters, you will have to add additional chemicals to the water to kill the parasites. This will increase your costs and is not worth it in my opinion. Therefore, I would recommend using a water filter cartridge instead of filters to get pure water.
Finally, if you want to be eco-friendly and save money at the same time, then you should look into purchasing a water purifier, which can clean up most of the harmful contaminants found in your tap water supply. You will need to spend some time and research to find a suitable unit for your home, but in the end, you will realize that it is well worth the investment. The cost of these units can vary greatly depending on the brand name and the features you choose. However, I have heard reports that the companies have performed as promised and saved users hundreds of dollars per year on their bottled water consumption.
After doing a little research on the internet, I was able to find a website that sells all of the equipment I was looking for, and the results are pretty impressive. I was amazed by how good some of the devices are, and they work exceptionally well at cleaning up the water in my home. Now I don’t have to wait until my next glass of drinking water, and I can enjoy the excellent taste instead.
Santa Clarita Water Division
Santa Clarita water is excellent, and it’s delivered to you all the time. The water is pumped into these underground aquifers, a vast collection of porous rock and soil rich in salt and other minerals that make water de-mineralized and taste bad. That’s why most towns use treated sewage to clean up their water. They’re not able to clean it all because the water table is so low. It just re-absorb what it can and then travels on. If we had better water quality everywhere, we would have none of these issues. But, in this country, that is not possible.
The water treatment plants add chemicals and human-made chlorides to disinfect the water. So, you don’t drink it, but the treatment plant puts it in bottles for you to drink, and when it rains, the water goes back out again. It’s kind of like letting the rainwater run around your house with the doors open. It won’t go in, so it just goes around.
The Santa Clarita water division noticed this and decided that they needed to do something about it. They formed a partnership with the county to build a desalination plant here. The plant uses salt, calcium, magnesium, potassium, and other elements to transform the water into steam. That steam is used to drive a turbine to create electricity at a power plant. The electricity is then used to heat homes and businesses.
Santa Clarita Drinking Water
Santa Clarita is an ideal place for a family vacation since it offers various activities for kids. You can even head to the beach if you stay at a hotel near the Pacific Ocean because several beaches are within a short driving distance. If you stay at a holiday inn in Santa Clarita, then the nearest beach is La Jolla Shores, about 25 miles from Santa Clarita. However, if you would rather not walk all that far, then you could choose to purchase a bottle of your favorite bottled water or even enjoy a tank of your swimming pool filled with warm filtered water in the cool of the evening.
While most people associate tap water with bacteria and contaminants, there have been quite a few incidents of harmful contaminants in tap water over the past several years. In one case, the pollutant responsible was benzene, which is a known carcinogen. Although this is an expensive stain to get rid of, if your home or business use contaminated water, then you could be putting your family at risk for cancer and many other life-threatening diseases. Therefore, it is much more cost-effective to purchase and use bottled water instead of tap water, especially in Santa Clarita, where local companies have treated their water to meet the California Department of Health’s drinking water regulations’ standards.
When it comes to deciding what type of bottled water to purchase, you will want to focus on getting the highest quality at the lowest price possible, so why not consider getting your water supply from Santa Clarita water filters? You will receive the cleanest water possible, along with the assurance that your family is getting the healthiest water possible from Santa Clarita’s excellent water supply. It doesn’t get any better than that!
Santa Clarita Water Quality Report
Santa Clarita is a city in Southern California, which is part of Los Angeles County. It is one of the most beautiful places to live in. It is a popular tourist destination and has plenty of things to do, especially if you like surfing or sailing. Santa Clarita has a long-standing tradition of award-winning art and music. Santa Clarita has been listed on the Travel and Leisure Magazine’s “Best Places to Visit” list for many years and is a popular summer getaway for many people.
If you want to know what Santa Clarita’s water quality is like, then you should read this report. This article will give you some in-depth information about the recently tested water at the Santa Clarita Water Treatment Plant. Specifically, we’ll discuss the testing results and how the quality of the water meets or exceeds the standards set by the Environmental Protection Agency (EPA). After reading this report, you should be able to make an informed decision about whether or not you want to use Santa Clarita water during your next trip.
The Santa Clarita water quality report showed that there are three significant contaminants found in the water. Those are total dissolved solids, suspended particles, and organic chemicals. All three elements should be safe for consumption, as long as they don’t overwhelm the water. The water treatment plant also tested the “total suspended solids” – which refers to the more giant water molecules – and they showed that they are under control, although still below EPA standards.
Santa Clarita Water Resource Control Board
Santa Clarita is a popular tourist destination for those coming in from Los Angeles, Orange County, or other places near the Southern California region. Many of them will stop in at the Santa Clarita water resource control board to look at the damage done to the environment and see what steps can be taken to improve it. This is a popular spot for people because the water on the ground has been so contaminated with so many different contaminants that it is not safe to use swimming pools in it. These highly contaminated pools can be very unhealthy and even dangerous to the users. It will be necessary to clean the pool up as soon as possible.
One of the reasons that the water at the Santa Clarita water resource board is considered a danger is the amount of pollution in the water daily. A good percentage of this pollution comes from the vast amount of dumping in the ocean. Many people believe that this is okay because it makes the water more drinkable, but there is no way of knowing if this is true. There are also many chemicals dumped into the water, making it too toxic to be used by anyone who wants to use it.
Another reason that many people do not want to swim in Santa Clarita water is the kind of pollution in Santa Clarita’s sea. Because of all of the pollution that is going on in the water resource area, it is not a wonder that Santa Clarita has so much pollution in it. The pollution in the air, land, and water is very unhealthy and dangerous for anyone to use. If you are planning on going into the Santa Clarita water resource area to swim or fish, you need to make sure that you are aware of what you are doing and that you have permission from the Santa Clarita water resource control board so. If you are caught doing something illegal or not permitted, you could spend a lot of time in jail or even be sued by the city of Santa Clarita for what you did wrong.
Santa Clarita Water Treatment
Santa Clarita is a community located in the middle of California’s wine country. The water that runs through this area is naturally healthy. However, there are some significant pollutants and impurities that threaten to harm the quality of the water. Some people have learned to live with the problems, but others are more concerned about the effects these pollutants may have on their health. For this reason, they seek out the assistance of a professional company that can provide them with a quality water treatment system. While you cannot give Santa Clarita water treatment services directly, there are plenty of companies that offer the service, and many of them can be found on the Internet.
When you are looking for a company to provide Santa Clarita water treatment services, it is good to get a list of services offered and compare each one. The best way to do this is to look at the company’s website and see what types of water purification and treatment systems they offer. You will likely find that most of the companies listed provide a wide variety of sink filtration systems and drinking water treatment. This way, you can choose the one that meets your needs best. There is no reason to settle for the second-best, especially when the peace of mind you receive from drinking clean water is priceless.
Santa Clarita water treatment systems are designed to filter out the most significant amount of impurities from the water that runs through your home. Also, they are designed to make the water taste better. The benefits of having clean water that tastes good cannot be overstated. With the help of a professional company, you can enjoy the water in your home without worrying about the possible harmful effects. You can find a water purification system for your home today.
Santa Clarita Water Agency
The Santa Clarita water agency is part of the California Department of Resources (dead link). The Santa Clarita water agency was formed in 1920 to serve all the residents of Santa Clarita’s city. The agency was created to administer and control water for both residential and non-residential use in the area. The Santa Clarita water agency’s mission is to ensure that the water supply is protected and provides an environmentally healthy atmosphere. The Santa Clarita water agency’s responsibility is to provide a clean and safe water supply for all of its users.
When you are considering a water agency, you should always look for an agency that is certified by the state of California as operating on behalf of the state. All water agencies must submit to this test, and the certification shows that they have met specific standards and are following the letter of the law. Another thing that you should look for when shopping for a Santa Clarita water agency is a well-laid-out website that displays the services they offer and contact information. Many times there will be links to additional information if you are interested in learning more about the Santa Clarita water agency. This site can also be an excellent source for learning about the various environmental issues that may concern the Santa Clarita water agency and how they may be solved.
When you find a Santa Clarita water agency that you like, you must be aware that they provide many different kinds of services. Many of them offer both drinking water and well water, which are two very other things. You may need to inquire about the OK water permit if you intend to install your property well. It is a good idea to get a plumber or irrigation expert’s help if you have any significant problems with your water system. Although the Santa Clarita water agency can provide many of the services you need, they are better served to keep an eye on their customers’ health and make sure that all of their customers’ needs are met.
Santa Clarita Water
Santa Clarita water treatment and filtration are perhaps the best in Southern California. The entire city is built on a water-rights tract. The city of Santa Clarita sells all of its water to the county’s residents, and through the city water provider, to all other local municipalities and businesses. That’s great, except the water sent out by the Santa Clarita water plant contains a surprising amount of contaminants that have no business being in our drinking water, much less being in an environment where we swim and wade in freshwater all day long. These range from excessive salt levels (the kind that makes seafood taste so salty) to common but harmful chemicals such as those used in agriculture.
If you’ve ever lived close to a big-scale farm, you’ll know that there’s a lot of chemicals used on an average day. These are the same things used on golf courses, but they’re used on the lawns and gardens of large properties instead because they don’t get as much press. These chemicals can be hazardous to children, who can’t tell the difference between a naturally occurring substance and one that’s been added artificially. When they get sick, it’s usually because the chlorine in the water gives them a rash, as it does with most people exposed to chlorine during their childhood. It’s not just Santa Clarita water with this problem; it’s water in general, and the issues are compounded there.