Table of Contents
Can You Drink Tap Water in Oakland?
Yes, Oakland's tap water is generally considered safe to drink as Oakland has no active health based violations of the Safe Drinking Water Act (SDWA) that we are aware of. Other factors such as lead piping in a home, or low levels of pollutants on immunocompromised individuals, should also be considered, however. To find more recent info we might have, you can check out our boil water notice page, the city's water provider website, or Oakland's local Twitter account.
According the EPA’s ECHO database, from April 30, 2019 to June 30, 2022, Oakland's water utility, East Bay Mud, had 0 violations of the Safe Drinking Water Act. For more details on the violations, please see our violation history section below. This assessment is based on the East Bay Mud water system, other water systems in the city may have different results.
While tap water that meets the EPA health guidelines generally won’t make you sick to your stomach, it can still contain regulated and unregulated contaminants present in trace amounts that could potentially cause health issues over the long-run. These trace contaminants may also impact immunocompromised and vulnerable individuals.
The EPA is reviewing if it’s current regulations around pollutant levels in tap water are strict enough, and the health dangers posed by unregulated pollutants, like PFAS.
Water Quality Report for Oakland Tap Water
The most recent publicly available numbers for measured contaminant levels in Oakland tap water are in its 2020 Water Quality Report. As you can see, there are levels which the EPA considers to be acceptable, but being below the maximum allowable level doesn’t necessarily mean the water is healthy.
Lead in tap water, for example, is currently allowed at up to 15ppb by the EPA, but it has set the ideal goal for lead at zero. This highlights how meeting EPA standards doesn’t necessarily mean local tap water is healthy.
EPA regulations continue to change as it evaluates the long term impacts of chemicals and updates drinking water acceptable levels. The rules around arsenic, as well as, lead and copper are currently being re-evaluated.
There are also a number of "emerging" contaminants that are not currently. For example, PFAS (Per- and polyfluoroalkyl substances), for which the EPA has issued a health advisory. PFAS are called "forever chemicals" since they tend not to break down in the environment or the human body and can accumulate over time.
We recommend looking at the contaminants present in Oakland's water quality reports, or getting your home's tap water tested to see if you should be filtering your water.
Oakland Tap Water Safe Drinking Water Act Violation History - Prior 10 Years
Below is a ten year history of violations for the water system named East Bay Mud for Oakland in California. For more details please see the "What do these Violations Mean?" section below.
Is there Lead in Oakland Water?
Based on the EPA’s ECHO Database, 90% of the samples taken from the Oakland water system, East Bay Mud, between sample start date and sample end date, were at or below, 0.0033 mg/L of lead in Oakland water. This is 22.0% of the 0.015 mg/L action level. This means 10% of the samples taken from Oakland contained more lead.
While Oakland water testing may have found 0.0033 mg/L of lead in its water, that does not mean your water source has the same amount. The amount of lead in water in a city can vary greatly from neighborhood to neighborhood, or even building to building. Many buildings, particularly older ones, have lead pipes or service lines which can be a source of contamination. To find out if your home has lead, we recommend getting you water tested.
No amount of lead in water is healthy, only less dangerous. As lead accumulates in our bodies over time, even exposure to relatively small amounts can have negative health effects. For more information, please check out our Lead FAQ page.
Are there PFAS in Oakland Tap Water?
Currently, testing tap water for PFAS isn’t mandated on a national level. We do have a list of military bases where there have been suspected or confirmed leaks. There appears to be at least one military base - Naval Air Station Alameda - near Oakland with suspected leaks.
With many potential sources of PFAS in tap water across the US, the best information we currently have about which cities have PFAS in their water is this ewg map, which you can check to see if Oakland has been evaluated for yet.
Our stance is better safe than sorry, and that it makes sense to try to purify the tap water just in case.
What do these Violations Mean?
Safe Drinking Water Act Violations categories split into two groups, health based, and non-health based. Generally, health based violations are more serious, though non-health based violations can also be cause for concern.
Health Based Violations
- Maximum contaminant levels (MCLs) - maximum allowed contaminant level was exceeded.
- Maximum residual disinfectant levels (MRDLs) - maximum allowed disinfectant level was exceeded.
- Other violations (Other) - the exact required process to reduce the amounts of contaminants in drinking water was not followed.
Non-Health Based Violations
- Monitoring and reporting violations (MR, MON) - failure to conduct the required regular monitoring of drinking water quality, and/or to submit monitoring results on time.
- Public notice violations (Other) - failure to immediately alert consumers if there is a serious problem with their drinking water that may pose a risk to public health.
- Other violations (Other) - miscellaneous violations, such as failure to issue annual consumer confidence reports or maintain required records.
SDWA Table Key
| Field | Description |
|---|---|
| Compliance Period | Dates of the compliance period. |
| Status |
Current status of the violation.
|
| Health-Based? | Whether the violation is health based. |
| Category Code |
The category of violation that is reported.
|
| Code | A full description of violation codes can be accessed in the SDWA_REF_CODE_VALUES (CSV) table. |
| Contaminant Code | A code value that represents a contaminant for which a public water system has incurred a violation of a primary drinking water regulation. |
| Rule Code |
Code for a National Drinking Water rule.
|
| Rule Group Code |
Code that uniquely identifies a rule group.
|
| Rule Family Code |
Code for rule family.
|
For more clarification please visit the EPA's data dictionary.
Oakland Water - Frequently Asked Questions
| By Phone: | 510-287-7056 |
| By Email: | david.briggs@ebmud.com |
| By Mail: | 375 11TH ST STE 606 OAKLAND, CA, 94607-4246 |
Existing customers can login to their East Bay Mud account to pay their Oakland water bill by clicking here.
If you want to pay your East Bay Mud bill online and haven't made an account yet, you can create an account online. Please click here to create your account to pay your Oakland water bill.
If you don't want to make an account, or can't remember your account, you can make a one-time payment towards your Oakland water bill without creating an account using a one time payment portal with your account number and credit or debit card. Click here to make a one time payment.
Moving to a new house or apartment in Oakland means you will often need to put the water in your name with East Bay Mud. In order to put the water in your name, please click the link to the start service form below. Start service requests for water bills typically take two business days.
Leaving your house or apartment in Oakland means you will likely need to take your name off of the water bill with East Bay Mud. In order to take your name off the water bill, please click the link to the stop service form below. Stop service for water bills requests typically take two business days.

The estimated price of bottled water
$2 in USD (1.5-liter)
USER SUBMITTED RATINGS
- Drinking Water Pollution and Inaccessibility
- Water Pollution
- Drinking Water Quality and Accessibility
- Water Quality
The above data is comprised of subjective, user submitted opinions about the water quality and pollution in Oakland, measured on a scale from 0% (lowest) to 100% (highest).
Related FAQS
Oakland Water Quality Report (Consumer Confidence Report)
The EPA mandates that towns and cities consistently monitor and test their tap water. They must report their findings in an annual Consumer Confidence Report. Below is the most recent water quality report from Oakland's Water. If you would like to see the original version of the report, please click here.
EAST BAY
MUNICIPAL
UTILITY
DISTRICT
2020 ANNUAL WATER QUALITY REPORT
for January through December
EBMUD is pleased to report that in 2020 your drinking water quality met or surpassed every state and federal requirement that safeguards public health.
Sunrise at Upper San Leandro Water Treatment Plant
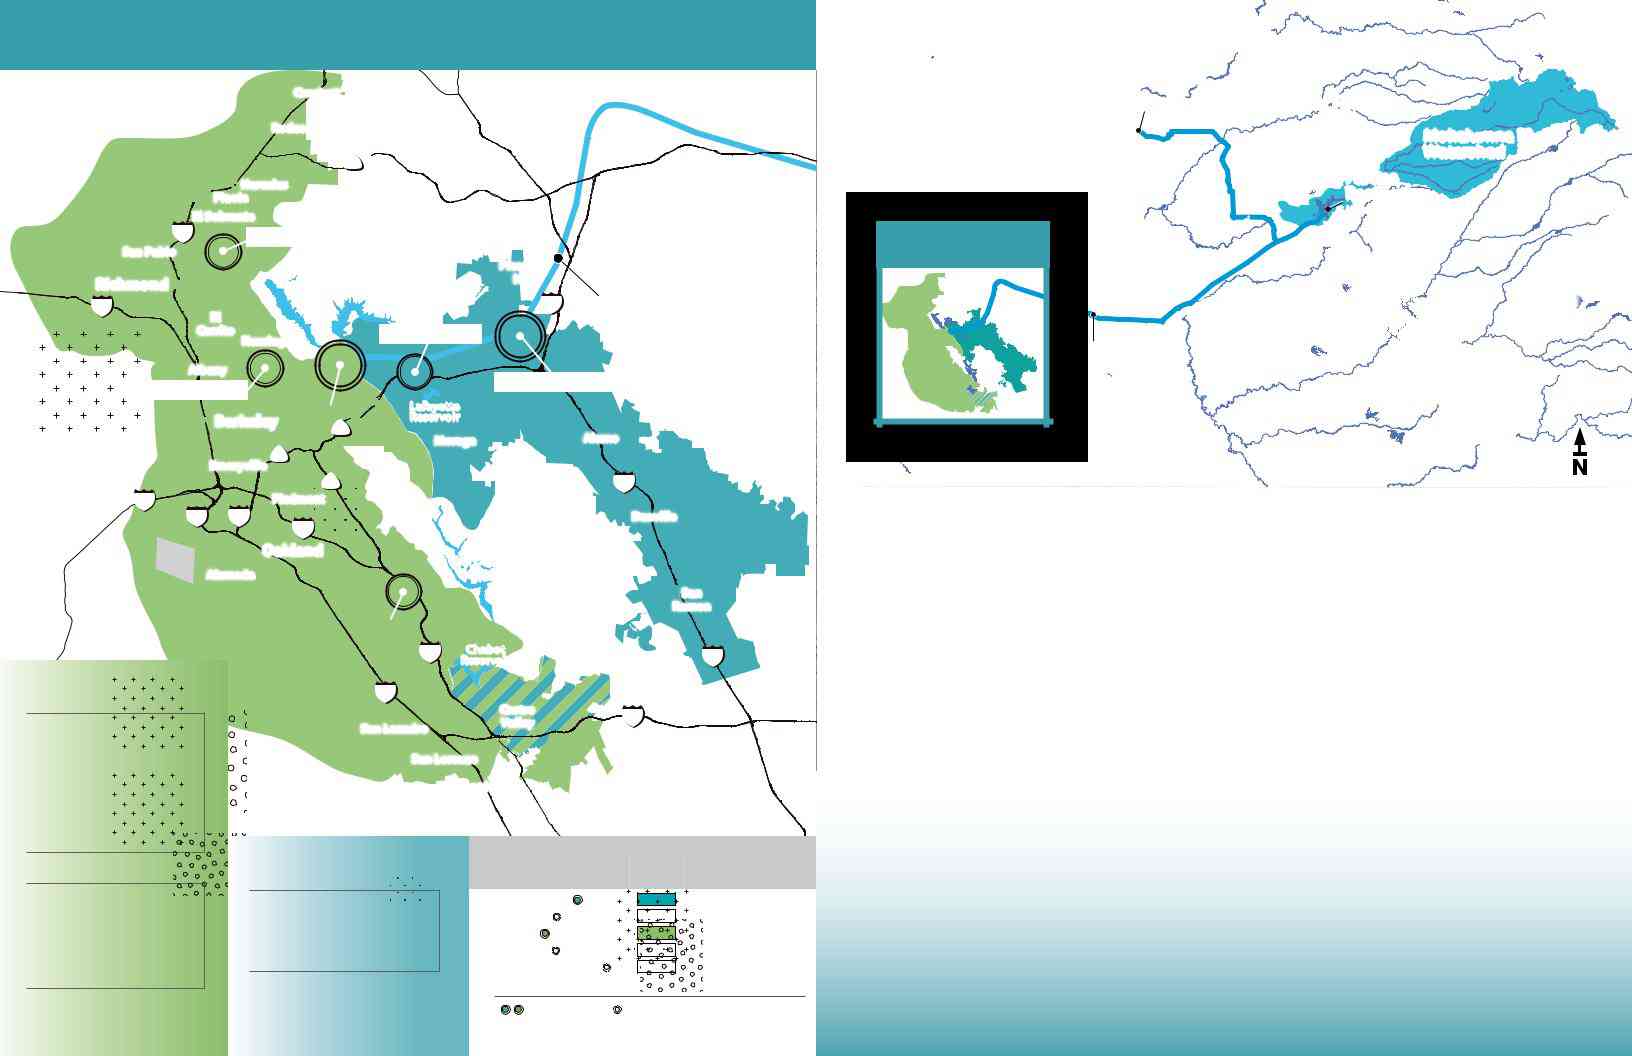
EBMUD SERVICE AREA
Crockett
S A N P A B L O B A Y
Rodeo
4
Hercules
Pinole
|
El Sobrante |
80 |
Sobrante WTP |
|
San Pablo
San Pablo
Richmond Reservoir
580 |
|
El |
|
Cerrito |
Kensington |
|
Pleasant |
|
|
Hill |
|
Briones |
680 |
Mokelumne Aqueducts |
Reservoir |
|
Lafayette WTP
Albany
San Pablo WTP*
Orinda WTP
Berkeley 24
S |
Emeryville |
24 |
A |
N |
13 |
|
F |
80 |
Piedmont |
R |
880 |
980 |
|
A |
|||
|
580 |
Walnut Creek WTP
Lafayette
Reservoir
MoragaAlamo
680
Danville
|
|
|
|
|
|
|
|
|
|
Alpine County |
|
|
Sacramento |
|
|
|
|
|
|
||
|
Davis |
Freeport Regional Water Facility |
|
|||||||
|
Drought water supply |
|
|
|||||||
|
|
|
Mokelumne River |
|||||||
|
|
|
|
|
|
|
|
|
Amador County |
|
|
|
|
|
|
|
|
|
|
Watershed |
|
|
|
|
|
|
|
|
|
|
|
|
|
Vacaville |
|
|
|
|
|
|
|
Pardee |
|
|
|
|
|
|
|
|
|
|
|
|
|
|
|
|
|
|
|
|
|
Reservoir |
|
|
|
L |
|
|
|
|
|
|
Main water supply |
|
|
|
o |
|
|
|
|
|
r |
|
|
|
|
w |
|
|
|
|
|
|
|
|
|
|
e |
|
|
|
|
e |
|
|
|
|
|
|
r |
|
|
|
|
|
|
|
|
|
|
M |
|
|
|
iv |
|
|
|
EBMUD |
|
Sacramento — |
|
|
|
R |
|
|
||
|
|
o |
|
|
e |
|
|
|||
|
San Joaquin Delta |
|
k |
n |
|
|
|
|||
|
|
|
e lum |
|
|
|
|
|||
SERVICE AREA |
|
|
|
|
|
|
|
|
Calaveras County |
|
|
|
|
|
|
|
|
|
|
|
Yosemite |
|
|
|
|
|
|
|
|
|
|
National |
|
|
|
|
Stockton |
|
Park |
||||
|
|
|
|
|
|
|||||
|
Mokelumne |
|
|
|
|
|
|
|
|
|
|
Aqueducts |
|
|
|
|
|
|
|
|
|
|
Three |
|
|
|
|
|
|
|
|
|
|
water supply pipelines |
|
|
|
|
|
|
|
||
SF |
N |
Oakland |
|
C |
|||
|
|||
|
I |
|
|
|
S |
Alameda |
|
|
C |
||
|
|
||
|
O |
|
|
|
B |
Upper San Leandro WTP |
|
|
A |
||
|
Y |
||
Upper
San Leandro
Reservoir
San
Ramon
580 |
Chabot |
680 |
|
Reservoir |
Area served by |
|
880 |
|
||
Orinda WTP |
|
|
|
|
|
Crockett |
|
|
San Leandro |
||
Rodeo |
|
|
|||
|
|
|
|
||
Hercules |
|
During times of high demand, |
San Lorenzo |
||
Pinole |
also served as |
maintenance, or for other |
|||
|
|||||
El Sobrante |
needed by |
operational needs, regions shown |
Hayward |
||
in more than one color or pattern |
|||||
San Pablo |
Sobrante WTP |
||||
may be served from a different |
|
||||
Richmond |
|
treatment plant drawing from a |
|
||
El Cerrito |
|
different source reservoir. |
|
||
Kensington |
|
|
|
|
|
Orinda |
|
Area served by |
|
||
Moraga |
|
|
|||
|
Walnut Creek WTP |
|
|||
Piedmont |
|
Orinda |
|
|
|
Oakland |
|
|
|
||
also served as |
Moraga |
also served as |
|
||
Alameda |
|
||||
San Leandro |
needed by |
Lafayette |
needed by |
|
|
Upper San |
Pleasant Hill |
Lafayette WTP |
|
||
San Lorenzo |
|
||||
Leandro WTP |
Walnut Creek |
|
|
||
Castro Valley |
|
|
|||
|
|
|
|||
Hayward |
|
Alamo |
|
|
|
Albany |
|
Danville |
|
|
|
Berkeley |
|
San Ramon |
|
|
|
Castro |
580 |
|
Valley |
||
|
Water treatment |
Area |
Primary |
plant (WTP) |
served |
reservoir |
Walnut Creek |
|
Pardee |
Lafayette |
|
Pardee |
Orinda |
|
Pardee, Briones |
Sobrante |
|
San Pablo |
Upper San Leandro |
|
Upper San Leandro |
* San Pablo WTP is a standby plant and was not in operation during 2020 |
||
Seasonal WTPs |
|
|
FROM SNOWFLAKE TO THE BAY
The water flowing out of the taps of 1.4 million East Bay customers originates almost entirely from the
Snowmelt from Alpine, Amador, and Calaveras counties flows into Pardee Reservoir near Valley Springs. Three large aqueducts transport water 90 miles from Pardee Reservoir to our service area and then to every customer, hydrant, and fire service through EBMUD’s water distribution system. During drought or for operational needs, EBMUD may draw water from local watersheds in the East Bay or purchase water from other watersheds like the Sacramento River – and customers may notice a change in the taste. Because we have multiple sources, we’re much more resilient.
EBMUD’s skilled employees operate a complex network of reservoirs, pipes, pumps, and water treatment plants. This infrastructure is rarely seen, but it works around the clock to provide safe, reliable drinking water every day.
SOURCE WATER PROTECTION
EBMUD evaluates our water sources to ensure great water quality. We conduct assessments for the Mokelumne River watershed and East Bay watersheds at least every five years. The most recent
surveys were completed in 2021 and include data for 2015 to
2019 for the Mokelumne River watershed and 2015 to 2018 for the East Bay watersheds. The water quality surveys evaluate sanitary conditions, results of watershed management activities, and identify potential contamination sources that may affect the watersheds. Potential contaminant sources include runoff from fire and fuels management, geologic hazards, erosion, wildlife and livestock, sanitation facilities, recreation, urban storm water, and transportation corridors. Ongoing efforts to identify and protect the source waters from all potential contaminating activities are an integral part of EBMUD’s water quality management. To review these reports, contact EBMUD or the State Water Resources Control Board.
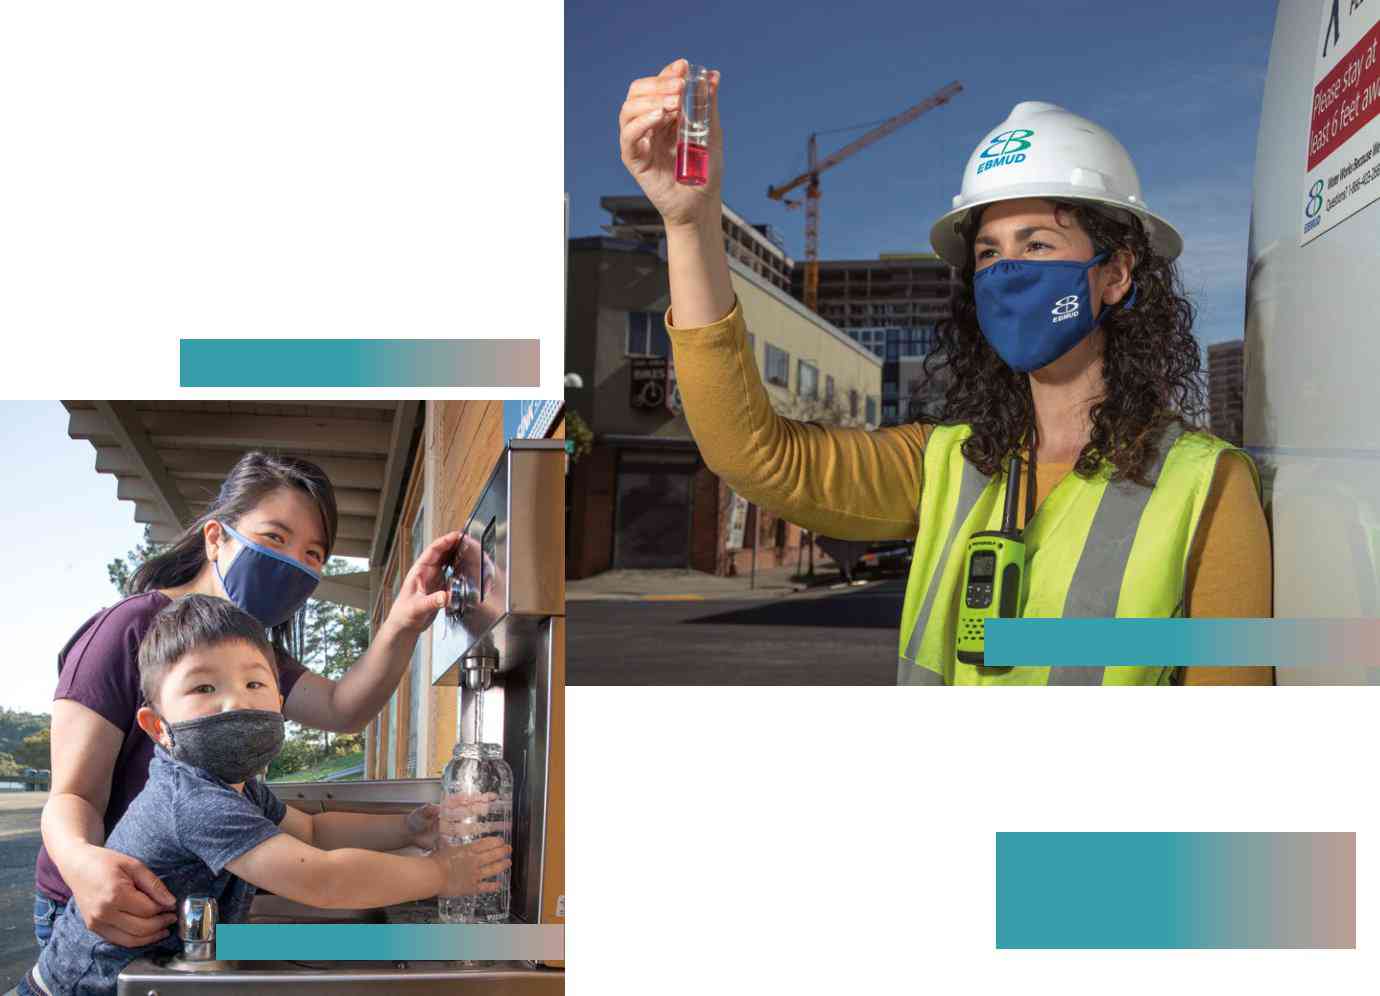
PROTECTING PUBLIC HEALTH ONE DROP AT A TIME
Before reaching your tap, all water is treated to high standards at EBMUD’s water treatment plants which filter and disinfect water for
1.4 million customers daily. EBMUD ensures high water quality by carefully managing and protecting watershed lands and reservoirs, using best practices to treat drinking water, operating and maintaining an intricate distribution system, and by quickly addressing customer questions or concerns.
EBMUD samples and tests your water extensively to ensure it is safe to drink. We monitor for the presence of more than 100 substances including microorganisms, pesticides, herbicides, asbestos, lead, copper, petroleum products, and
Emeryville |
Castro Valley |
3
ESSENTIAL SERVICES DURING A PANDEMIC
EBMUD has remained on the job throughout the coronavirus pandemic and took actions to keep the water flowing for our customers and to protect our essential workers. Though more than half of EBMUD staff sheltered at home to help prevent transmission of the virus, many EBMUD employees worked continuously to repair, maintain, and replace our critical infrastructure and treat water and wastewater to high standards. When hand sanitizer and masks were in short supply, EBMUD manufactured hand sanitizer for employees and disinfected masks for reuse, later becoming a regional clearinghouse for 75,000 reusable masks from FEMA/EPA for other water and wastewater agencies in northern California. For indispensable jobs, such as Water Treatment Plant Operators, EBMUD created new protocols to minimize health risks by implementing shift rotations and minimizing access by others inside sensitive facilities. We modified our sampling practices to allow employees to work safely. In offices, plastic guards and partitions were installed, and workflows were altered to provide for electronic signatures and digital communications, significantly reducing our use of paper. EBMUD provided access to rapid
WHERE YOUR WATER IS TREATED
Before reaching your tap, EBMUD treats the water at one of our water treatment plants in the East Bay. Some customers receive water from different treatment plants depending on the time of year. The taste and odor of your tap water may change throughout the year because of operational changes (such as when a treatment plant is shut down for maintenance) or due to changes in the source water.
These water treatment plant locations are shown on the map on page 2.
WHAT WAS DETECTED AND REPORTED
In 2020, EBMUD treated raw water from multiple sources and consistently provided
The tables on the following pages show the measured amounts of contaminants detected in 2020 or in the most recent year sampling was required. Samples were collected in EBMUD’s source waters, at water treatment plants, in the distribution system, and at customer taps.
Although EBMUD tests for more than 100 substances, this report only lists those detected at or above the state or federal level required for reporting. In this case, no news is good news!
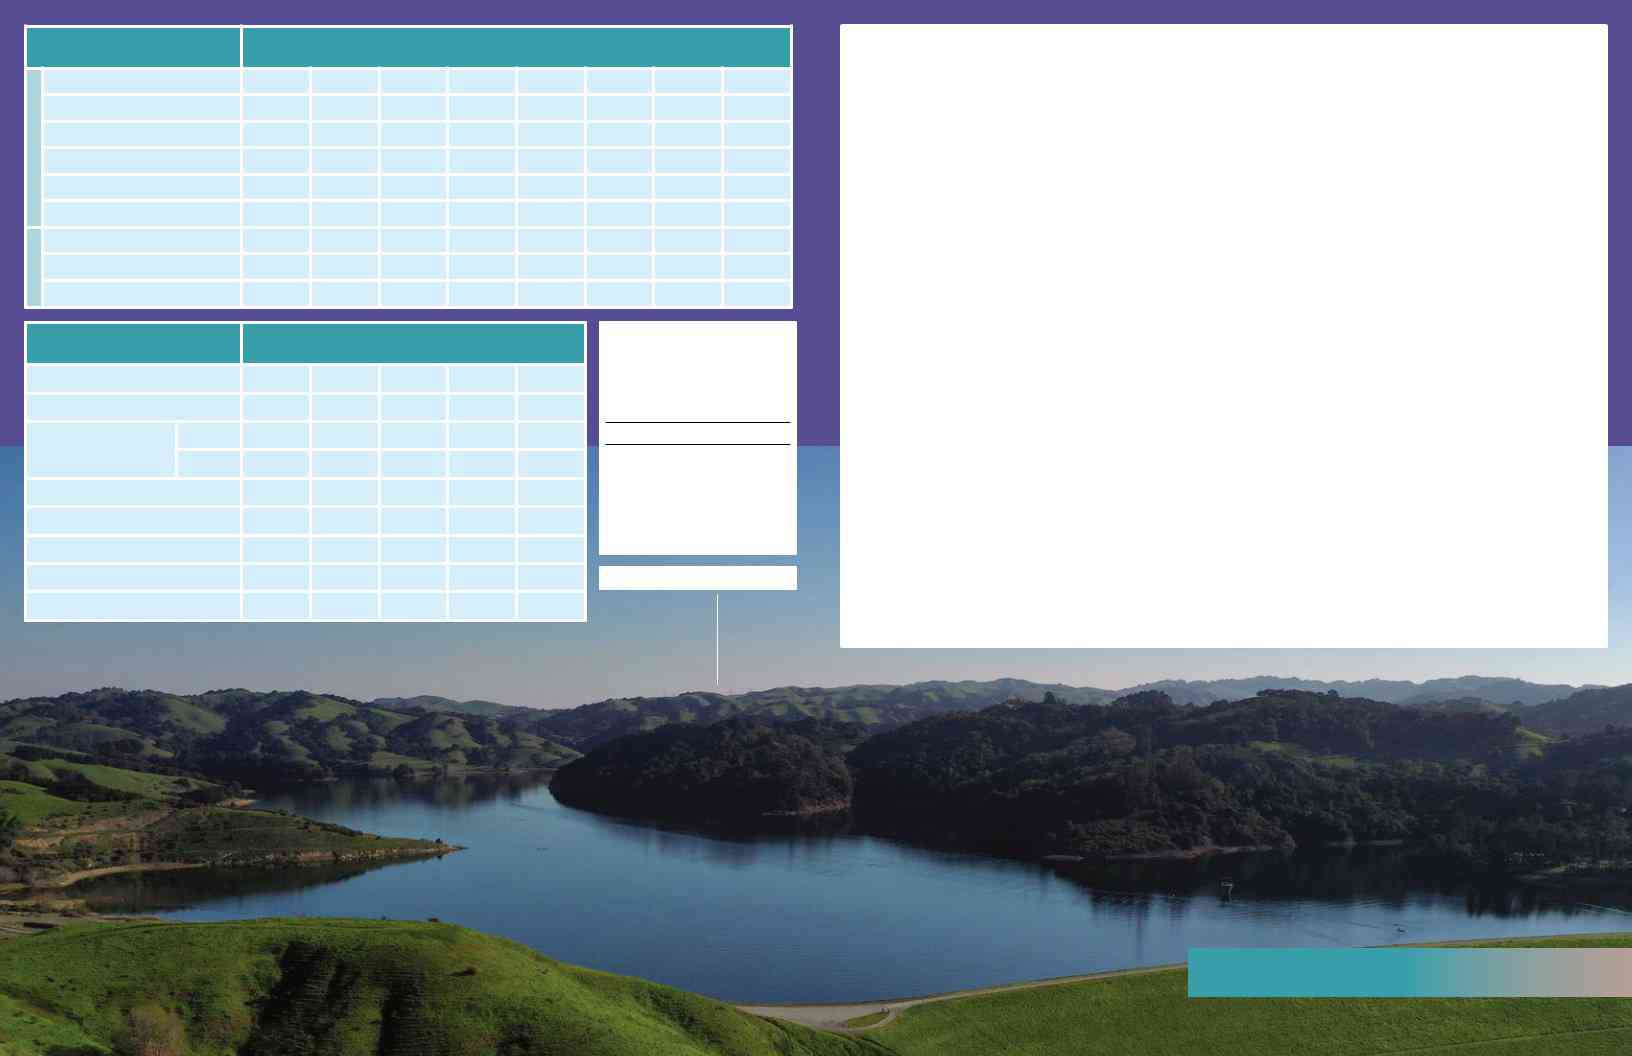
HOW TO READ THE WATER QUALITY TABLE
Table 1 – Regulated for public health
These contaminants are regulated to protect your health. They have maximum contaminant levels, known as primary MCLs, set by the State Water Board or the USEPA. These levels are set as close to the established public health goals as is economically and technologically feasible
Table 2 – Regulated for drinking water aesthetics
These contaminants are regulated to maintain aesthetic qualities such as smell, taste, and appearance of drinking water. They have maximum contaminant levels, also known as secondary MCLs, set by the State Water Board.
Table 3 – Unregulated contaminants
These contaminants are not currently regulated. Unregulated contaminant monitoring helps the State Water Board and the USEPA determine where certain contaminants are present and whether the contaminants need to be regulated in the future. The results under the Unregulated Contaminant Monitoring Rule part 4 (UCMR4) must be reported if detected. This table also includes other contaminants that have state notification levels and water agencies are
Table 4 – Other parameters of interest to customers
These water measurements, such as pH, hardness and alkalinity, may be of interest to customers.
Find your location on the map on page 2. Note which water treatment plant(s) serve that area.
-
Go to the first column in the tables on pages
6–8 to find the contaminant you are interested in. Remember – no news is good news! - Column two lists the state or federal goal. At that amount or lower, there is no known or expected risk to health from the contami- nant’s presence in drinking water. Not all listed contaminants have state or federal goals.
- Column three notes the highest amount the State Water Board or the USEPA allows. This amount is usually not as low as the public health goal in column two.
- Column four lists the average amount detected across the EBMUD service area or at designated locations.
- Find the column that corresponds to the water treatment plant or plants that serve you. This is the range of concentration of the contaminant detected in your area’s water.
- The last column lists how the contaminant typically gets into your drinking water.
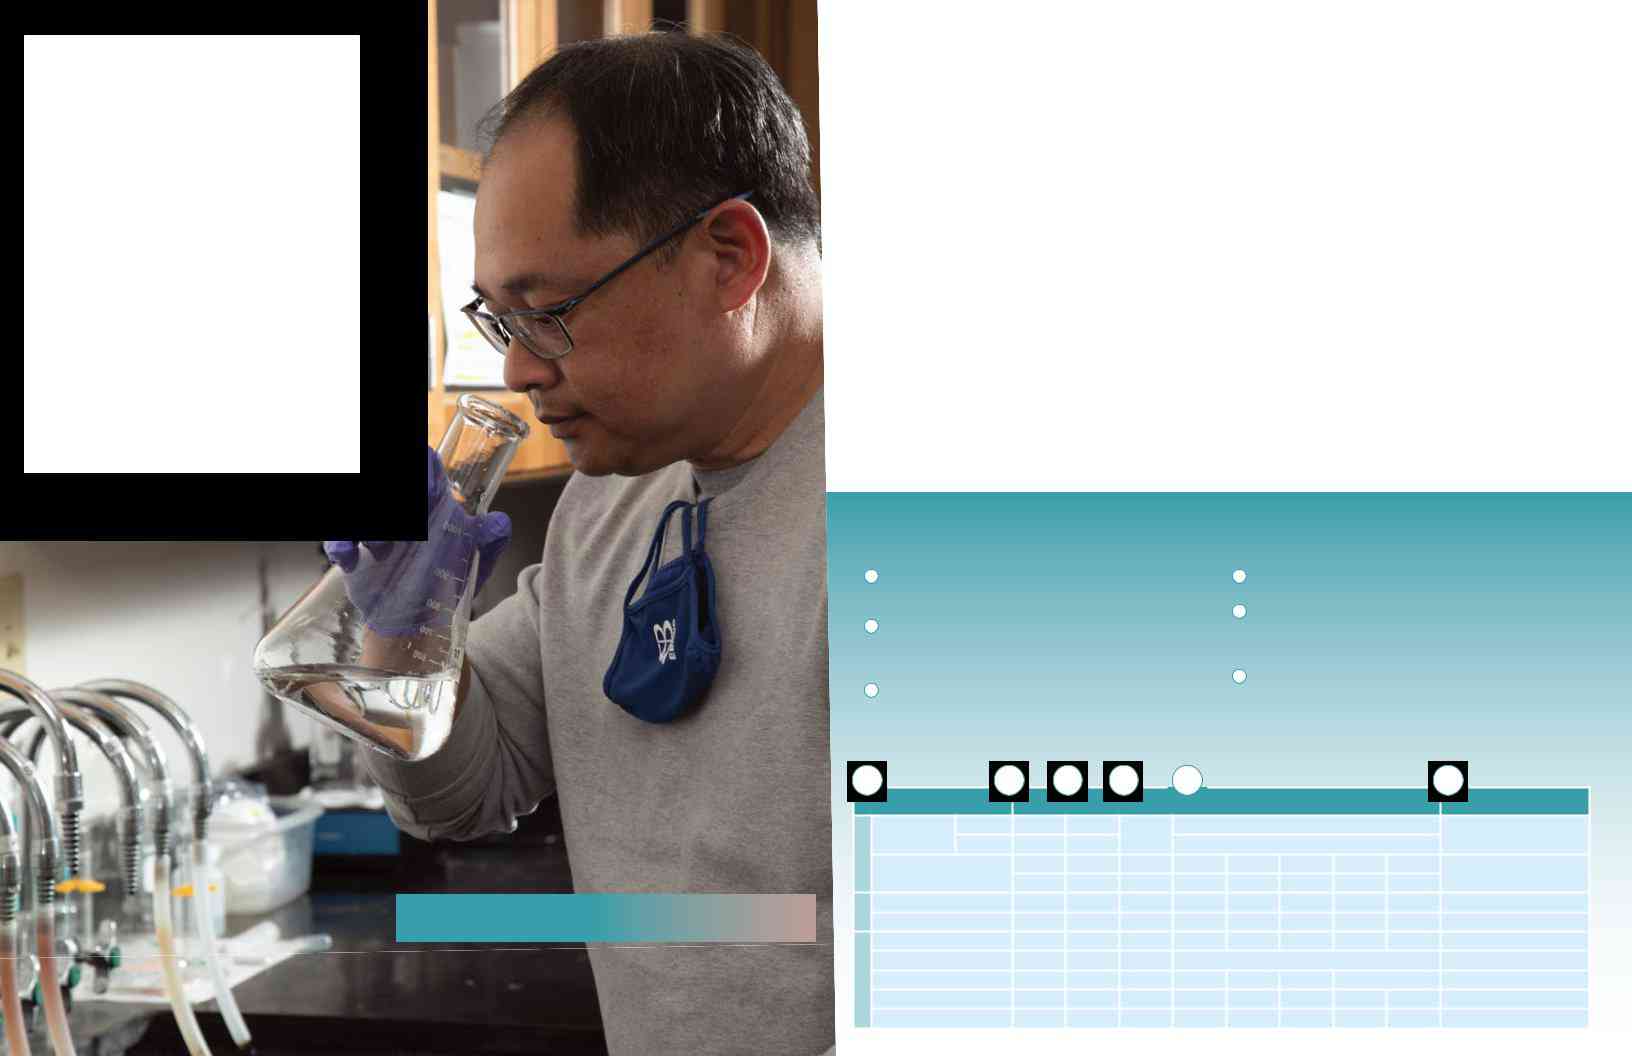
In addition to thousands of lab tests, Water System Inspectors like Wayne check the aesthetics of the water for smell and taste
4
1 |
|
|
|
2 |
State or |
3 |
Highest |
4 |
|
5 |
|
|
|
|
|
|
6 |
|
|
1 |
Regulated for public health |
|
|
|
|
System |
|
|
Water treatment plants |
|
Upper |
|
|
|
|
||||
|
federal goal |
amount allowed |
|
|
|
|
|
|
Typical |
sources |
|
||||||||
Primary MCL (Unit) |
Walnut Creek |
Lafayette |
Orinda |
Sobrante |
|
|
|||||||||||||
PHG, MCLG or MRDLG |
MCL, MRDL or AL |
average |
San Leandro |
|
|
|
|||||||||||||
|
|
state rule |
0 |
|
5% |
|
|
|
0.5% was the highest percentage found in any month |
Naturally present in the environment |
|
||||||||
Microbiological |
Total Coliform |
|
|
|
|
|
NA |
|
|
|
|
|
|
|
|
||||
|
federal rule |
|
NA |
|
TT |
|
|
|
|
met requirement |
|
|
|
|
|
|
|||
|
|
|
|
|
|
|
|
|
|
|
|
|
|
||||||
|
Turbidity (NTU) |
|
NA |
|
1 |
|
0.03 |
0.02 - 0.10 |
0.01 - 0.10 |
0.02 - 0.10 |
0.02 - 0.10 |
0.03 - 0.10 |
Soil runoff |
|
|||||
|
|
NA |
|
95% ≤ 0.3 |
100% |
100% |
100% |
100% |
100% |
100% |
|
|
|||||||
|
|
|
|
|
|
|
|
|
|
||||||||||
Inorganic |
Aluminum (ppb) |
600 |
|
1000 |
|
<50 |
<50 |
|
<50 |
<50 |
<50 - 72 |
<50 |
|
Erosion of natural deposits; water treatment |
|
||||
Fluoride a (ppm) |
1 |
|
2 |
|
0.7 |
0.7 |
|
0.7 |
0.7 - 0.8 |
0.7 - 0.8 |
0.8 |
|
Erosion of natural deposits; water additive that |
|
|||||
|
|
|
|
|
|
|
|
|
|
|
|
|
|
|
|
|
promotes strong teeth |
|
|
|
Bromate (ppb) |
0.1 |
|
10 |
|
4.8 b |
NA |
NA |
NA |
3.3 - 6.7 |
<1 - 6.6 |
|
|
||||||
D/DBPs |
Chloramine as chlorine c (ppm) |
4 |
|
4 |
|
2.4 b |
|
|
|
0.2 - 4 |
|
|
|
Drinking water disinfectant added for treatment |
|
||||
Control of DBP precursors – TOC |
|
NA |
|
TT |
NA |
NA |
NA |
NA |
met requirement |
Various natural and |
|
||||||||
|
|
|
|
||||||||||||||||
|
Haloacetic acids, 5 species e (ppb) |
|
NA |
|
60 |
|
43 d |
24 - 37 |
22 - 28 |
15 - 31 |
23 - 51 |
22 - 34 |
|
|
|||||
|
Trihalomethanes e (ppb) |
|
NA |
|
80 |
|
49 d |
30 - 50 |
24 - 49 |
25 - 54 |
25 - 57 |
32 - 52 |
|
5 |
|||||
|
|
|
|
|
|
|
|
|
|
|
|
|
|
|
|
|
|
|
|
EBMUD 2020 ANNUAL WATER QUALITY REPORT
In 2020, your drinking water was consistently the highest quality, surpassing every public health requirement set by the State Water Resources Control Board Division of Drinking Water and the U.S.
Environmental Protection Agency.
1 |
Regulated for public health |
State or |
Highest |
System |
|
Water treatment plants |
|
Upper |
Typical sources |
||
federal goal |
amount allowed |
Walnut Creek |
Lafayette |
Orinda |
Sobrante |
||||||
Primary MCL (Unit) |
PHG, MCLG or MRDLG |
MCL, MRDL or AL |
average |
San Leandro |
|
||||||
|
state rule |
0 |
5% |
|
0.5% was the highest percentage found in any month |
Naturally present in the environment |
|||||
Microbiological |
Total Coliform |
|
|
NA |
|
|
|
|
|
||
federal rule |
NA |
TT |
|
|
|
met requirement |
|
|
|
||
|
|
|
|
|
|
|
|||||
|
Turbidity (NTU) |
NA |
1 |
0.03 |
0.02 - 0.10 |
0.01 - 0.10 |
0.02 - 0.10 |
0.02 - 0.10 |
0.03 - 0.10 |
Soil runoff |
|
|
NA |
95% ≤ 0.3 |
100% |
100% |
100% |
100% |
100% |
100% |
|||
|
|
|
|||||||||
Inorganic |
Aluminum (ppb) |
600 |
1000 |
<50 |
<50 |
<50 |
<50 |
<50 - 72 |
<50 |
Erosion of natural deposits; water treatment residue |
|
Fluoride a (ppm) |
1 |
2 |
0.7 |
0.7 |
0.7 |
0.7 - 0.8 |
0.7 - 0.8 |
0.8 |
Erosion of natural deposits; water additive that |
||
|
|
|
|
|
|
|
|
|
|
promotes strong teeth |
|
|
Bromate (ppb) |
0.1 |
10 |
4.8 b |
NA |
NA |
NA |
3.3 - 6.7 |
<1 - 6.6 |
||
D/DBPs |
Chloramine as chlorine c (ppm) |
4 |
4 |
2.4 b |
|
|
0.2 - 4 |
|
|
Drinking water disinfectant added for treatment |
|
Control of DBP precursors – TOC |
NA |
TT |
NA |
NA |
NA |
NA |
met requirement |
Various natural and |
|||
|
|||||||||||
|
Haloacetic acids, 5 species e (ppb) |
NA |
60 |
43 d |
24 - 37 |
22 - 28 |
15 - 31 |
23 - 51 |
22 - 34 |
||
|
Trihalomethanes e (ppb) |
NA |
80 |
49 d |
30 - 50 |
24 - 49 |
25 - 54 |
25 - 57 |
32 - 52 |
||
2 |
Regulated for drinking water aesthetics |
State or |
Highest |
System |
|
Water treatment plants |
|
Upper |
Typical sources |
||
federal goal |
amount allowed |
Walnut Creek |
Lafayette |
Orinda |
Sobrante |
||||||
Secondary MCL (Unit) |
PHG, MCLG |
MCL |
average |
San Leandro |
|
||||||
Aluminum (ppb) |
NA |
200 |
<50 |
<50 |
<50 |
<50 |
<50 - 72 |
<50 |
Erosion of natural deposits; water treatment residue |
||
Chloride (ppm) |
NA |
250 |
6 |
4 - 5 |
4 - 5 |
4 - 6 |
15 - 18 |
17 - 19 |
Runoff/leaching from natural deposits |
||
Color (color units) |
NA |
15 |
2 |
1 |
3 |
1 - 3 |
2 |
1 |
|||
Odor (TON) |
NA |
3 |
<1 |
<1 |
<1 |
<1 |
<1 |
1 |
|||
Specific conductance (μS/cm) |
NA |
900 |
106 |
70 |
72 |
75 - 114 |
250 |
383 |
Substances that form ions when in water |
||
Sulfate (ppm) |
NA |
250 |
6 |
1 - 2 |
1 - 2 |
1 - 10 |
29 - 32 |
45 - 48 |
Runoff/leaching from natural deposits |
||
Total dissolved solids (ppm) |
NA |
500 |
63 |
32 - 59 |
40 - 49 |
32 - 76 |
140 - 170 |
230 - 260 |
Runoff/leaching from natural deposits |
||
Turbidity (NTU) |
NA |
5 |
0.03 |
0.02 - 0.10 |
0.01 - 0.10 |
0.02 - 0.10 |
0.02 - 0.10 |
0.03 - 0.10 |
Soil runoff |
||
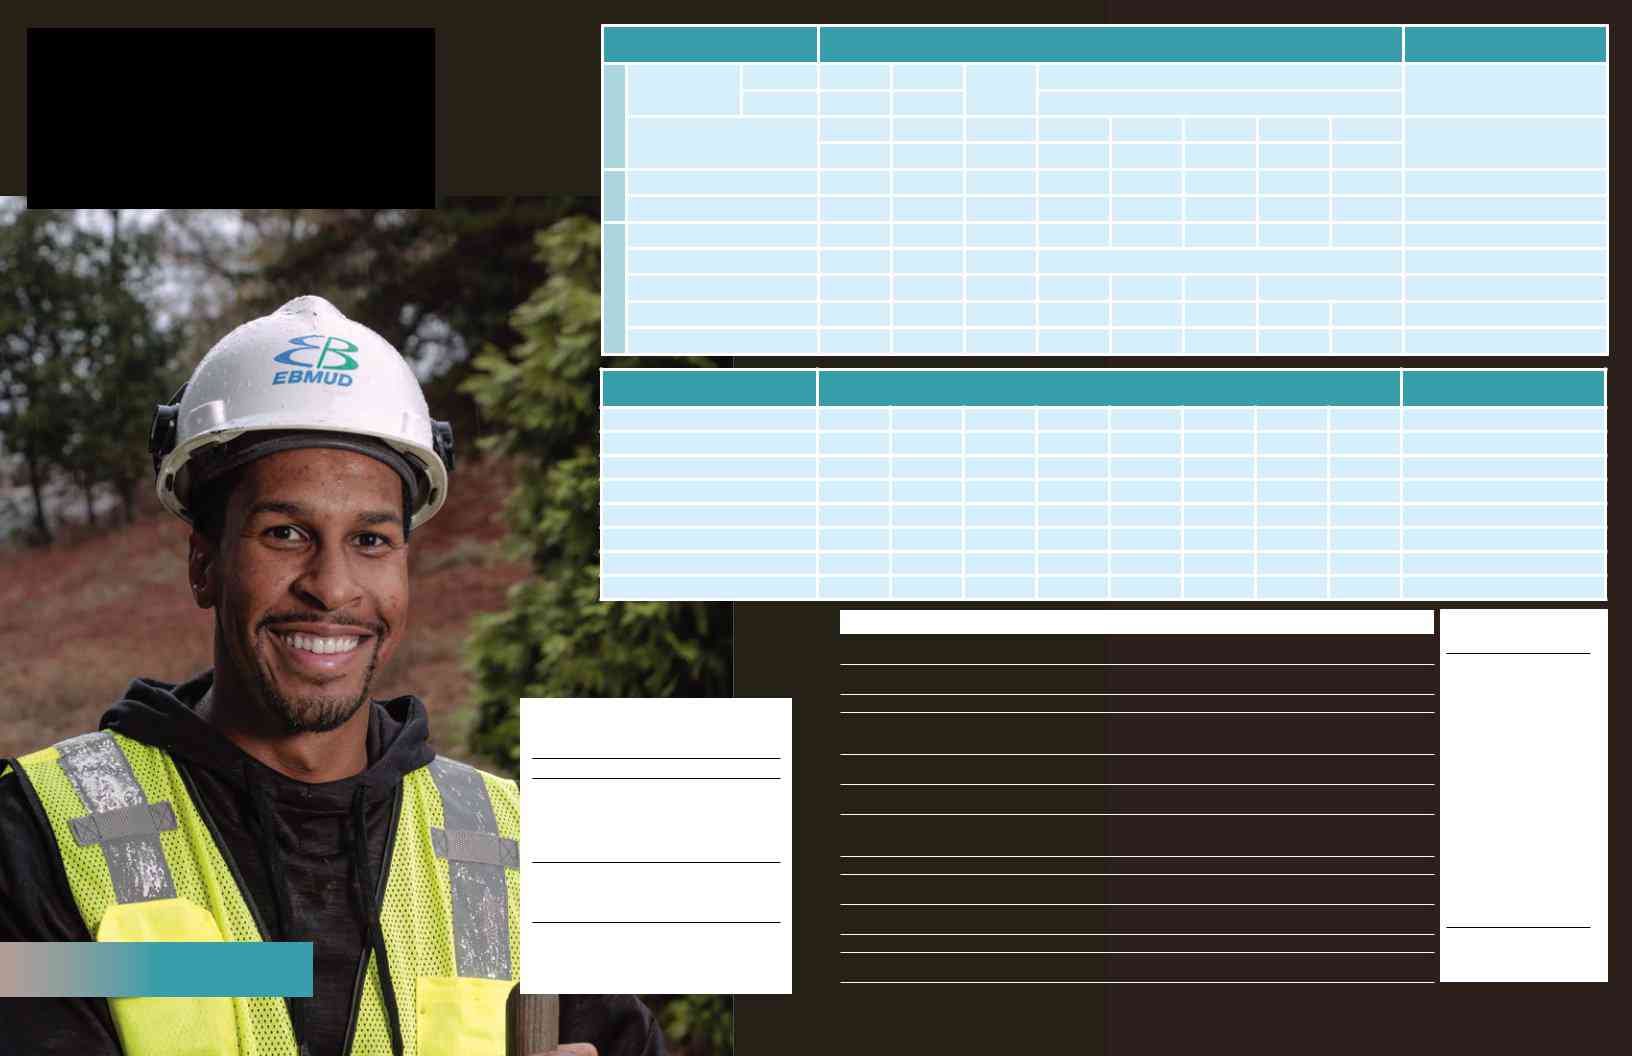
EBMUD employees like Dave work to ensure our customers have access to clean, quality water 24/7.
Notes
- See page 11 for additional information about fluoride in drinking water.
- Highest running annual average.
- Chloramine residuals in the distribution system are measured as an equivalent quantity of chlorine. When the chloramine residual cannot be detected, the sample is further analyzed to ensure that microbiological water quality is in compliance with regulations.
- This value is the highest locational running annual average, which compliance is based on. Water treatment plant values show the range of individual sample results.
- These data are collected in the distribution system. The sample locations are assigned to the most representative water treatment plant, but the data may also represent water from another plant.
Key Terms
AL |
Regulatory Action Level. The concentration which, if exceeded, triggers treatment or other requirements |
|
that a water system must follow. |
DBP |
Disinfection |
|
water. Trihalomethanes (THMs), haloacetic acids (HAAs), chlorate, and bromate are disinfection |
D/DBPs |
Disinfection |
MCL |
Maximum Contaminant Level. The highest level of a contaminant that is allowed in drinking water. Primary |
|
MCLs are set as close to the PHGs or MCLGs as is economically and technologically feasible. Secondary |
|
MCLs address odor, taste and appearance of drinking water. |
MCLG |
Maximum Contaminant Level Goal. The level of a contaminant in drinking water below which there is no |
|
known or expected risk to health. MCLGs are set by the USEPA. |
MRDL |
Maximum Residual Disinfectant Level. The highest level of a disinfectant allowed in drinking water. There is |
|
convincing evidence that addition of a disinfectant is necessary for control of microbial contaminants. |
MRDLG |
Maximum Residual Disinfectant Level Goal. The level of a drinking water disinfectant below which there |
|
is no known or expected risk to health. MRDLGs do not reflect the benefits of the use of disinfectants to |
|
control microbial contaminants. |
NA |
Not Applicable. |
Primary Drinking These standards regulate contaminants that affect health by setting MCLs, MRDLs, and Treatment Techniques Water Standard (TT) along with their monitoring and reporting requirements.
PHG |
Public Health Goal. The level of a contaminant in drinking water below which there is no known or expected |
|
|
risk to health. PHGs are set by the California EPA. |
|
TOC |
Total Organic Carbon. A measure of organic content in the water. |
|
Turbidity |
A measure of the cloudiness of water. Turbidity is monitored because it is a good indication of the effectiveness |
|
of our filtration systems. |
||
|
- Treatment Technique. A required process intended to reduce the level of a contaminant in drinking water.
Units
gpg grains per gallon
NTU |
Nephelometric |
|
Turbidity Unit, a |
|
measure of the |
|
cloudiness of water |
|
|
ppm |
parts per million. |
|
One ppm is like 1 |
|
second in 11.5 days. |
|
(mg/L) |
|
|
ppb |
parts per billion. |
|
One ppb is like 1 |
|
second in nearly 32 |
|
years. (μg/L) |
|
|
ppt |
parts per trillion. |
|
One ppt is like 1 second in |
|
nearly 32,000 years. (ng/L) |
|
|
TON |
Threshold Odor |
|
Number, a measure |
|
of odor in water |
μS/cm microsiemens per centimeter, a measure of electrical conductance
6 |
7 |
|
Unregulated contaminants |
Year |
State NL |
System |
|
|
Water treatment plants |
Upper |
||
3 No established MCL (Unit) |
sampled |
average |
Walnut Creek |
Lafayette |
Orinda |
Sobrante |
||||
|
San Leandro |
|||||||||
|
Bromide in source water (ppb) |
NA |
<5 |
<5 |
<5 |
<5 |
22 - 26 |
35 - 46 |
||
|
Haloacetic acids, 5 species (ppb)e |
NA |
35 |
24 - 40 |
27 - 37 |
23 - 46 |
40 - 58 |
19 - 57 |
||
UCMR4 |
Haloacetic acids, 9 species (ppb)e |
NA |
36 |
25 - 41 |
28 - 37 |
24 - 47 |
43 - 66 |
25 - 68 |
||
Haloacetic acids, 6 brominated species (ppb)e |
NA |
2 |
0.3 - 2 |
0.4 - 1 |
0.4 - 2 |
3 - 10 |
0.6 - 12 |
|||
|
||||||||||
WATER QUALITY REGULATIONS
In order to ensure that tap water is safe to drink, the State Water Board and the USEPA prescribe regulations that limit the amount of certain contaminants in water provided by public water systems. California Department of Public Health (CDPH) and United States Food and Drug Administration regulations establish limits for contaminants in bottled water that provide the same protection for public health. Additional information on bottled water is available on the CDPH website.*
Drinking water, including bottled water, may reasonably be expected to contain at least small amounts of some contaminants. The presence of contaminants does not necessarily indicate that water poses a health risk. More information about contaminants and potential health effects is available online at
|
Manganese (ppb) |
500 |
1 |
<0.4 |
<0.4 |
<0.4 |
<0.4 – 13 |
2 - 4 |
|||
|
TOC in source water (ppm) |
NA |
2.5 |
1.5 - 2.3 |
1.5 - 2.3 |
1.5 |
- 3.0 |
3.4 |
- 5.5 |
5.3 - 7.2 |
|
|
Boron (ppb) |
2020 |
1000 |
<100 |
<100 |
<100 |
<100 |
<100 |
122 |
||
f |
|
|
|
|
|
|
|
|
|
|
|
Others |
Chlorate (ppb) |
2020 |
800 |
197 |
150 |
250 |
180 |
- 200 |
270 |
- 540 |
88 - 120 |
|
|
|
|
|
|
|
|
|
|
|
|
|
2020 |
10 |
2 |
<1 - 1 |
1 - 2 |
1 |
- 3 |
5 |
- 8 |
<1 - 2 |
|
The sources of drinking water (both tap water and bottled water) include rivers, lakes, streams, ponds, reservoirs, springs and wells. As water travels over the surface of the land or through the ground, it dissolves
Contaminants that may be present in source water include:
Vulnerable populations
Some people may be more vulnerable to contaminants in drinking water than the general population.
These people should seek advice about drinking water from their
4 |
Other parameters of interest |
|
|
|
|
Water treatment plants |
|
|
Upper |
|||
to customers (Unit) |
Walnut Creek |
Lafayette |
Orinda |
Sobrante |
San Leandro |
|||||||
Alkalinity, Total as CaCO3 (ppm) |
24 |
- 35 |
25 |
- 33 |
25 |
- 48 |
79 |
- |
83 |
150 |
||
Calcium (ppm) |
4 |
- 6 |
4 |
- 6 |
4 |
- 9 |
19 - 22 |
32 |
- 34 |
|||
|
(gpg )g |
|
1 |
|
1 |
1 |
- 2 |
4 |
- 5 |
8 |
- 9 |
|
Hardness as CaCO3 |
14 |
- 24 |
16 |
- 24 |
16 |
- 36 |
72 |
- 88 |
140 |
- 150 |
||
|
(ppm) |
|||||||||||
Magnesium (ppb) |
|
1 |
|
1 |
1 |
- 2 |
6 |
- 7 |
13 |
- 15 |
||
pH (pH) |
9.3 |
9.2 |
- 9.4 |
8.5 |
- 9.5 |
8.5 |
- 8.9 |
8.2 |
- 8.4 |
|||
Potassium (ppm) |
<1 - 1 |
<1 - 1 |
<1 - 1 |
|
1 |
|
|
2 |
||||
Silica (ppm) |
8 - 11 |
8 - 11 |
8 - 11 |
|
9 |
|
10 |
- 11 |
||||
Sodium (ppm) |
5 |
- 7 |
5 |
- 7 |
5 - 11 |
22 |
- 26 |
28 |
- 32 |
|||
Notes
- These data are collected in the distribution system. The sample locations are assigned to the most representative water treatment plant, but the data may also represent water from another plant.
- Parameters with a notification level.
- Grains Per Gallon (gpg) is a measure of water hardness. Knowing the amount can help improve the function of dishwashers, cooling equipment and other industrial processes. Refer to your appliance manufacturer’s instruction manual for the optimum grains per gallon level.
Key Terms
NL Notification Level. |
UCMR4 |
A |
The federal |
Microbial contaminants, such as viruses, bacteria and protozoa, such as Cryptosporidium, that may come from sewage treatment plants, septic systems, agricultural livestock operations and wildlife.
Inorganic contaminants, such as salts and metals, that can
be
Pesticides and herbicides, that may come from a variety of sources, such as agriculture, urban stormwater runoff, and residential uses.
Organic chemical contaminants, including synthetic and volatile organic chemicals, that are
Radioactive contaminants that can be naturally occurring
or be the result of oil and gas production and mining activities.
health care providers. USEPA/CDC guidelines on appropriate means to lessen the risk of infection by Cryptosporidium and Giardia and other microbial contaminants are available online at www.cdc.gov/parasites/crypto/index.html.
Cryptosporidium and Giardia
Cryptosporidium and Giardia are microbial contaminants that are naturally present in the environment and found in surface water throughout the United States. Filtration is highly effective in removing these contaminants, however the most commonly used filtration methods cannot guarantee 100 percent removal. In 2020 our monitoring detected Cryptosporidium and Giardia in our source water prior to reaching EBMUD water treatment plants.
Cryptosporidium and Giardia must be ingested to cause disease, and it may spread through means other than drinking water. Most healthy individuals can overcome the disease within a few weeks. However,
level established by the |
unregulated |
State Water Board for |
contaminant |
contaminants in drinking |
monitoring |
water that lack MCLs. |
rule part 4. |
*www.cdph.ca.gov/Programs/CEH/DFDCS/Pages/FDBPrograms/FoodSafetyProgram/Water.aspx
Briones Reservoir is one of five East Bay reservoirs that stores ‘raw’ water before it’s treated at one of EBMUD’s treatment plants and then distributed to customers.
8 |
9 |
Per - and Polyfluoroalkyl Substances (PFAS)
PFAS are a group of
Several years ago, the USEPA required all large water systems (including EBMUD) to collect and analyze samples for a limited set of PFAS; we did not detect any at that time. Analytical methods are constantly improving; since our initial monitoring was done five years ago, newer methods have become available that are capable of finding some PFAS at concentrations as low as 1 or 2 parts per trillion.
Currently, the State Water Board has issued monitoring orders to hundreds of water systems most vulnerable to PFAS contamination due to their proximity to airports with fire
training and response areas and municipal solid waste landfills. These public water systems were required to sample quarterly for four consecutive quarters.
EBMUD was not required to monitor due to the protected nature of our watersheds. Each quarter, we did voluntary collection and analyzed samples from each EBMUD treatment plant during 2020, using the most recent analytical methods with the lowest available detection limits. Some very low concentrations were detected, but all were below the state’s Notification Levels (5.1 parts per trillion for PFOA and
6.5 parts per trillion for PFOS). EBMUD will continue to monitor for PFAS in 2021.
Lead in drinking water
If present, elevated levels of lead can cause serious health problems. Pregnant women, infants and young children are typically more vulnerable to lead in drinking water than the general population.
Lead in drinking water is primarily from materials and components associated with lead in water distribution pipes and home plumbing. EBMUD replaced all known lead service pipes in its service area in the
Our latest lead and copper sampling results at 53 customer homes were below the action levels for lead and copper and the 90th percentile values were below the detection limit. Lead and copper sampling was last completed in 2018. Due to low results, EBMUD samples for lead and copper every three years.
If you are concerned about elevated lead levels in your home’s water, you may have your water tested. EBMUD offers our customers one free lead test per year. More than 1,700 customers have requested a free lead test voucher since the program began in 2017. Lead concentration from these customer samples continues to be very low (less than 1 ppb for 90 percent of the samples). Request a lead test voucher by calling Customer Service at
Also, if you suspect you have lead in your fixtures, any time your water has been sitting for several hours, you can minimize the potential for lead exposure by running your faucet for 30 seconds to 2 minutes before using water for drinking or cooking. Capture and reuse this water for other uses such as watering ornamental plants.
- REQUEST A LEAD TEST VOUCHER
Call
Lead testing in schools
Sampling for lead in schools began in 2017 and completed in January 2020. EBMUD provided comprehensive lead testing at
and made publicly available on the State Water Board’s website.**
After a new pipe is installed in downtown Oakland, Sam checks to make sure there’s enough chlorine for disinfection.
fluorosis does not affect the health of the infant or the health of the infant’s teeth. To lessen this chance, deionized, purified, distilled or demineralized bottled water can be used.
If you have additional questions about fluoride, contact your health provider. Additional information can be found at www.waterboards.ca.gov/drinking_water/certlic/drinkingwater/Fluoridation.html or www.cdc.gov/fluoridation websites.
1990s and continues to actively seek out and replace any remaining lead materials. We maintain an aggressive corrosion control program to reduce lead leaching from our water mains and customer piping. Still, lead may be present as a legacy of older plumbing, particularly older plumbing within homes. According to the USEPA, homes built before 1986 are more likely to have lead pipes or fixtures and solder that contain lead.
Great water is on tap for all our 1.4 million East Bay customers.
Fluoridation
EBMUD is required by state law to add fluoride to drinking water to help prevent dental decay in consumers. Current regulations require fluoride levels in the treated water be maintained between 0.6 to 1.2 ppm with an optimum dose of 0.7 ppm. Our monitoring showed that fluoride levels in the treated water distribution system averaged 0.7 ppm.
According to the American Dental Association and CDC, it is safe to use optimally fluoridated water for preparing infant formula. If an infant is primarily fed infant formula prepared with fluoridated water, there may be an increased chance for mild enamel fluorosis, but enamel
- REPORT A WATER QUALITY CONCERN
Do you have a question or concern about your water quality? Call
10
**www.waterboards.ca.gov/drinking_water/certlic/drinkingwater/leadsamplinginschools.html |
11 |
375 Eleventh Street Oakland, CA 94607
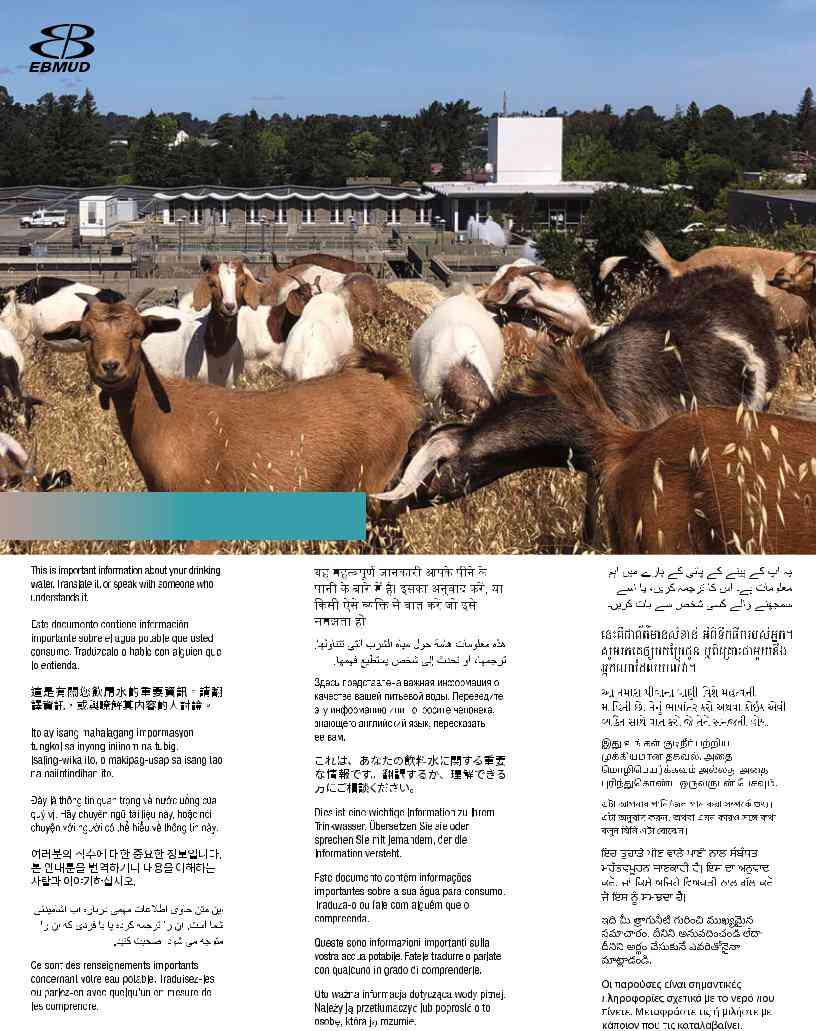
Goats help EBMUD reduce vegetation and minimize fire hazards around our water treatment plants without the need for pesticides.
HOW TO CONTACT EBMUD
For more information about water quality or to report a water quality concern, call
If you would like this report mailed to you, email customerservice@ebmud.com or call
EBMUD has a
state or local public health officials have imposed or recommend social distancing. For more information, see
General Manager
Clifford C. Chan
ADDITIONAL CONTACTS
State Water Resources Control Board Division of Drinking Water •
PHOTO CREDITS: Karl Nielson, Elijah Nouvelage, Susan Teefy, Kingmond Young
PUB. 148 3/21 2M 30%
Contaminants
East Bay Municipal Utility District
EWG's drinking water quality report shows results of tests conducted by the water utility and provided to the Environmental Working Group by the California State Water Resources Control Board, as well as information from the U.S. EPA Enforcement and Compliance History database (ECHO). For the latest quarter assessed by the U.S. EPA (January 2019 - March 2019), tap water provided by this water utility was in compliance with federal health-based drinking water standards.
Utility details
- Serves: 1379000
- Data available: 2012-2017
- Data Source: Surface water
- Total: 12
Contaminants That Exceed Guidelines
- Total trihalomethanes (TTHMs)
Other Detected Contaminants
- Aluminum
- Bromide
- Chlorate
- Chromium (hexavalent)
- Fluoride
- Haloacetic acids (HAA5)
- Molybdenum
- Nitrate
- Nitrate and nitrite
- Strontium
- Vanadium
Reminder
Always take extra precautions, the water may be safe to drink when it leaves the sewage treatment plant but it may pick up pollutants during its way to your tap. We advise that you ask locals or hotel staff about the water quality. Also, note that different cities have different water mineral contents.
Sources and Resources
Sources Cited
Additional Resources
Oakland Tap Water
If you’re like me, then you’ve probably been shopping for bottled water or filtered water at some point in time. However, with the recent reports about contaminants and the health risks associated with long-term exposure to those types of water, you might be wondering if you should be shopping for Oakland tap water as well. After all, it does stand to reason that the quality of our water should be one of the first things that we look at when trying to make a decision regarding which type of filtration system we will use in our home.
There is no doubt that there are benefits to having your water supply come from the chlorination of public water supplies. Unfortunately, we are learning more about the consequences of that treatment. As people become aware of the dangers of inhaling chloroform gas and other chemicals, the benefits become much more clear. For example, scientists have found that, on average, the amount of cancer-causing chemicals in tap water has increased approximately fiftyfold since the chlorination of water began. Now that makes me think about the bottled water vs. tap water debate.
While it may be true that bottled water is a convenient way to get a “free” drink, it’s not really doing you any favors when it comes to your health. In fact, there are some very real health risks associated with the consumption of unfiltered water. The thing to do is to look for a water purifier that can effectively remove any contaminants from the water, providing you with a clean and healthy beverage all the time. There are many options out there, so take some time to do some research and find a product that works the best for you.
Drinking Water in Oakland
If you are looking for a place to get drinking water, then I would highly recommend you look into the Bottled Water Facility in Oakland. There is a large bottled water facility there that serves many people, and it is the largest in the city. Bottled water can be delivered to your home or office with ease. This allows people to have purified water in the comfort of their own homes.
This bottled water facility in Oakland has been serving many people for many years, and it is one of the best locations to go if you are interested in the water filtration process. If you want to have peace of mind when drinking tap water, then you should look into this particular option. It is much better than dealing with an expensive bottled water company because the filtered water will taste just as good as the unfiltered water. You are also going to get many more health benefits from using filtered water than you would from drinking unfiltered water.
There are many things that can be found on the internet about the bottled water industry, but you will want to do a little research into the water filtration process before you choose to use this option. There are some great water filter companies out there that can provide you with the kind of water filtration you are looking for at a very affordable price. This is why I strongly recommend that you look into this type of water purification system if you are looking to keep your family safe from harmful contaminants. It’s better to be safe than sorry when it comes to your family’s health. The bottled water industry is starting to change, and you should too!
Oakland Water Quality
Oakland water quality testing is required for everyone in the county. If you have new residential, commercial, or industrial development in the county, and you use treated water from a local treatment facility, there will be a specific contract between the developer and the Oakland water quality department. This contract should cover the time the water is used, how it is disposed of, what types of testing should be done, and what reporting responsibilities the county has to the developer. In addition, if your development uses a storm drain, you will need to test for quality on a regular basis, according to the guidelines established by the American Society for Testing and Materials (ASTM) Water Quality Association guidelines. All developments using treated water need to participate in such testing to comply with county ordinances and state statutes.
If you have existing water systems and believe they are not up to current standards, it is recommended that you maintain those systems to ensure proper treatment and distribution. The cost of quality testing can vary widely, depending on the scope of the project and the number of stages performed. Many local governments actually perform all necessary testing, though it is best to work with an experienced professional to conduct routine testing. Professional quality testing requires specialized equipment, detailed records, and prompt notification. It is better to know what is going on with your water source before a problem develops, and by maintaining regular testing, you can prevent potential problems from occurring.
The American Society for Testing and Materials (ASTM) Water Quality Association recommends that you annually test your drinking and shower water for certain contaminants. According to the guidelines established by the American Society for Testing and Materials (ASTM), testing should be conducted when the water has been sitting for at least one year. The testing is performed using either color or spectral analysis, as well as pH testing. If any of the contaminants are found in the sample, the name of the contaminant, its concentration, and a description of the material it is made of are listed on the testing report, along with a conclusion and recommendation for management action. Based on the information on the report, you will be able to determine if further testing is warranted.
Oakland Water Treatment
There is a major problem with the drinking water supply in Oakland California and that is contaminated with prescription drugs. The local Department of Health has been trying to get the water companies to treat their water but so far they have not been successful. Oakland is one of the cities that have been hit hard by this crisis. They have found that children that drink bottled water are more likely to develop problems with Attention Deficit Hyperactivity Disorder than other kids. This is a very disturbing finding because there are no studies at all linking the two. This could be due to the fact that when you take prescription medication that your body makes the decision to go into the detox process instead of the reabsorption process.
Oakland is not the only city that has had to deal with contaminated water supplies. In fact, California is filled with water problems due to all the garbage that is sent down the drain each day. If you take the time to think about what goes down your drains you can see why this is a big problem. Not only are there drugs in your drinking water but there are chemicals used to make the plastic bottles that we use today and these are just a couple of the things that are going down our drains along with your prescription drugs.
Oakland Water Source
One thing I can say about the Oakland water system is that it is great! It works fine, it’s cost-effective, and it’s a great service for the people of Oakland. This is especially true since it’s in the city of Oakland where the government has made some strides toward helping the people of Oakland get clean and drinkable water, especially since it’s in a part of the country that has been plagued by quite a few contaminants in the air and water. So if you live in that part of the country, you need to take advantage of this great resource.
The most popular thing about water is its cost-effectiveness. It’s totally affordable and it’s really easy to get. You can easily get a bottle of this water anywhere in the Oakland area for less than two bucks (that’s including tax and shipping). It comes from reservoirs, which are places where there is enough water for everybody to drink; and you can even filter your own water at home. It doesn’t matter how much you want to drink!
Health-Based Drinking Water
There is a difference between health and safety when it comes to the drinking water of humans. If this is the case, then we need to make sure that every source of water that we are using is properly disposed of, safe for human consumption. The Environmental Protection Agency works closely with water resources management companies to ensure that we are taking every possible step toward ensuring that the water that is provided to us is clean and healthy for consumption. When it comes to the use of chlorination in relation to this, there has been much controversy surrounding this practice.
Chlorine is used by a number of water treatment facilities to disinfect drinking water. However, in areas where it is chlorinated at too high of a concentration, it can actually become harmful to your health. A certain level of chlorine is needed in order to kill bacteria and germs, but when it becomes so rich in this form that it becomes toxic to humans, that is where the problems begin. Chlorine makes everything that it touches turn green, which includes the teeth. In addition to this, it damages our skin, our hair, and causes dryness in our eyes.
In order to solve the issue of contaminated tap water, many companies have begun to filter the water that we consume. Health-based drinking water filters are one of the most common types of filters being used in homes across the country. Not only is this filtering system beneficial to protecting your family from potentially harmful chemicals, but it also gives you the chance to enjoy a great tasting drink while also protecting them from potential harm. Many people simply do not realize the importance of using such a filtering system, and it is up to you to educate yourself so that you make an informed decision when it comes to purchasing one of these items for your home.