Table of Contents
Can You Drink Tap Water in San Jose?
Yes, San Jose's tap water is generally considered safe to drink as San Jose has no active health based violations of the Safe Drinking Water Act (SDWA) that we are aware of. Other factors such as lead piping in a home, or low levels of pollutants on immunocompromised individuals, should also be considered, however. To find more recent info we might have, you can check out our boil water notice page, the city's water provider website, or San Jose's local Twitter account.
According the EPA’s ECHO database, from April 30, 2019 to June 30, 2022, San Jose's water utility, San Jose Water, had 0 violations of the Safe Drinking Water Act. For more details on the violations, please see our violation history section below. This assessment is based on the San Jose Water water system, other water systems in the city may have different results.
While tap water that meets the EPA health guidelines generally won’t make you sick to your stomach, it can still contain regulated and unregulated contaminants present in trace amounts that could potentially cause health issues over the long-run. These trace contaminants may also impact immunocompromised and vulnerable individuals.
The EPA is reviewing if it’s current regulations around pollutant levels in tap water are strict enough, and the health dangers posed by unregulated pollutants, like PFAS.
Water Quality Report for San Jose Tap Water
The most recent publicly available numbers for measured contaminant levels in San Jose tap water are in its 2020 Water Quality Report. As you can see, there are levels which the EPA considers to be acceptable, but being below the maximum allowable level doesn’t necessarily mean the water is healthy.
Lead in tap water, for example, is currently allowed at up to 15ppb by the EPA, but it has set the ideal goal for lead at zero. This highlights how meeting EPA standards doesn’t necessarily mean local tap water is healthy.
EPA regulations continue to change as it evaluates the long term impacts of chemicals and updates drinking water acceptable levels. The rules around arsenic, as well as, lead and copper are currently being re-evaluated.
There are also a number of "emerging" contaminants that are not currently. For example, PFAS (Per- and polyfluoroalkyl substances), for which the EPA has issued a health advisory. PFAS are called "forever chemicals" since they tend not to break down in the environment or the human body and can accumulate over time.
We recommend looking at the contaminants present in San Jose's water quality reports, or getting your home's tap water tested to see if you should be filtering your water.
San Jose Tap Water Safe Drinking Water Act Violation History - Prior 10 Years
Below is a ten year history of violations for the water system named San Jose Water for San Jose in California. For more details please see the "What do these Violations Mean?" section below.
For the compliance period beginning April 1, 2017, San Jose had 1 non-health based Safe Drinking Water Act violation with the violation category being Monitoring and Reporting, more specifically, the violation code was Monitoring, Source Water (GWR) which falls into the Microbials rule code group, and the Groundwater Rule rule code family for the following contaminant code: E. COLI.
Is there Lead in San Jose Water?
Based on the EPA’s ECHO Database, 90% of the samples taken from the San Jose water system, San Jose Water, between sample start date and sample end date, were at or below, 0.0 mg/L of lead in San Jose water. This is 0% of the 0.015 mg/L action level. This means 10% of the samples taken from San Jose contained more lead.
While San Jose water testing may have found 0.0 mg/L of lead in its water, that does not mean your water source has the same amount. The amount of lead in water in a city can vary greatly from neighborhood to neighborhood, or even building to building. Many buildings, particularly older ones, have lead pipes or service lines which can be a source of contamination. To find out if your home has lead, we recommend getting you water tested.
No amount of lead in water is healthy, only less dangerous. As lead accumulates in our bodies over time, even exposure to relatively small amounts can have negative health effects. For more information, please check out our Lead FAQ page.
Are there PFAS in San Jose Tap Water?
Currently, testing tap water for PFAS isn’t mandated on a national level. We do have a list of military bases where there have been suspected or confirmed leaks. There appears to be at least one military base - Moffett Field/Moffett Field NAS - near San Jose with suspected leaks.
With many potential sources of PFAS in tap water across the US, the best information we currently have about which cities have PFAS in their water is this ewg map, which you can check to see if San Jose has been evaluated for yet.
Our stance is better safe than sorry, and that it makes sense to try to purify the tap water just in case.
San Jose SDWA Violation History Table - Prior 10 Years
| Compliance Period | Status | Health-Based? | Category Code | Code | Rule Code | Contaminant Code | Rule Group Code | Rule Family Code |
|---|---|---|---|---|---|---|---|---|
| 04/01/2017 - | Resolved | No | Monitoring and Reporting (MR) | Monitoring, Source Water (GWR) (34) | Ground Water Rule (140) | E. COLI (3014) | Microbials (100) | Groundwater Rule (140) |
What do these Violations Mean?
Safe Drinking Water Act Violations categories split into two groups, health based, and non-health based. Generally, health based violations are more serious, though non-health based violations can also be cause for concern.
Health Based Violations
- Maximum contaminant levels (MCLs) - maximum allowed contaminant level was exceeded.
- Maximum residual disinfectant levels (MRDLs) - maximum allowed disinfectant level was exceeded.
- Other violations (Other) - the exact required process to reduce the amounts of contaminants in drinking water was not followed.
Non-Health Based Violations
- Monitoring and reporting violations (MR, MON) - failure to conduct the required regular monitoring of drinking water quality, and/or to submit monitoring results on time.
- Public notice violations (Other) - failure to immediately alert consumers if there is a serious problem with their drinking water that may pose a risk to public health.
- Other violations (Other) - miscellaneous violations, such as failure to issue annual consumer confidence reports or maintain required records.
SDWA Table Key
| Field | Description |
|---|---|
| Compliance Period | Dates of the compliance period. |
| Status |
Current status of the violation.
|
| Health-Based? | Whether the violation is health based. |
| Category Code |
The category of violation that is reported.
|
| Code | A full description of violation codes can be accessed in the SDWA_REF_CODE_VALUES (CSV) table. |
| Contaminant Code | A code value that represents a contaminant for which a public water system has incurred a violation of a primary drinking water regulation. |
| Rule Code |
Code for a National Drinking Water rule.
|
| Rule Group Code |
Code that uniquely identifies a rule group.
|
| Rule Family Code |
Code for rule family.
|
For more clarification please visit the EPA's data dictionary.
San Jose Water - Frequently Asked Questions
| By Phone: | 408-761-7142 |
| By Email: | suzanne.delorenzo@sjwater.com |
| By Mail: | 1221A South Bascom Ave. SAN JOSE, CA, 95128 |
Existing customers can login to their San Jose Water account to pay their San Jose water bill by clicking here.
If you want to pay your San Jose Water bill online and haven't made an account yet, you can create an account online. Please click here to create your account to pay your San Jose water bill.
If you don't want to make an account, or can't remember your account, you can make a one-time payment towards your San Jose water bill without creating an account using a one time payment portal with your account number and credit or debit card. Click here to make a one time payment.
Moving to a new house or apartment in San Jose means you will often need to put the water in your name with San Jose Water. In order to put the water in your name, please click the link to the start service form below. Start service requests for water bills typically take two business days.
Leaving your house or apartment in San Jose means you will likely need to take your name off of the water bill with San Jose Water. In order to take your name off the water bill, please click the link to the stop service form below. Stop service for water bills requests typically take two business days.
The estimated price of bottled water
$1.80 in USD (1.5-liter)
USER SUBMITTED RATINGS
- Drinking Water Pollution and Inaccessibility
- Water Pollution
- Drinking Water Quality and Accessibility
- Water Quality
The above data is comprised of subjective, user submitted opinions about the water quality and pollution in San Jose, measured on a scale from 0% (lowest) to 100% (highest).
Related FAQS
San Jose Water Quality Report (Consumer Confidence Report)
The EPA mandates that towns and cities consistently monitor and test their tap water. They must report their findings in an annual Consumer Confidence Report. Below is the most recent water quality report from San Jose's Water. If you would like to see the original version of the report, please click here.
Annual Water Quality
Report 2020
Clean Water for Our Customers
This brochure provides a snapshot of last year’s water quality data for San Jose Water (SJW). Included are details about where your water comes from and how your water quality compares to State standards. SJW is pleased to report that your tap water met all USEPA and State primary drinking water health standards in 2020. As a member of the Partnership for Safe Water, SJW remains focused on water quality and environmental stewardship to ensure continued delivery of safe and high quality water to our customers. Since joining the Partnership for Safe Water, SJW has increased distribution system residual disinfectant levels and outperformed industry benchmarks in reducing main breaks. These
IMPORTANT DEFINITIONS
*Photo taken |
*Photo taken |
|
|
Planning for Water Quality Improvements
Detection Limit for Purposes of Reporting (DLR): The lowest level of a constituent that the Department of Public Health requires to be reported.
Maximum Contaminant Level Goal (MCLG): The level of a contaminant in drinking water, below which there is no known or expected risk to health. MCLGs are set by the U.S. Environmental Protection Agency.
Maximum Contaminant Level (MCL): The highest level of a contaminant that is allowed in drinking water. Primary MCLs are set as close to the PHGs (or MCLGs) as is economically and technologically feasible. Secondary MCLs are set to protect the odor, taste, and appearance of drinking water.
Maximum Residual Disinfectant Level (MRDL): The level of a disinfectant added for water treatment that may not be exceeded at consumer’s tap.
Maximum Residual Disinfectant Level Goal (MRDLG): The level of a drinking water disinfectant below which there is no known or expected risk to health. MRDLGs do not reflect the benefits of the use of disinfectants to control microbial contaminants.
Not Applicable (N/A): Not applicable.
Not Detected (ND): If a constituent is not measured at or above a DLR, it is reported as ND.
Not Sampled (NS): Source designated non- vulnerable or testing not required.
Notification Level (NL): A
Primary Drinking Water Standard (PDWS): MCLs and MRDLs for contaminants that affect health along with their monitoring and reporting requirements, and water treatment requirements.
Public Health Goal (PHG): The level of a contaminant in drinking water below which there is no known or expected risk to health. PHGs are set by the California Environmental Protection Agency.
Regulatory Action Level (AL): The concentration of a contaminant which, if exceeded, triggers treatment or other requirements that a water system must follow.
Response Level (RL): A
Treatment Technique (TT): A required process intended to reduce the level of a contaminant in drinking water.
Unregulated Contaminant Monitoring Rule 4 (UCMR4): Testing was conducted in 2019. The purpose of monitoring for these contaminants is to help EPA decide whether the contaminants should have a standard.
UNITS
Nephelometric Turbidity Units (NTU): A measure of the cloudiness of the water.
One part per million (ppm): One milligram per liter (mg/L). One ppm corresponds to a single penny in $10,000 or one minute in two years.
One part per billion (ppb): One microgram per liter (μg/L). One ppb corresponds to a single penny in $10,000,000 or one minute in 1,900 years.
One part per trillion (ppt): One nanogram per liter (ng/L). One ppt corresponds to a single penny in $10,000,000,000 or one minute in 1.9 million years.
pCi/L: Picocuries per liter, a measure of radioactivity.
TON: Threshold Odor Number, a measure of odor.
umho/cm: Micromho per centimeter, a measure of electrical conductivity.
San Jose Water (SJW) proactively began monitoring all of
In concert with the final stages of the Williams treatment
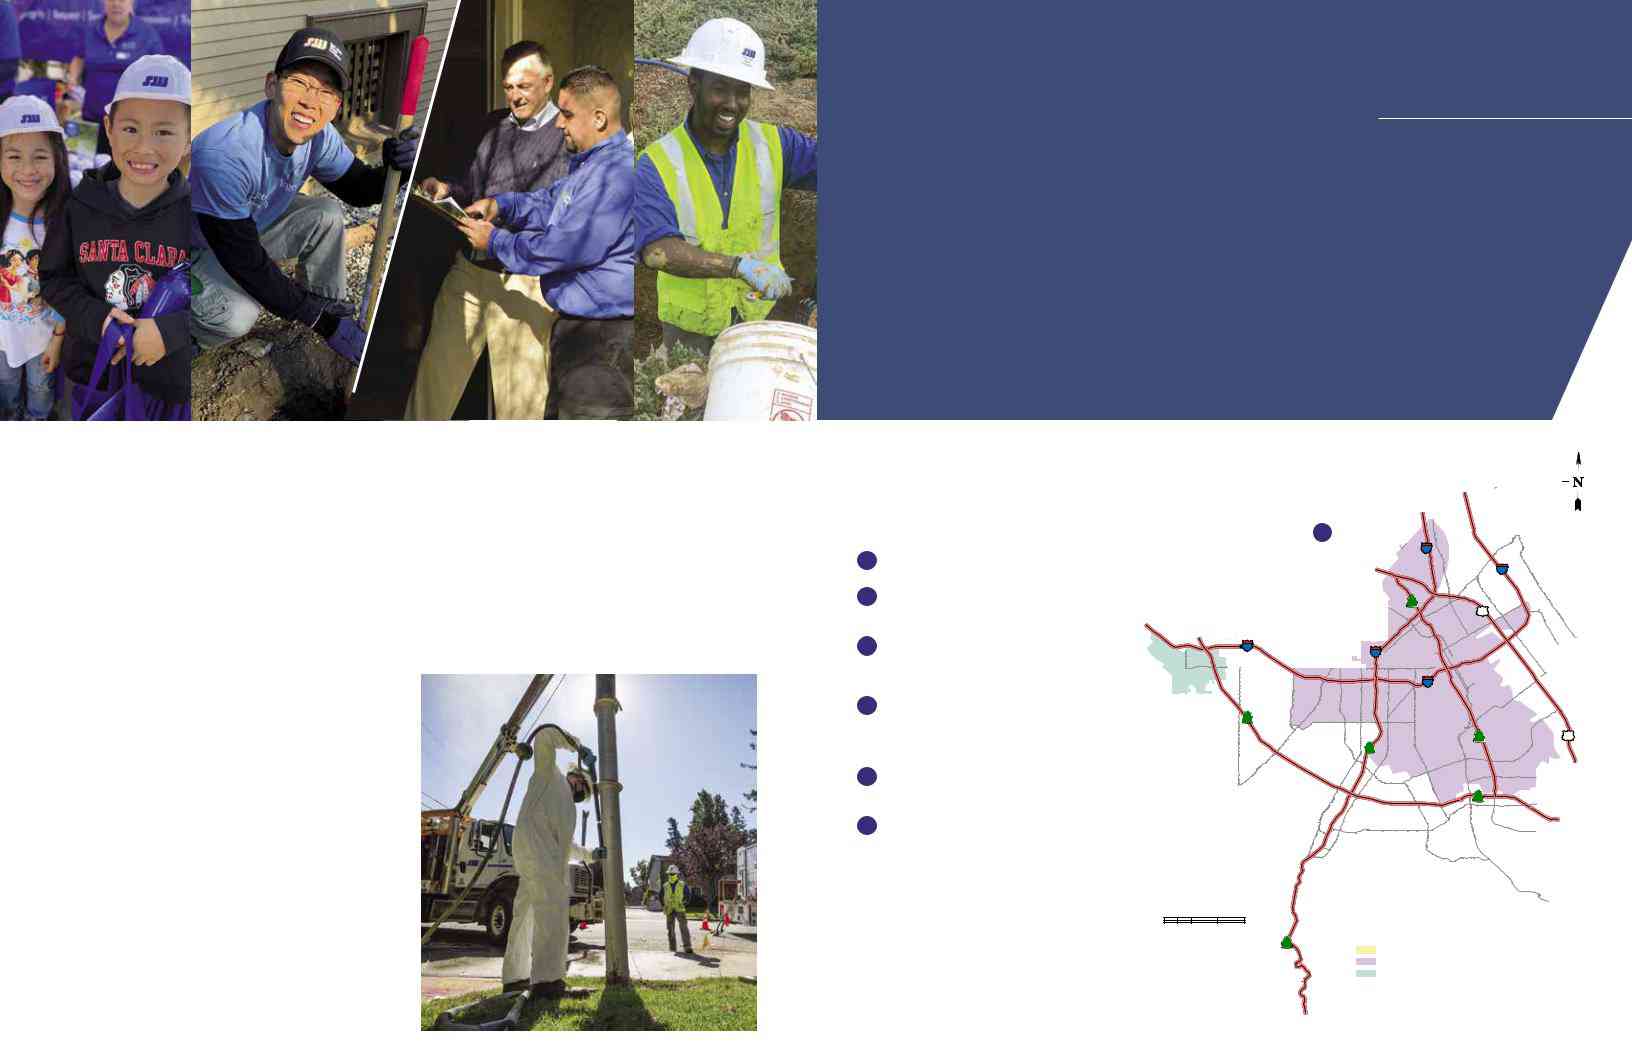
San Jose Water Service Area and Water Supply Sources
our wells for Perfluoroalkylated Substances (PFAS) in 2019, in collaboration with the Division of Drinking Water. This monitoring of PFAS was, and continues to be performed, using a newly promulgated analytical method capable of detecting PFAS at the parts per trillion (ppt) level. To put things in perspective, one part per trillion is equivalent to one penny in ten billion dollars.
This monitoring program led to detection of perfluorooctane sulfonate (PFOS), a PFAS compound, in 10 SJW wells at concentrations near or above the California Notification Level
study, we will be conducting customer surveys and virtual outreach sessions to better understand customer willingness to support possible rate increases that would be necessary to pay for reduced hardness in groundwater. We encourage customers to participate in these workshops and surveys to provide us with input on these potential investments in water quality. PFAS treatment and water softening, like other key investments in our system, are born out of a partnership with both our customers and public health officials, with the goal of providing exceptional quality water.
|
How to Read the Water Quality Table |
1 |
Find your location on the map on this page. Note |
|
which is your source water area. |
2 |
Go to this column in the tables on the following |
|
pages to find the parameter you are interested in. |
|
Remember – no news is good news! |
3 |
This column notes the highest amount that the |
|
State Water Board or the USEPA allows. This |
|
amount is usually not as low as the public health |
F |
|
Bo |
|
lo |
evens |
vt |
|
hSt |
|
di |
eek Bl |
l |
|
vd
|
1 |
|
|
|
|
|
|
O |
|
|
|
|
|
|
|
|
|
|
|
|
|
|
|
|
|
a |
|
|
|
|
|
|
|
|
|
|
|
|
|
|
|
|
880 |
k |
|
|
|
|
|
|
|
|
|
|
|
|
|
|
|
|
a |
|
|
|
|
|
|
|
|
|
|
|
|
|
|
|
|
|
|
l |
|
|
|
|
|
|
|
|
|
|
|
|
|
|
|
|
|
n |
|
|
|
|
|
|
d |
|
|
|
|
|
|
|
|
|
|
d |
|
|
|
|
|
|
|
|
|
|
|
|
|
|
|
|
|
R |
|
|
|
a |
|
R |
|
680 |
|
|
|
|
|
|
|
|
|
d |
|
|
|
|
|
|
Wh |
||
|
|
|
|
|
|
|
|
|
|
|
s |
|
|
|
|
||
|
|
|
|
|
|
|
|
|
|
|
s |
|
|
|
|
|
t |
|
|
|
|
|
|
|
|
|
|
|
e |
|
|
|
|
|
e |
|
|
|
|
|
|
|
|
|
|
ry |
|
|
|
|
|
i |
|
|
|
|
|
|
|
|
|
|
|
r |
|
|
|
|
|
|
|
|
|
|
|
|
|
|
|
|
e |
|
|
|
|
|
|
|
|
|
|
|
|
|
|
|
|
|
B |
|
|
|
|
|
|
|
|
|
|
|
|
|
|
87 |
|
|
|
|
|
|
|
|
|
lu A |
R |
|
|
|
|
|
|
|
|
|
1 |
|
|
|
|
|
|
mv |
d |
|
|
C |
|
|
|
|
|
|
|
|
|
|
|
|
|
||
|
|
|
|
|
|
|
|
3 |
|
|
|
|
|
A k |
|
||
|
|
o |
|
|
|
|
|
t |
|
|
101 |
c |
|
||||
|
|
|
le |
|
|
|
|
h |
|
|
Ro |
C |
|||||
|
|
A |
m |
|
t |
|
|
|
|
|
|
|
|
K |
|
||
|
|
|
a |
|
|
|
|
|
|
|
|
in |
a |
||||
|
|
|
v |
|
n |
S |
|
|
|
|
|
|
|
|
Ep |
||
|
|
|
|
|
|
|
|
|
|
|
|
|
|
|
|
g |
x i |
|
|
|
|
|
|
|
|
|
|
St |
|
|
|
t |
|
t |
|
|
|
|
|
|
|
|
|
|
|
|
|
|
|
y l |
|||
|
|
|
|
|
|
g |
|
M |
|
|
|
|
S |
R |
|
||
|
|
|
|
|
|
|
|
|
|
a |
|
|
|
||||
|
|
|
|
|
in |
|
a |
|
|
|
|
|
d |
|
|||
|
|
|
|
|
|
r |
|
|
|
|
|
|
|
|
|||
|
|
|
|
|
d |
|
e |
|
|
Clar |
|
|
|
|
|
||
|
|
|
|
d |
|
|
St t |
|
|
|
|
|
|
|
|||
|
|
|
e |
|
|
k |
|
a |
|
|
|
|
|
|
|||
|
. - |
|
|
|
|
|
|
|
|
|
|
|
|||||
280 |
|
, |
|
|
|
|
ant |
|
|
|
|
|
|
|
|||
|
H |
|
|
|
|
|
|
|
|
|
|
|
|
||||
|
880 |
|
|
|
|
|
|
S |
|
|
|
|
|
|
|
|
|
|
|
|
|
|
|
|
|
|
|
|
|
|
|
|
|
|
|
|
San |
|
Carlos |
t |
|
l |
|
|
|
|
|
|
|
||||
|
|
S |
im |
|
|
|
|
|
|
|
|||||||
|
|
|
|
|
|
|
|
|
A |
|
|
|
|
|
|
|
|
of 6.5 ppt. We immediately removed these 10 wells from service and notified all impacted customers in writing. The health and safety of our customers is always our top priority.
In late 2020, we awarded a competitive contract to a consultant to study PFAS removal at Williams Groundwater Station. Williams Groundwater Station is a critical facility with
|
goal in the next column. |
4 |
This column lists the public health goal. At that |
|
amount or lower, there is no known or expected |
|
risk to health from the parameters’ presence in |
|
drinking water. Not all listed parameters have state |
|
or federal goals. |
5 |
Find the column that corresponds to the source |
|
water that primarily serves you. This is the amount |
lCr |
Anza De
d R
le va y n nu
|
|
|
y |
|
|
|
w |
d |
|
|
x |
l |
|
|
E |
v |
|
|
|
B |
|
|
e |
|
|
|
|
CUPERTINOe |
|||
|
|
|
c |
|
|
|
n |
|
|
|
r |
85 |
|
|
w |
|
|
L |
|
|
|
|
a |
|
|
|
v |
|
|
|
A |
|
|
|
a |
|
|
g |
|
|
to |
|
|
|
ra |
|
|
a |
|
|
|
S |
SARATOGA |
||
|
|||
S a n
T |
|
|
o |
|
|
Hamilton a Av |
|
|
m |
|
|
s |
Av |
|
CAMPBELL |
||
|
E |
|
|
|
|
|
x |
17 |
|
m |
|
w |
|
||
|
y |
|
|
o |
|
d |
Ba |
s |
c |
lv |
|
|||
|
|
|||
B |
|
|
|
|
|
|
|
|
|
|
|
|
|
|
|
st |
|
|
|
|
|
e |
|
|
|
|
w |
|
y |
|
|
|
th |
|
|
||
|
u |
|
|
w |
||
o |
|
|
x |
|
||
S |
|
|
E |
|
|
|
|
|
|
V |
|
|
|
|
|
|
|
|
|
a |
|
|
|
|
|
|
|
n d |
|
|
|
|
|
|
|
|
|
e |
|
|
|
|
280 |
|
|
|
e n |
|
|
|
|
|
|
|
SAv |
|
|
|
|
|
. - |
|
|
|
|
|
Rd |
||
|
, t |
|
|
y |
||||
|
|
|
|
|
|
|
ll |
|
|
|
|
|
|
|
|
u |
|
SAN JOSE |
|
|
T |
|
||||
|
|
r |
|
|||||
|
|
e |
|
|||||
M |
|
|
|
|
|
tn |
|
|
|
|
|
|
|
r |
|
||
er |
|
|
|
|
C |
u |
v |
|
|
|
|
|
A |
|
|||
i |
|
|
|
|
|
|
|
|
di |
|
|
|
|
87 |
|
xwy |
|
an |
|
|
|
|
|
|||
|
|
|
|
|
|
|
|
E |
A |
|
|
|
v |
|
|
Capitol |
|
v |
|
ale |
A |
|
|
|
|
|
|
sd |
|
|
|
|
|
|
|
ill |
|
|
|
|
|
|
|
|
H |
|
|
|
|
|
|
Br anham Ln |
|
|
|
|
|
|
|
|
||
101
several wells found to have PFOS concentrations above the Notification Level. In addition to investigating the best PFAS treatment options, the study will provide preliminary design layouts and cost estimates for a recommended treatment system. We are also evaluating combining PFAS treatment
|
of the parameter detected in your area’s water. |
6 |
The last column lists how the parameter typically |
gets into your drinking water. |
S
|
|
|
|
|
|
|
|
|
r |
|
|
|
|
|
|
|
|
|
|
|
e |
|
|
|
|
|
|
|
|
|
|
e |
s |
t |
|
|
|
|
|
|
|
|
|
h |
|
|
|
|
s |
||
|
|
|
in |
c |
|
|
|
t |
o |
|||
|
|
|
|
|
|
|
||||||
|
|
|
|
|
|
|
|
|
||||
|
|
|
|
|
|
|
|
|
|
|||
|
|
W |
|
|
|
|
|
|
a |
|
d |
|
|
|
|
|
|
|
|
|
|
|
|||
|
|
|
|
|
|
|
|
|
G lv |
|||
|
|
|
|
|
|
|
|
o |
Blossom |
|||
MONTE SERENO |
|
B |
|
|||||||||
|
|
|
|
|
|
|
|
|
s |
|
|
|
n |
|
A |
|
|
|
|
|
|
L |
|
|
|
|
|
|
|
|
|
LOS GATOS |
||||||
ta |
v |
|
|
|
|
|
|
|
|
|
||
z |
|
|
|
|
|
|
|
|
|
|
||
a |
|
|
|
|
|
|
|
|
|
|
|
|
S |
u |
|
|
|
|
|
|
|
|
|
|
|
r |
|
|
|
|
|
|
|
|
|
|
||
Ma |
C |
|
|
|
|
|
|
|
|
|
|
|
|
St |
|
|
|
|
|
|
|
|
|
||
in |
|
|
|
|
|
|
|
|
|
|||
|
|
|
85 |
|
|
|
|
|
d |
|
T |
|
|
|
|
|
e S |
|
||
|
R |
|
ant |
|||
|
|
|
|
r |
|
|
Hill |
|
|
|
e |
a |
|
|
|
|
|
sa B |
||
|
|
|
|
|
|
lvd |
|
Ca |
|
A |
|
|
|
|
|
|
l |
|
|
|
|
md en |
Av |
m |
|
|
|
|
|
a |
|
|
||
|
|
|
|
d |
|
|
|
|
|
|
e |
|
|
|
|
|
|
|
n |
|
with hardness removal. We recognize that many of our customers are not satisfied with the current aesthetic quality of our groundwater.
The results of
E x w
y
0 |
1 |
2 |
3 |
|
|
|
Miles |
|
|
Scale: 1:138,863 or 1"=11572 |
Legend |
|||
17
Primarily Mountain Surface Water
Primarily Groundwater
Primarily SCVWD Imported Surface Water
Redwood Estates
0 violations in 2020
The State Division of Drinking Water specifies monitoring frequencies for some parameters less often than annually because the concentrations do not change frequently. Some of our data, though representative, are more than a year old.
PRIMARY |
|
|
Primary standards |
|
23 PRESENT |
84 |
TESTED BUT |
||||||||
|
|
relate to public health. |
|
||||||||||||
|
|
|
|
|
|
|
NOT PRESENT |
||||||||
2 |
3 |
4 |
|
|
|
|
|
|
5 |
|
|
|
|
|
6 |
|
|
|
|
|
|
|
|
|
|
|
|||||
|
|
|
|
|
|
|
|
|
|
|
|
|
|
|
|
PARAMETER |
UNITS |
MCL |
PHG |
MOUNTAIN SURFACE WATER |
|
|
GROUNDWATER |
|
VW SURFACE WATER |
TYPICAL |
|||||
|
|
|
OR (MCLG) |
AVERAGE |
RANGE |
|
AVERAGE |
RANGE |
|
AVERAGE |
RANGE |
SOURCES⁺ |
|||
|
|
|
|
|
|
|
|
|
|
|
|
|
|
|
|
SURFACE WATER PRIOR TO TREATMENT |
|
|
|
|
|
|
|
|
|
|
|
|
|
||
|
|
|
|
|
|
|
|
|
|
|
|
|
|
|
|
Asbestos |
MFL |
7 |
7 |
ND |
ND |
|
|
ND |
ND |
|
1.6 |
1.6 |
|
1, 10 |
|
Cryptosporidium |
oocysts/L |
TT |
(0) |
ND |
ND - 0.30 |
|
|
N/A |
N/A |
|
ND |
ND - 0.1 |
|
8 |
|
Giardia |
cysts/L |
TT |
(0) |
ND |
ND - 0.20 |
|
|
N/A |
N/A |
|
ND |
ND - 0.1 |
|
8 |
|
|
|
|
|
|
|
|
|
|
|
|
|
|
|
|
|
SURFACE WATER TREATMENT |
|
|
|
|
|
|
|
|
|
|
|
|
|
|
|
|
|
|
|
|
|
|
|
|
|
|
|
|
|||
|
|
|
|
MAXIMUM |
|
|
MAXIMUM |
|
MAXIMUM |
|
|
||||
|
|
|
|
|
|
|
|
|
|
|
|
|
|
|
|
|
NTU |
TT ≤ 1 NTU |
N/A |
|
0.17 |
|
|
|
N/A |
|
|
0.26 |
|
|
|
Turbidity¹ |
NTU |
TT = 95% of samples |
N/A |
100% |
|
|
|
N/A |
|
100% |
|
9 |
|||
|
|
≤ 0.3 NTU |
|
|
|
|
|
|
|
|
|
|
|
|
|
|
|
|
|
|
|
|
|
|
|
|
|
|
|
|
|
|
|
|
|
|
|
|
|
|
|
|
|
|
|
|
|
ENTRY POINT SAMPLES |
|
|
|
|
|
|
|
|
|
|
|
|
|
|
|
INORGANIC MATERIALS |
|
|
|
AVERAGE |
RANGE |
|
AVERAGE |
RANGE |
|
AVERAGE |
RANGE |
|
|||
|
|
|
|
|
|
|
|
|
|
|
|
|
|
|
|
Aluminum |
ppm |
1 |
0.6 |
ND |
ND |
|
|
ND |
ND |
|
ND |
ND - 0.1 |
|
1, 3 |
|
Arsenic |
ppb |
10 |
0.004 |
ND |
ND - 2.4 |
|
|
ND |
ND - 4.2 |
|
ND |
ND |
|
1, 2, 4 |
|
Barium |
ppm |
1 |
2 |
ND |
ND |
|
0.18 |
ND - 0.34 |
|
ND |
ND |
|
1, 6 |
||
ppb |
N/A |
0.02 |
ND |
ND |
|
2.6 |
ND - 4.5 |
|
ND |
ND |
|
1, 6 |
|||
Fluoride |
ppm |
2 |
1 |
0.14³ |
0.11 - 0.16³ |
|
0.11³ |
ND - 0.14³ |
|
0.75⁴ |
0.4 - 0.9⁴ |
|
1, 6, 11 |
||
Nickel |
ppb |
100 |
12 |
ND |
ND |
|
|
ND |
ND - 12 |
|
ND |
ND |
|
1, 6 |
|
Nitrate (as N) |
ppm |
10 |
10 |
ND |
ND |
|
2.9 |
0.56 - 6.2 |
|
ND |
ND - 0.8 |
|
1, 2 |
||
RADIONUCLIDES |
|
|
|
|
|
|
|
|
|
|
|
|
|
|
|
|
|
|
|
|
|
|
|
|
|
|
|
|
|
|
|
Gross Alpha Activity |
pCi/L |
15 |
(0) |
ND |
ND |
|
|
ND |
ND - 5.6 |
|
ND |
ND |
|
1 |
|
Combined Radium |
pCi/L |
5 |
(0) |
ND |
ND |
|
|
ND |
ND - 2.6 |
|
ND |
ND |
|
1 |
|
Uranium |
pCi/L |
20 |
0.43 |
ND |
ND |
|
|
ND |
ND - 1.3 |
|
1.0 |
1.0 |
|
1 |
|
VOLATILE ORGANIC CHEMICALS |
|
|
|
|
|
|
|
|
|
|
|
|
|
|
|
|
|
|
|
|
|
|
|
|
|
|
|
|
|
|
|
ppb |
200 |
1000 |
ND |
ND |
|
|
ND |
ND - 1.1 |
|
ND |
ND |
|
6 |
||
ppb |
6 |
10 |
ND |
ND |
|
|
ND |
ND - 0.83 |
|
ND |
ND |
|
6 |
||
DISINFECTION BY PRODUCTS |
|
|
|
|
|
|
|
|
|
|
|
|
|
|
|
|
|
|
|
|
|
|
|
|
|
|
|
|
|
|
|
Bromate |
ppb |
10 |
0.1 |
ND |
ND |
|
|
ND |
ND |
|
1.6 |
ND - 7.9 |
7 |
||
SJW DISTRIBUTION SYSTEM SAMPLES |
|
|
|
|
|
|
|
|
|
|
|
|
|
|
|
|
|
|
|
|
|
|
|
|
|
|
|
|
|
|
|
DISINFECTION |
|
MRDL |
MRDLG |
|
|
RUNNING ANNUAL AVERAGE |
|
|
|
|
|||||
Total Chlorine |
ppm |
4.0 as Cl₂ |
4 as Cl₂ |
|
|
|
|
|
1.63 |
|
|
|
|
|
12 |
DISINFECTION BY PRODUCTS |
MCL |
PHG |
|
|
|
|
HIGHEST SITE AVERAGE |
RANGE |
|
||||||
Total Trihalomethanes |
ppb |
80 |
N/A |
Samples Collected at Designated |
55 |
|
|
2.8 - 61 |
|
7 |
|||||
Haloacetic Acids |
ppb |
60 |
N/A |
Sample Points: |
|
|
45 |
|
|
ND - 48 |
|
7 |
|||
MICROBIOLOGICAL CONTAMINANTS |
MCL |
MCLG |
|
|
|
|
|
AVERAGE % |
HIGHEST MONTHLY % |
|
|||||
Coliform Bacteria |
% |
> 5% of monthly |
0 |
Samples Collected at Designated |
0.063% |
|
|
0.27% |
|
8 |
|||||
samples positive |
Sample Points: |
|
|
|
|
|
|||||||||
|
|
|
|
|
|
|
|
|
|
|
|
||||
LEAD AND COPPER |
|
AL |
PHG |
|
|
|
|
90th PERCENTILE LEVEL SITES ABOVE AL |
|
||||||
Lead |
ppb |
15 |
0.2 |
Samples Collected at |
|
|
< 5 |
|
|
|
2 |
|
1, 10 |
||
Copper |
ppm |
1.3 |
0.3 |
Customers' Taps (2019) |
|
|
0.25 |
|
|
0 |
|
1, 10 |
|||
|
SECONDARY |
|
|
|
|
Secondary standards relate to aesthetic |
|
12 PRESENT |
|
6 |
TESTED BUT |
|||||||||||||||||||
|
|
|
|
|
qualities such as taste, odor, and color |
|
|
|||||||||||||||||||||||
|
|
|
|
|
|
but do not pose any health risk. |
|
|
|
NOT PRESENT |
||||||||||||||||||||
|
|
|
|
|
|
|
|
|
|
|
|
|
|
|
|
|
|
|
|
|
|
|
|
|
|
|
|
|
|
|
|
PARAMETER |
UNITS |
|
SMCL |
MOUNTAIN SURFACE WATER |
|
GROUNDWATER |
VW SURFACE WATER |
|
TYPICAL |
|
|||||||||||||||||||
|
|
|
|
|
|
AVERAGE |
|
RANGE |
|
|
AVERAGE |
RANGE |
AVERAGE |
|
|
RANGE |
|
SOURCES⁺ |
|
|||||||||||
|
Aluminum |
ppb |
|
200 |
|
ND |
|
ND |
|
|
|
ND |
|
|
|
ND |
ND |
|
|
|
ND - 51 |
|
1, 3 |
|
||||||
|
Chloride |
ppm |
|
500 |
|
22 |
|
|
20 - 23 |
|
|
50 |
|
|
|
32 - 65 |
61 |
|
|
|
51 - 71 |
|
1, 5 |
|
||||||
|
Color |
CU |
|
15 |
|
5.5 |
|
|
<5 - 9 |
|
|
|
<5 |
|
|
|
<5 - 10 |
<5 |
|
|
|
<5 |
|
8 |
|
|||||
|
Hardness (as CaCO₃) |
ppm |
|
N/A |
|
190 |
|
|
180 - 200 |
|
|
350 |
|
|
190 - 530 |
100 |
|
|
|
84 - 120 |
|
1, 8 |
|
|||||||
|
Hardness (as CaCO₃) |
grains/gal |
|
N/A |
|
11 |
|
|
11 - 12 |
|
|
|
20 |
|
|
|
11 - 29 |
6 |
|
|
|
5 - 7 |
|
1, 8 |
|
|||||
|
Iron |
ppb |
|
300 |
|
ND |
|
ND |
|
|
|
ND |
|
|
ND - 150 |
ND |
|
|
|
ND |
|
1, 4 |
|
|||||||
|
Manganese |
ppb |
|
50 |
|
ND |
|
ND - 66⁵ |
|
|
ND |
|
|
|
ND |
ND |
|
|
|
ND |
|
1 |
|
|||||||
|
Odor - Threshold @ 60°C |
TON |
|
3 |
|
1.3 |
|
|
ND - 7.1⁶ |
|
|
ND |
|
|
|
ND |
ND |
|
|
|
ND |
|
3, 8 |
|
||||||
|
Sodium |
ppm |
|
N/A |
|
25 |
|
|
22 - 26 |
|
|
33 |
|
|
|
18 - 51 |
54 |
|
|
|
43 - 63 |
|
1, 5, 8 |
|
||||||
|
Specific Conductance |
µmho/cm |
|
1600 |
|
480 |
|
|
460 - 490 |
|
|
730 |
|
|
460 - 1100 |
490 |
|
|
|
390 - 530 |
|
1, 5, 8 |
|
|||||||
|
Sulfate |
ppm |
|
500 |
|
45 |
|
|
43 - 46 |
|
|
58 |
|
|
32 - 90 |
58 |
|
|
|
31 - 73 |
|
1, 4 |
|
|||||||
|
Total Dissolved Solids |
ppm |
|
1000 |
|
270 |
|
|
260 - 280 |
|
|
460 |
|
|
280 - 660 |
290 |
|
|
|
140 - 360 |
|
1, 5, 8 |
|
|||||||
|
Turbidity |
NTU |
|
5 |
|
0.12 |
|
|
ND - 0.23 |
|
|
0.43 |
|
|
0.11 - 1.0 |
ND |
|
|
|
ND - 0.26 |
|
9 |
|
|||||||
|
NOTIFICATION |
maximum contaminant levels (MCLs). |
|
|
|
|
|
|
|
|
|
|
|
|
|
|
|
|
TESTED BUT |
|||||||||||
|
|
|
|
|
|
|
|
|
|
|
|
|
|
|
|
|
||||||||||||||
|
|
Notification levels are |
|
|
|
5 |
|
PRESENT |
|
9 |
|
|
|
|
|
|||||||||||||||
|
LEVELS |
|
|
|
|
|
|
|
|
|
|
|
|
|
|
|
|
|
|
NOT PRESENT |
||||||||||
|
|
|
|
|
|
|
|
|
|
|
|
|
|
|
|
|
|
|
|
|
||||||||||
|
|
|
|
|
|
|
|
|
|
|
|
|
|
|
|
|
|
|
|
|
|
|
|
|
|
|
|
|
|
|
|
PARAMETER |
|
UNITS |
|
NL |
|
RL |
|
MOUNTAIN SURFACE WATER |
|
GROUNDWATER |
|
|
|
VW SURFACE WATER |
|
||||||||||||||
|
|
|
|
|
|
|
|
|
|
AVERAGE |
|
RANGE |
|
|
AVERAGE |
RANGE |
|
|
AVERAGE |
RANGE |
|
|||||||||
|
Boron |
|
ppb |
1000 |
|
N/A |
|
|
ND |
|
|
|
ND |
|
|
|
160 |
150 - 160 |
|
|
140 |
|
ND - 210 |
|
||||||
|
Chlorate |
|
ppb |
800 |
|
N/A |
|
|
NS |
|
|
|
NS |
|
|
|
|
NS |
NS |
|
|
|
190 |
|
53 - 480 |
|
||||
|
Perfluorohexanesulfonic acid (PFHxS) |
ppt |
|
N/A |
|
N/A |
|
|
ND |
|
|
|
ND |
|
|
|
ND |
ND - 5.3 |
|
|
ND |
ND |
|
|||||||
|
Perfluorooctyl Sulfonate (PFOS) |
|
ppt |
6.5 |
|
40 |
|
|
ND |
|
|
|
ND |
|
|
|
ND |
ND - 8.0⁷ |
|
|
ND |
ND |
|
|||||||
|
Vanadium |
|
ppb |
50 |
|
N/A |
|
|
ND |
|
|
|
ND |
|
|
|
4.6 |
4.4 - 4.9 |
|
|
ND |
ND - 4 |
|
|||||||
|
UCMR4 |
Unregulated contaminants do not have a drinking water standard set |
|
|
4 |
|
PRESENT |
28 |
TESTED BUT |
|||||||||||||||||||||
|
|
|
|
|||||||||||||||||||||||||||
|
by USEPA. The purpose of monitoring for these contaminants is to help |
|
|
|
||||||||||||||||||||||||||
|
|
EPA decide whether the contaminants should have a standard. |
|
|
|
|
NOT PRESENT |
|||||||||||||||||||||||
|
|
|
|
|
|
|
|
|
|
|
|
|
|
|
|
|
|
|
|
|
|
|
|
|
|
|
|
|
|
|
|
PARAMETER |
UNITS |
|
MOUNTAIN SURFACE WATER |
|
|
GROUNDWATER |
|
|
VW SURFACE WATER |
|
|
|
|
|
|||||||||||||||
|
|
|
|
|
AVERAGE |
RANGE |
|
AVERAGE |
|
RANGE |
|
AVERAGE |
RANGE |
|
|
|
|
|
||||||||||||
|
Manganese (total) |
|
ppb |
|
6.8 |
|
0.84 - 22 |
|
|
<0.4 |
<0.4 - 5.6 |
|
1.4 |
<0.4 - 6.7 |
|
|
|
|
||||||||||||
|
|
|
|
|
|
|
|
|
|
|
|
|
|
|
|
|
|
|
||||||||||||
|
DISINFECTION BYPRODUCTS |
|
|
|
MOUNTAIN SURFACE WATER |
|
DISTRIBUTION SYSTEM |
|
|
|
|
|
|
|
|
|
|
|
||||||||||||
|
|
|
|
AVERAGE |
RANGE |
|
AVERAGE |
|
RANGE |
|
|
|
|
|
|
|
|
|
|
|
||||||||||
|
|
|
|
|
|
|
|
|
|
|
|
|
|
|
|
|
|
|||||||||||||
|
HAA6Br |
|
ppb |
|
3.7 |
3 - 4.8 |
|
|
|
10 |
|
1.4 - 32 |
|
|
6 |
|
|
|
|
|
|
|
||||||||
|
HAA9 |
|
ppb |
|
15 |
|
13 - 18 |
|
|
|
20 |
|
1.4 - 43 |
|
|
|
|
|
|
|
|
|
||||||||
|
|
|
|
|
|
|
|
|
|
|
|
|
|
|
|
|
|
|
||||||||||||
|
Haloacetic Acids |
|
ppb |
|
11 |
|
9.7 - 14 |
|
|
|
12 |
0.66 - 33 |
|
|
+ Typical Sources of Chemical Constituents |
|||||||||||||||
|
|
|
|
|
|
|
|
|
1. |
|
Erosion or leaching of natural deposits |
|||||||||||||||||||
|
|
|
|
|
|
|
|
|
|
|
|
|
|
|
|
|
|
|
|
|
|
|||||||||
|
|
|
|
|
|
|
|
|
|
|
|
|
|
|
|
|
|
|
|
|
2. Runoff and leaching from agriculture |
|||||||||
|
|
|
|
|
|
|
|
|
|
|
|
|
|
|
|
|
|
|
|
|
3. |
Residue from some surface water |
||||||||
|
|
|
|
|
|
|
|
|
|
|
|
|
|
|
|
|
|
|
|
|
|
|
treatment processes |
|
|
|||||
¹ This parameter is only applicable to surface water treatment techniques. |
|
|
|
|
|
|
|
|
|
|
|
|
|
|
4. |
|
Industrial waste |
|
|
|||||||||||
|
|
|
|
|
|
|
|
|
|
|
|
|
|
5. |
|
Seawater influence |
|
|
||||||||||||
² There is currently no MCL for |
|
|
|
|||||||||||||||||||||||||||
no detection limit for reporting. All results less than 1 ppb are considered ND. SJW is continuing to report the sample results for |
6. |
Discharge from factories and metal |
||||||||||||||||||||||||||||
informational purposes. |
|
|
|
|
|
|
|
|
|
|
|
|
|
|
|
|
|
|
|
|
|
degreasing sites |
|
|
||||||
³ Fluoride was not added to these sources. |
|
|
|
|
|
|
|
|
|
|
|
|
|
|
|
|
|
|
7. |
|||||||||||
⁴ State regulations recommend an optimal fluoride level of 0.7 ppm be maintained in fluoridated treated water. Concentrations listed |
||||||||||||||||||||||||||||||
8. |
|
Naturally present in the environment |
||||||||||||||||||||||||||||
here are provided by San Jose Water’s wholesaler. |
|
|
|
|
|
|
|
|
|
|
|
|
|
|
|
|
|
|
||||||||||||
⁵ Compliance is determined by running average which remained below the SMCL level |
|
|
|
|
|
|
|
|
|
|
|
|
9. |
|
Soil erosion and stream sediments |
|||||||||||||||
⁶ The high end of the range is comprised of a single sample. SJW was unable to do a followup sample because the plant went offline |
10. Internal corrosion of plumbing systems |
|||||||||||||||||||||||||||||
shortly after it was taken. There were no related taste and odor complaints for customers served by that source. |
|
|
|
|
|
|||||||||||||||||||||||||
|
|
|
|
|
11. |
Water additive for promotion of public |
||||||||||||||||||||||||
⁷ Wells above the notification level were removed from service and put into standby. SJW stopped serving water after those results |
||||||||||||||||||||||||||||||
were received. All customers who may have received water from these wells were notified directly by mail. |
|
|
|
|
|
|
|
|
health |
|
|
|||||||||||||||||||
12. Disinfectant for water treatment
WATER QUALITY GUIDANCE
Lead
In order to ensure that tap water is safe to drink, the U.S. Environmental Protection Agency (USEPA) and the State Water Resources Control Board (State Board) prescribe regulations that limit the amount of certain contaminants in water provided by public water systems. State Board regulations also establish limits for contaminants in bottled water that provide the same protection for public health. If present, elevated levels of lead can cause serious health problems, especially for pregnant women and young children. Lead in drinking water is primarily from materials and components associated with service lines and home plumbing. San Jose Water is responsible for providing high quality drinking water, but cannot control the variety of materials used in plumbing components. When your water has been sitting for several hours, you can minimize the potential for lead exposure by flushing your tap for 30 seconds to 2 minutes before using water for drinking or cooking. If you do so, you may wish to collect the flushed water and reuse it for another beneficial purpose, such as watering plants. If
Fluoride
For information on fluoride in your water, please refer to our website at
Nitrate
Nitrate as Nitrogen
Turbidity
Source Water Assessment
An original assessment of the drinking water sources for SJW’s water system was completed in December 2002 and is updated as new wells are brought online. SJW’s wells are considered most vulnerable to one or more of the following activities, which have not been associated with any contaminants detected in the water supply: dry cleaners, automobile gas stations and repair shops, and underground storage tanks. Some of SJW’s wells are also considered vulnerable to metal plating and finishing, photo processing/ printing, electrical/electronics manufacturing, chemical/ petroleum processing/storage, known contaminant plumes, and plastics/synthetics producers. SJW’s surface supplies are considered most vulnerable to low density septic systems. Imported surface water purchased from Valley Water is considered most vulnerable to a variety of land use practices, such as agricultural and urban runoff, recreational activities, livestock grazing, as well as residential and industrial development. In addition, local sources are vulnerable to potential contamination from commercial stables and historic mining practices. Although these activities exist in areas near one or more of SJW’s or Valley Water sources, physical barriers, treatment systems, and monitoring programs are in place to ensure that water supplied to our customers is not adversely affected. Customers seeking additional information are encouraged to contact SJW Customer Service at 408.279.7900.
Special Populations
Some people may be more vulnerable to contaminants in drinking water than the general population. Immuno- compromised persons such as persons with cancer undergoing chemotherapy, persons who have undergone organ transplants, people with HIV/AIDS or other immune system disorders, some elderly, and infants can be particularly at risk from infections. These people should seek advice about drinking water from their health care providers. USEPA/ Centers for Disease Control (CDC) guidelines on appropriate
means to lessen the risk of infection by Cryptosporidium and other microbial contaminants are available from the Safe Drinking Water Hotline
Drinking Water Regulation
Drinking water, including bottled water, may reasonably be expected to contain at least small amounts of some contaminants. The presence of contaminants does not necessarily indicate that water poses a health risk. More information about contaminants and potential health effects can be obtained by calling the USEPA’s Safe Drinking Water Hotline
Contaminants that may be present in source water include:
- Microbial contaminants, such as viruses and bacteria, which may come from sewage treatment plants, septic systems, agricultural livestock operations, and wildlife.
-
Inorganic contaminants, such as salts and metals, that can be
naturally-occurring or result from urban stormwater runoff, industrial or domestic wastewater discharges, oil and gas production, mining, or farming. - Pesticides and herbicides that may come from a variety of sources such as agriculture, urban stormwater runoff, and residential uses.
- Organic chemical contaminants, including synthetic and volatile organic chemicals, that are byproducts of industrial processes and petroleum production, and can also come from gas stations, urban stormwater runoff, agricultural application, and septic systems.
-
Radioactive contaminants, that can be
naturally-occurring or be the result of oil and gas production and mining activities.
you are concerned about lead in your water, you may wish to have your water tested. Information on lead in drinking water, testing methods, and steps you can take to minimize exposure is available from the Safe Drinking Water Hotline or at http://www.epa.gov/lead.
Lead sampling in the system
Data from the 2019 round of Lead and Copper Rule (LCR) sampling can be found in the Primary Standards table under Lead and Copper. To make LCR sampling as meaningful as possible, SJW worked with the state Division of Drinking Water and an outside consultant to identify the areas of highest risk for lead exposure from drinking water in our system. Compliance is determined by the 90th percentile of sample results. The 90th percentile for SJW’s 2019 lead results was below the lead detection limit, and both lead and copper results met regulatory standards.If you have reason for concern about lead containing fixtures in your home, please feel free to contact us at (408)
Lead Sampling in Schools
In January 2018, Assembly Bill 746 went into effect requiring water utilities to collect lead samples in all daycare, preschool and kindergarten through 12th grade schools on public property to ensure students have access to safe drinking water. If a private school wished to have their water sampled, the head of the school could request lead testing from their water provider. The timeframe for sample collection ended in July of 2019. Over the span of the program, San Jose Water sampled 330 schools in our area, including all schools that requested sampling. Of the schools assessed, four initially had a result above the action level, but each was promptly resolved through corrective actions. For more information about sampling in your child’s school, contact your school officials or check out the website at: https://www.waterboards.ca.gov/drinking_water/certlic/ drinkingwater/leadsamplinginschools.html.
Turbidity is a measure of the cloudiness of the water. We monitor it because it is a good indicator of the effectiveness of our filtration systems.
Reminder for Dialysis Patients and Aquarium Owners
Chloramine and chlorine may be present in the water provided by SJW. These chemicals are used to protect public health by destroying
To Learn More about the Quality of Your Water
Your drinking water is continually tested to ensure compliance with state and federal standards for quality and safety. This annual report summarizes the results of more than 18,000 water quality tests conducted throughout the year. If you have any questions about your water quality, service, or the information contained in this report, please call us at 408.279.7900, Monday to Friday between 8:30AM and 5:30PM. You may also contact the US EPA Safe Drinking Water Hotline at 800.426.4791 for additional public information about the Safe Drinking Water Act or US EPA’s drinking water regulatory programs.
San Jose Water Company
110 West Taylor St., San Jose, CA 95110 customer_service@sjwater.com
-
279-7900 • www.sjwater.com
Se Habla Español
At your service since 1866
Drinking Water Information on the Internet
Detailed information about specific drinking water topics is available on the Internet Visit our web site or any other of those listed below to find out more about water treatment, quality, and current regulations.
San Jose Water |
SWRCB Division of Drinking Water |
http://www.sjwater.com |
https://www.waterboards.ca.gov/drinking_water/programs/ |
Valley Water |
United States Environmental Protection Agency |
http://www.valleywater.org |
|
American Water Works Association |
|
http://www.awwa.org |
|
This report contains important information about your drinking water. Please contact San Jose Water at 408.279.7900 for assistance.
This report is being sent to you in compliance with the Safe Drinking Water Act. Landlords, businesses and schools are encouraged to share this report with non- billed water customers at their locations. Additional copies are available free of charge by calling our office.
Este informe contiene información muy importante sobre su agua para beber. Favor de comunicarse San Jose Water a 408.279.7900 para asistirlo en español. Se le está enviando este informe en conformidad con la Ley de Agua Potable Segura. Se alienta a los propietarios, negocios y escuelas a compartir este informe con los usuarios a los que no se cobra el agua en sus centros. Llame a nuestra oficina para obtener más copias sin costo.
Báo cáo này chứa thông tin quan trọng về nước uống của bạn. Xin vui lòng liên hệ San
Jose Water tại 408.279.7900 để được trợ giúp bằng tiếng Việt.
這份報告含有關於您的飲用水的重要訊息。請用以下地址和電話聯繫 San Jose Water 以獲得中文的幫助: 408.279.7900.
Contaminants
San Jose Water Company
EWG's drinking water quality report shows results of tests conducted by the water utility and provided to the Environmental Working Group by the California State Water Resources Control Board, as well as information from the U.S. EPA Enforcement and Compliance History database (ECHO). For the latest quarter assessed by the U.S. EPA (January 2019 - March 2019), tap water provided by this water utility was in compliance with federal health-based drinking water standards.
Utility details
- Serves: 998000
- Data available: 2012-2017
- Data Source: Surface water
- Total: 30
Contaminants That Exceed Guidelines
- Bromodichloromethane
- Bromoform
- Chloroform
- Chromium (hexavalent)
- Dibromochloromethane
- Dichloroacetic acid
- Nitrate
- Nitrate and nitrite
- Radium%2C combined (-226 & -228)
- Total trihalomethanes (TTHMs)
- Trichloroacetic acid
Other Detected Contaminants
- 1%2C1%2C1-Trichloroethane
- 1%2C1-Dichloroethylene
- 1%2C4-Dioxane
- Aluminum
- Barium
- Chlorate
- Chromium (total)
- Dibromoacetic acid
- Fluoride
- Haloacetic acids (HAA5)
- Manganese
- Molybdenum
- Monobromoacetic acid
- Monochloroacetic acid
- Selenium
- Strontium
- Styrene
- Uranium
- Vanadium
Reminder
Always take extra precautions, the water may be safe to drink when it leaves the sewage treatment plant but it may pick up pollutants during its way to your tap. We advise that you ask locals or hotel staff about the water quality. Also, note that different cities have different water mineral contents.
Sources and Resources
Sources Cited
Additional Resources
Can you Drink Tap Water in San Jose?
Yes, San Jose's tap water is generally considered safe to drink as it met the EPA’s water quality mandates according to the city’s largest provider, San Jose Water Company’s 2020 water quality report. From April 1, 2018 to June 30, 2021 San Jose Water Company has had no Safe Drinking Water Act Violations. One should not get sick from drinking San Jose tap water.
Though San Jose's tap water is generally safe to drink, one should consider the possible safety impacts of low levels of regulated contaminants, unregulated contaminants, and water quality issues caused by severe weather.
While San Jose's tap water is generally safe to drink, long-term residents may consider using water filters for their everyday drinking, as the EPA is still assessing the health impacts of long-term exposure to certain contaminants that they do not yet have regulations for, and long term exposure to certain contaminants which are already regulated, but below the currently acceptable levels.
Where Does San Jose Tap Water Come From?
The City of San Jose has multiple water service providers, the largest being the San Jose Water company which, according to its water supply FAQ gets its was from:
Groundwater
This water is pumped from over 100 wells that draw water from the Santa Clara Groundwater Basin. Groundwater accounts for approximately 40% of San Jose Water Company’s supply.
Imported surface water
Imported surface water is provided by the Santa Clara Valley Water District (SCVWD), our wholesale supplier. Surface water imported from the Sacramento-San Joaquin Delta and purchased from the Santa Clara Valley Water district accounts for approximately 50% of our supply. A majority of this water originates as Sierra snowmelt and travels through the state and federal water projects before treatment at SCVWD's three water treatment plants. A smaller portion is impounded in local reservoirs in Santa Clara County. More information about the imported water supply and treatment can be found on the SCVWD website.
Local mountain surface water
Collected on their watershed in the Santa Cruz Mountains, and treated it at their two water treatment plants. Local surface water accounts for approximately 10% of San Jose Water Company’s supply.
Main Contaminants Found in San Jose Tap Water
As we mentioned above, San Jose tap water meets the requirements set by the EPA. For more precise information please see San Jose Water Company’s 2020 water quality report (Please note there are other water providers in San Jose, so some locations may not get their water from this source). Though San Jose drinking water meets EPA standards that does not mean it is contaminant free as there are levels that the EPA considers acceptable. Though the EPA regulated contaminants must meet a certain threshold for the city’s water to be deemed acceptable, many are still present in the drinking water at some level. The EPA continues to evaluate the long term impacts of these chemicals as more research is available. For example, the rules around arsenic, as well as, lead and copper are currently being re-evaluated.
Additionally, there are a number of “emerging†contaminants that the EPA has not determined acceptable levels for and is currently researching. For example, Per- and polyfluoroalkyl substances (PFAS), for which the EPA has issued a health advisory. PFAS are also called ‘forever chemicals’ since they tend not to break down in the environment or the human body and can accumulate over time. We do not yet fully understand the dangers of PFAS as they are currently being investigated. San Jose has closed multiple wells as a precaution against PFAS, so there is potential that they could have made their way into San Jose's drinking water.
Lead piping is another potential source of contamination for many homes, both through service lines and in your home. The National Resource Defense Council has a great walk-through on how to determine if you may have lead service lines.
So while San Jose's tap water does meet the requirements set by the EPA, it still makes sense to try to purify the tap water further to reduce contaminants to lower levels.
Can you Drink Tap Water in San Jose?
Yes, San Jose’s tap water is generally considered safe to drink as it met the EPA’s water quality mandates according to the city’s largest provider, San Jose Water Company’s 2020 water quality report. From April 1, 2018 to June 30, 2021 San Jose Water Company has had no Safe Drinking Water Act Violations. One should not get sick from drinking San Jose tap water.
Though San Jose’s tap water is generally safe to drink, one should consider the possible safety impacts of low levels of regulated contaminants, unregulated contaminants, and water quality issues caused by severe weather.
While San Jose’s tap water is generally safe to drink, long-term residents may consider using water filters for their everyday drinking, as the EPA is still assessing the health impacts of long-term exposure to certain contaminants that they do not yet have regulations for, and long term exposure to certain contaminants which are already regulated, but below the currently acceptable levels.
Where Does San Jose Tap Water Come From?
The City of San Jose has multiple water service providers, the largest being the San Jose Water company which, according to its water supply FAQ gets its was from:
Groundwater
This water is pumped from over 100 wells that draw water from the Santa Clara Groundwater Basin. Groundwater accounts for approximately 40% of San Jose Water Company’s supply.
Imported surface water
Imported surface water is provided by the Santa Clara Valley Water District (SCVWD), our wholesale supplier. Surface water imported from the Sacramento-San Joaquin Delta and purchased from the Santa Clara Valley Water district accounts for approximately 50% of our supply. A majority of this water originates as Sierra snowmelt and travels through the state and federal water projects before treatment at SCVWD’s three water treatment plants. A smaller portion is impounded in local reservoirs in Santa Clara County. More information about the imported water supply and treatment can be found on the SCVWD website.
Local mountain surface water
Collected on their watershed in the Santa Cruz Mountains, and treated it at their two water treatment plants. Local surface water accounts for approximately 10% of San Jose Water Company’s supply.
Main Contaminants Found in San Jose Tap Water
As we mentioned above, San Jose tap water meets the requirements set by the EPA. For more precise information please see San Jose Water Company’s 2020 water quality report (Please note there are other water providers in San Jose, so some locations may not get their water from this source). Though San Jose drinking water meets EPA standards that does not mean it is contaminant free as there are levels that the EPA considers acceptable. Though the EPA regulated contaminants must meet a certain threshold for the city’s water to be deemed acceptable, many are still present in the drinking water at some level. The EPA continues to evaluate the long term impacts of these chemicals as more research is available. For example, the rules around arsenic, as well as, lead and copper are currently being re-evaluated.
Additionally, there are a number of “emerging” contaminants that the EPA has not determined acceptable levels for and is currently researching. For example, Per- and polyfluoroalkyl substances (PFAS), for which the EPA has issued a health advisory. PFAS are also called ‘forever chemicals’ since they tend not to break down in the environment or the human body and can accumulate over time. We do not yet fully understand the dangers of PFAS as they are currently being investigated. San Jose has closed multiple wells as a precaution against PFAS, so there is potential that they could have made their way into San Jose’s drinking water.
Lead piping is another potential source of contamination for many homes, both through service lines and in your home. The National Resource Defense Council has a great walk-through on how to determine if you may have lead service lines.
So while San Jose’s tap water does meet the requirements set by the EPA, it still makes sense to try to purify the tap water further to reduce contaminants to lower levels.