Table of Contents
Can You Drink Tap Water in Santa Monica?
Yes, Santa Monica's tap water is generally considered safe to drink as Santa Monica has no active health based violations of the Safe Drinking Water Act (SDWA) that we are aware of. Other factors such as lead piping in a home, or low levels of pollutants on immunocompromised individuals, should also be considered, however. To find more recent info we might have, you can check out our boil water notice page or the city's water provider website.
According the EPA’s ECHO database, from April 30, 2019 to June 30, 2022, Santa Monica's water utility, Santa Monica-City, Water Division, had 0 violations of the Safe Drinking Water Act. For more details on the violations, please see our violation history section below. This assessment is based on the Santa Monica-City, Water Division water system, other water systems in the city may have different results.
While tap water that meets the EPA health guidelines generally won’t make you sick to your stomach, it can still contain regulated and unregulated contaminants present in trace amounts that could potentially cause health issues over the long-run. These trace contaminants may also impact immunocompromised and vulnerable individuals.
The EPA is reviewing if it’s current regulations around pollutant levels in tap water are strict enough, and the health dangers posed by unregulated pollutants, like PFAS.
Water Quality Report for Santa Monica Tap Water
The most recent publicly available numbers for measured contaminant levels in Santa Monica tap water are in its 2020 Water Quality Report. As you can see, there are levels which the EPA considers to be acceptable, but being below the maximum allowable level doesn’t necessarily mean the water is healthy.
Lead in tap water, for example, is currently allowed at up to 15ppb by the EPA, but it has set the ideal goal for lead at zero. This highlights how meeting EPA standards doesn’t necessarily mean local tap water is healthy.
EPA regulations continue to change as it evaluates the long term impacts of chemicals and updates drinking water acceptable levels. The rules around arsenic, as well as, lead and copper are currently being re-evaluated.
There are also a number of "emerging" contaminants that are not currently. For example, PFAS (Per- and polyfluoroalkyl substances), for which the EPA has issued a health advisory. PFAS are called "forever chemicals" since they tend not to break down in the environment or the human body and can accumulate over time.
We recommend looking at the contaminants present in Santa Monica's water quality reports, or getting your home's tap water tested to see if you should be filtering your water.
Santa Monica Tap Water Safe Drinking Water Act Violation History - Prior 10 Years
Below is a ten year history of violations for the water system named Santa Monica-City, Water Division for Santa Monica in California. For more details please see the "What do these Violations Mean?" section below.
Is there Lead in Santa Monica Water?
Based on the EPA’s ECHO Database, 90% of the samples taken from the Santa Monica water system, Santa Monica-City, Water Division, between sample start date and sample end date, were at or below, 0.0023 mg/L of lead in Santa Monica water. This is 15.3% of the 0.015 mg/L action level. This means 10% of the samples taken from Santa Monica contained more lead.
While Santa Monica water testing may have found 0.0023 mg/L of lead in its water, that does not mean your water source has the same amount. The amount of lead in water in a city can vary greatly from neighborhood to neighborhood, or even building to building. Many buildings, particularly older ones, have lead pipes or service lines which can be a source of contamination. To find out if your home has lead, we recommend getting you water tested.
No amount of lead in water is healthy, only less dangerous. As lead accumulates in our bodies over time, even exposure to relatively small amounts can have negative health effects. For more information, please check out our Lead FAQ page.
Are there PFAS in Santa Monica Tap Water?
Currently, testing tap water for PFAS isn’t mandated on a national level. We do have a list of military bases where there have been suspected or confirmed leaks. There appears to be at least one military base - DFSP San Pedro - near Santa Monica with suspected leaks.
With many potential sources of PFAS in tap water across the US, the best information we currently have about which cities have PFAS in their water is this ewg map, which you can check to see if Santa Monica has been evaluated for yet.
Our stance is better safe than sorry, and that it makes sense to try to purify the tap water just in case.
What do these Violations Mean?
Safe Drinking Water Act Violations categories split into two groups, health based, and non-health based. Generally, health based violations are more serious, though non-health based violations can also be cause for concern.
Health Based Violations
- Maximum contaminant levels (MCLs) - maximum allowed contaminant level was exceeded.
- Maximum residual disinfectant levels (MRDLs) - maximum allowed disinfectant level was exceeded.
- Other violations (Other) - the exact required process to reduce the amounts of contaminants in drinking water was not followed.
Non-Health Based Violations
- Monitoring and reporting violations (MR, MON) - failure to conduct the required regular monitoring of drinking water quality, and/or to submit monitoring results on time.
- Public notice violations (Other) - failure to immediately alert consumers if there is a serious problem with their drinking water that may pose a risk to public health.
- Other violations (Other) - miscellaneous violations, such as failure to issue annual consumer confidence reports or maintain required records.
SDWA Table Key
| Field | Description |
|---|---|
| Compliance Period | Dates of the compliance period. |
| Status |
Current status of the violation.
|
| Health-Based? | Whether the violation is health based. |
| Category Code |
The category of violation that is reported.
|
| Code | A full description of violation codes can be accessed in the SDWA_REF_CODE_VALUES (CSV) table. |
| Contaminant Code | A code value that represents a contaminant for which a public water system has incurred a violation of a primary drinking water regulation. |
| Rule Code |
Code for a National Drinking Water rule.
|
| Rule Group Code |
Code that uniquely identifies a rule group.
|
| Rule Family Code |
Code for rule family.
|
For more clarification please visit the EPA's data dictionary.
Santa Monica Water - Frequently Asked Questions
| By Phone: | 310-458-5688 |
| By Email: | sunny.wang@smgov.net |
| By Mail: | 1212 5TH STREET SANTA MONICA, CA, 90401 |
Existing customers can login to their Santa Monica-City, Water Division account to pay their Santa Monica water bill by clicking here.
If you want to pay your Santa Monica-City, Water Division bill online and haven't made an account yet, you can create an account online. Please click here to create your account to pay your Santa Monica water bill.
If you don't want to make an account, or can't remember your account, you can make a one-time payment towards your Santa Monica water bill without creating an account using a one time payment portal with your account number and credit or debit card. Click here to make a one time payment.
Moving to a new house or apartment in Santa Monica means you will often need to put the water in your name with Santa Monica-City, Water Division. In order to put the water in your name, please click the link to the start service form below. Start service requests for water bills typically take two business days.
Leaving your house or apartment in Santa Monica means you will likely need to take your name off of the water bill with Santa Monica-City, Water Division. In order to take your name off the water bill, please click the link to the stop service form below. Stop service for water bills requests typically take two business days.
The estimated price of bottled water
$2.07 in USD (1.5-liter)
USER SUBMITTED RATINGS
- Drinking Water Pollution and Inaccessibility
- Water Pollution
- Drinking Water Quality and Accessibility
- Water Quality
The above data is comprised of subjective, user submitted opinions about the water quality and pollution in Santa Monica, measured on a scale from 0% (lowest) to 100% (highest).
Related FAQS
Santa Monica Water Quality Report (Consumer Confidence Report)
The EPA mandates that towns and cities consistently monitor and test their tap water. They must report their findings in an annual Consumer Confidence Report. Below is the most recent water quality report from Santa Monica's Water. If you would like to see the original version of the report, please click here.
Water Resources Division
2021 Annual
Water Quality
Report
Conserving Our Most Precious Resource...Water.
TO DOWNLOAD THIS REPORT, VISIT
WATERQUALITY. SMGOV. NET
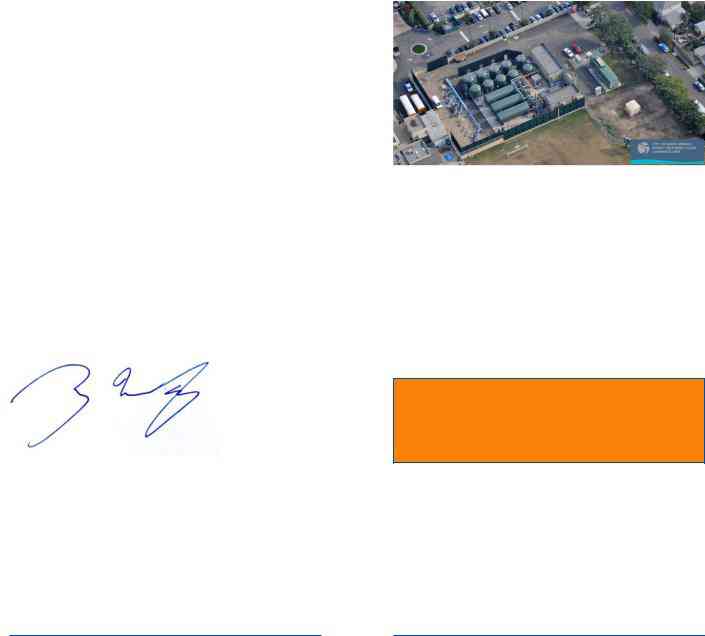
Dear Community Members,
The City of Santa Monica is committed to providing safe and clean drinking water to our residents. On behalf of the City, I am pleased to present this Annual Drinking Water Quality Report which provides a summary of water quality data for 2020, and report that Santa Monica water once again met or exceeded all state and federal drinking water standards.
The City’s Water Resources Division objective is to continue providing sustainable, clean and healthy drinking water for its residents today and for the future. Throughout the year, our staff works to provide and maintain
In addition to ensuring safe and clean water, we are also devoted to meeting your water needs in the face of climate change. Water conservation has been
a priority for the city and has done an amazing job conserving water and decreasing our reliance on imported water. To ensure reliable water delivery to our residents, we continue to invest in the City’s water system to prevent infrastructure failures and have a diversified drought resilient water supply portfolio. On behalf of the City of Santa Monica Public Works Department and the employees of the Water Resources Division, thank you for allowing us to serve you.
Sincerely,
Sunny Wang
Water Resources Manager
The City of Santa Monica Water Resources Division values transparency, we hope that you find this report clear and easy to understand. If you have any questions, please call us at (310)
El Departamento de Recursos de Agua de la ciudad de Santa Monica valora una gestión transparente; por consiguiente, esperamos que encuentre este informe claro y fácil de entender. Si usted tiene alguna pregunta, por favor comuníquese al (310)
Santa Monica’s Water Source And Treatment System
The City of Santa Monica currently obtains up to 75% of its water from local groundwater wells within the City and in West Los Angeles. The City extracts its water from three
Charnock Well Field and Charnock Treatment Plant
Over 20 years ago, Methyl
TO PUT THESE UNITS INTO CONTEXT:
• One part per billion (ppb) = 1 second in 31.7 years
- 1 teaspoon in 1.3 million gallons
- One part per million (ppm) = 1 second in 11.6 days
- 1 teaspoon in 1,302 gallons
The treated water from the Charnock Well Field is then sent to the Arcadia Treatment Plant, and along the way it blends with water from the Olympic and Arcadia
Softening is the process of removing
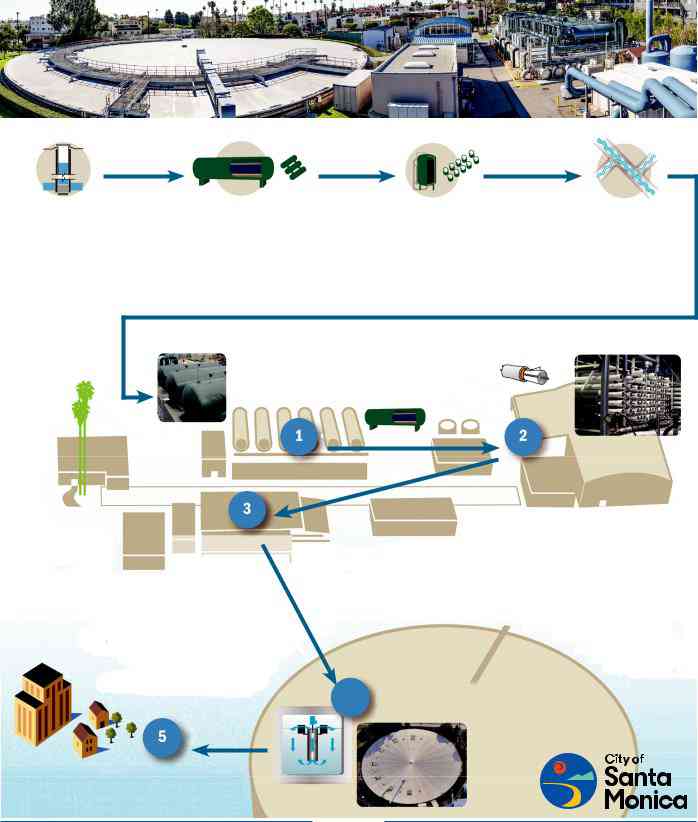
SANTA MONICA WATER TREATMENT PROCESS
Charnock Well Field |
Greensand Filtration |
GAC Filtration |
Pump to |
|
Charnock Wells Groundwater |
The well water is filtered |
The MTBE is removed by |
Treatment Plant |
|
contaminated with the |
through greensand media |
filtering through |
The filtered water is combined |
|
gasoline additive MTBE is |
to remove iron and |
Granular Activated Carbon |
||
with the flow of other wells and |
||||
pumped up from 400 feet |
manganese which would |
(GAC) filters. |
||
pumped to the Santa Monica |
||||
below ground surface. |
foul the carbon filters. |
|
||
|
Water Treatment Plant. |
|||
|
|
|
Santa Monica
Water Treatment
Plant
Pretreatment
To protect the sensitive Reverse Osmosis (RO) filters, the combined well flow is filtered again through greensand and cartridge filters to remove more
iron, manganese and any remaining sediment.
REVERSE OSMOSIS FILTRATION
Water Quality
Adjustments
The mineral content is adjusted to the desired softness. The pH is adjusted, fluoride is added and the water undergoes final disinfection
with chloramine.
Reverse Osmosis Filtration
Filtration through a
(RO) membrane system softens the water by removing minerals (calcium and magnesium). Reverse Osmosis uses pressure to force water through membranes with pores so small the minerals can’t pass through.
Aeration and Storage
The final step, aeration, uses the existing
4 air stripping technology in the five million gallon reservoir to remove any remaining volatile
groundwater contaminants
such as trichloroethene.
Final Delivery
Santa Monica residents and businesses receive water for everyday use. Water conservation by end users is key to ensuring water reliability and sustainability.
Reverse Osmosis performs softening by forcing hard water through membranes with very small pores, sized from 0.0001 - 0.001 micrometers. The complete treatment process is further outlined on the following pages.
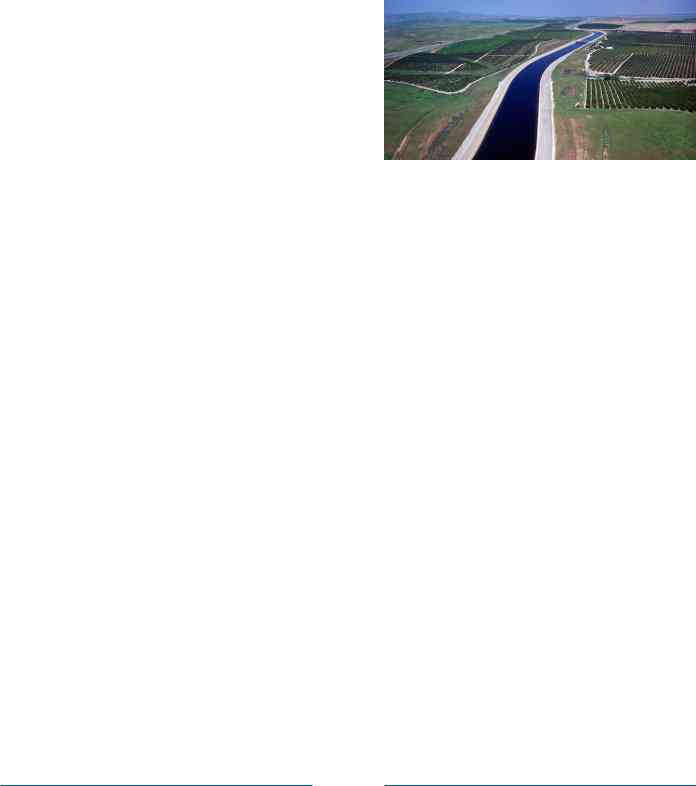
The remaining 25% of Santa Monica’s drinking water is purchased from Metropolitan Water District (MWD). Treated MWD water is blended with our locally produced water, and then distributed to our residents. MWD imports water from two separate sources. One is the Colorado River water, which is delivered from Lake Havasu through a
Background on
Drinking Water Contaminants
The sources of drinking water (both tap water and bottled water) include rivers, lakes, streams, ponds, reservoirs, springs, and wells. As water travels over the surface of the land or through the ground, it dissolves
- Microbial contaminants, such as viruses and bacteria, that may come from sewage treatment plants, septic systems, agricultural livestock operations, and wildlife.
-
Inorganic contaminants, such as salts and metals, that can be
naturally-occurring or result from urban stormwater runoff, industrial or domestic wastewater discharges, oil and gas production, mining, or farming.** - Pesticides and herbicides that may come from a variety of sources such as agriculture, urban stormwater runoff, and residential uses.
-
Organic chemical contaminants, including synthetic and volatile organic chemicals, that are
by-products of industrial processes and petroleum production, and can also come from gas stations, urban stormwater runoff, agricultural application, and septic systems. - Radioactive contaminants, that can be naturally- occurring or be the result of oil and gas production and mining activities.
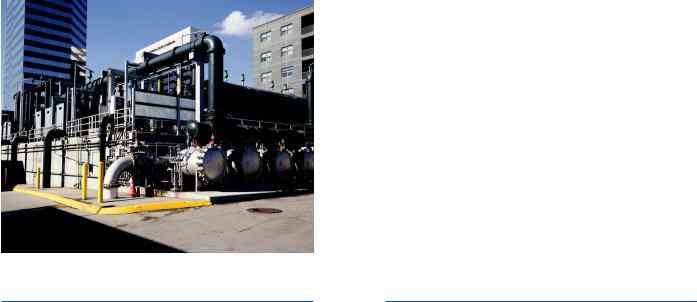
Photo of the California Aqueduct by the Department of Water Resources.
In order to ensure that tap water is safe to drink, the U.S. Environmental Protection Agency (U.S. EPA) and the California State Water Resources Control Board (State Board) prescribe regulations that limit the concentration of certain contaminants in water provided by public water systems. State Board regulations also establish limits for contaminants in bottled water that provide the same protection for public health.
Drinking water, including bottled water, may reasonably be expected to contain at least small amounts of some contaminants. The presence of contaminants does not necessarily indicate that water poses a health risk. More information about contaminants and potential health effects can be obtained by calling the U.S. EPA’s Safe Drinking Water Hotline (800)
Some people may be more vulnerable to contaminants in drinking water than the general population. Immuno- compromised persons such as persons with cancer undergoing chemotherapy, persons who have undergone organ transplants, people with HIV/AIDS or other immune system disorders, some elderly people, and infants can be particularly at risk of infections. These people should seek advice about drinking water from their health
care providers. U.S. EPA and Centers for Disease Control (CDC) guidelines on appropriate means to lessen the risk of infection by Cryptosporidium and other microbial contaminants are available from the Safe Drinking Water Hotline (800)
You can help protect source water purity by controlling what enters storm drains. The following sites provide guides on how you can protect Drinking Water Sources:
Information on environmentally friendly products is available at www.sustainablesm.org/buygreen
To report storm drain pollution, please contact the City’s Wastewater Department. See back cover for contact information.
Source Water Vulnerability Assessments
Between 2000 and 2012, the California State Water Resources Control Board, Division of Drinking Water (DDW) completed Source Water Vulnerability Assessments for all the City’s groundwater wells. The assessments are required for all water utilities nationwide to evaluate the vulnerability of drinking water sources for “possible contaminating activities.” Vulnerabilities most commonly associated with contamination include commercial, industrial, urban runoff and municipal activities. Based on the vulnerability assessments, Santa Monica Wells #3 and #4 located
In March and June 2012, MWD completed a source water assessment of its Colorado and State Project supplies. Based upon the vulnerability assessments, the Colorado River and State Project supplies are most vulnerable to contamination resulting from recreation, urban/storm water runoff, increasing urbanization in the watershed, and wastewater. A copy of the assessment can be obtained by contacting MWD (see back cover for contact information).
Ensuring the Quality of Santa Monica’s Water Supply
Permission and oversight to operate a community water system is granted annually by the DDW and the US EPA. Santa Monica’s water supply undergoes constant field and laboratory testing to ensure the highest water quality before reaching your tap. The water is sampled and analyzed daily, weekly, monthly, quarterly, semi- annual, annual, and triennial. In addition, our water quality management practice includes operating and maintaining optimum performance of the source wells, treatment plants, distribution system; managing reservoirs to meet demand; and testing the water at over 100 locations throughout City’s distribution system monthly.
We look for more than 100 substances including microorganisms, pesticides, herbicides, asbestos, lead, copper,
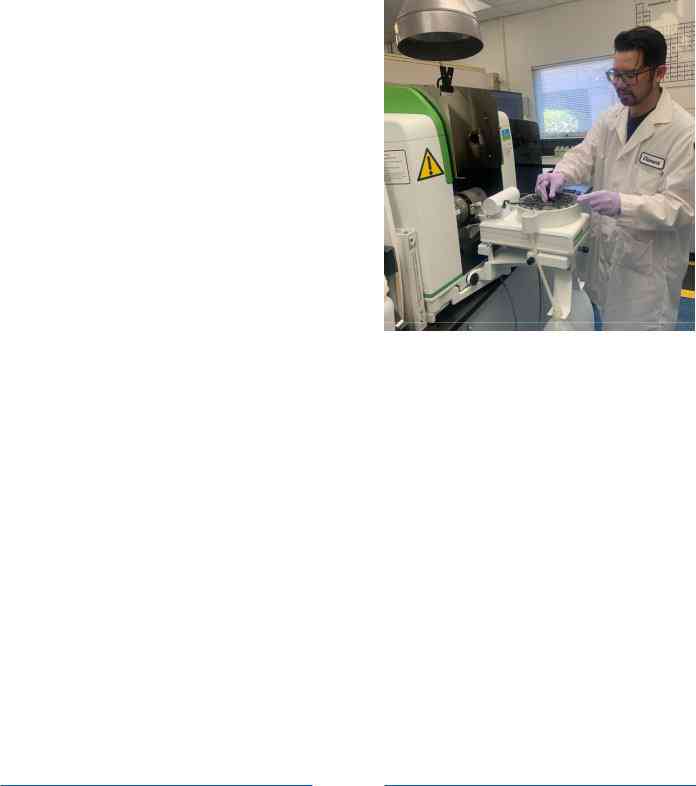
Using atomic absorption spectrometry (AAS) technology, chemists routinely monitor the water quality of the City’s drinking water.
Water Quality Data Tables
We are pleased to report that this year, Santa Monica Water continues to meet and exceed all U.S. EPA and State Drinking Water Health Standards. The following data tables compare our water quality with Drinking Water Health Standards. The data is organized by source of water in two categories, each with two
- LOCAL GROUNDWATER
-
Arcadia Treatment Plant: Collects water from
9 wells, completes treatment, and sends to distribution. - Santa Monica Well #1: Treats supply at the source and pumps directly into distribution.
- METROPOLITAN WATER DISTRICT (MWD)
- Weymouth Plant
- Jensen Plant
The results are presented in two tables: Primary Drinking Water Quality Results and Secondary Drinking Water Quality Results. The primary results cover contaminants that may affect the public’s health. These contaminants include hazardous chemicals, metals, bacteria, and radioactivity. The secondary results cover parameters that may affect the aesthetics of the water, such as taste, appearance, and odor. These parameters include turbidity, minerals, and pH among others. For questions regarding water quality, call the Water Resources Division.
CITY OF SANTA MONICA WATER RESOURCES DIVISION
SUMMARY OF RESULTS FOR PRIMARY DRINKING WATER STANDARDS FOR 2020
|
|
|
LOCAL |
|
|
|
IMPORTED |
IMPORTED |
Dates |
Meets |
|
MAJOR SOURCES |
||||
|
PHG/ |
State |
WELL WATER |
|
SM WELL #1(a) |
SURFACE WATER |
SURFACE WATER |
Sampled |
Std |
|
IN DRINKING WATER |
|||||
Parameter |
[MCLG]/ |
MCL/ |
Arcadia Plant |
|
|
|
Jensen Plant |
Weymouth Plant |
if other |
|
|
|
|
|||
|
{MRDLG} |
{MRDL} |
Average |
Range |
|
Average |
Range |
Average |
Range |
Average |
Range |
than 2020(b) |
|
|
|
|
|
|
|
|
|
|
|
|
|
|
|
|
|
||||
|
|
|
|
PRIMARY |
DRINKING WATER STANDARDS (MANDATORY |
|
|
|
|
|||||||
Clarity |
|
|
|
|
|
|
|
|
|
|
|
|
|
|
|
|
Maximum Turbidity (NTU) |
NS |
95% < 0.3 |
N/A |
N/A |
|
N/A |
N/A |
0.04 |
100% ≤ 0.3 |
0.04 |
100% ≤ 0.3 |
|
Y |
Soil runoff |
||
Microbiological |
|
|
|
|
|
|
|
|
|
|
|
|
|
|
|
|
Total Coliform Bacteria |
[0] |
5% |
|
City- |
wide |
0Range:PositiveNDSamples- 1.60% No violations |
|
|
Y |
Naturally present in the environment |
||||||
(% positive samples/month) |
|
|
|
|
|
|
|
|
|
|
|
|
|
|
|
|
Fecal Coliform/E. Coli |
[0] |
(c) |
|
|
|
|
|
|
Y |
Human and animal fecal waste |
||||||
Organic Chemical |
|
|
|
|
|
|
|
|
|
|
|
|
|
|
|
|
Methyl |
13 |
13(5*) |
ND |
ND |
|
ND |
ND |
ND |
ND |
ND |
ND |
|
Y |
Leaking underground storage tanks |
||
Trichloroethylene (ppb) |
1.7 |
5 |
0.3 |
ND - 0.6 |
|
ND |
ND |
ND |
ND |
ND |
ND |
|
Y |
Discharge from metal degreasing sites |
||
Disinfection |
|
|
|
|
|
|
|
|
|
|
|
|
|
|
|
|
Byproducts & Residuals |
|
|
|
|
|
|
|
|
|
|
|
|
|
|
|
|
Total Trihalomethanes (ppb) |
NS |
80 |
|
|
|
Range: 4.6 - |
33.9 |
|
|
|
Y |
|||||
|
|
|
|
|
|
|
||||||||||
Haloacetic Acids (ppb) |
NS |
60 |
|
|
|
|
|
|
Y |
|
|
|
||||
Total Chlorine/Chloramines (ppm) |
{4} |
{4} |
|
|
|
|
|
|
Y |
Drinking water disinfectant added for treatment |
||||||
Bromate (ppb) |
0.1 |
10 |
N/A |
N/A |
|
N/A |
N/A |
4.4 |
1.4 - 6.0 |
2 |
ND - 4.2 |
|
Y |
|||
Total Organic Carbon |
N/A |
TT |
N/A |
N/A |
|
N/A |
N/A |
2.2 |
1.8 - 2.3 |
2.4 |
2.1 - 2.6 |
|
|
|
|
|
Inorganic Chemicals |
|
|
|
|
|
|
|
|
|
|
|
|
|
|
|
|
Aluminum (ppm) |
0.6 |
1 (0.2*) |
ND |
ND |
|
0.02 |
0.02 |
0.116** |
ND - 0.220 |
0.149** |
0.008 - 0.210 |
|
Y |
Erosion of natural deposits; used in water treatment process |
||
Arsenic (ppb) |
0.004 |
10 |
ND |
ND |
|
1.4 |
1.4 |
ND |
ND |
ND |
ND |
|
Y |
Erosion of natural deposits |
||
Barium (ppm) |
2 |
1 |
0.02 |
0.02 |
|
0.06 |
0.06 |
ND |
ND |
ND |
ND |
|
Y |
Discharge from oil and metal industries; Erosion of natural deposits |
||
Chromium (ppb) |
[100] |
50 |
ND |
ND |
|
ND |
ND |
ND |
ND |
ND |
ND |
|
Y |
Discharge from steel and pulp mills; natural deposits erosion |
||
Chromium 6 (ppb) |
0.02 |
NS |
0.2 |
0.2 |
|
0.5 |
0.5 |
ND |
ND |
ND |
ND |
|
Y |
Naturally occuring; industrial waste discharge |
||
Copper (d) (ppm) |
0.3 |
AL=1.3 (1.0*) |
|
|
City |
0 sites out of 30 exceeded the AL |
|
2019 |
Y |
Corrosion of household plumbing systems |
||||||
Fluoride After Treatment (ppm) |
1 |
2 |
|
|
|
Control Range: 0.6 - 1.2 |
|
|
|
Y |
Water additive for dental health |
|||||
|
|
|
|
|
0 sites out of 30 exceeded the (d) |
|
|
|
|
|
|
|||||
Lead (d) (ppb) |
0.2 |
AL=15 |
|
|
0 site out of 34 exceeded the ALL (e) |
|
2019 |
Y |
Corrosion of household plumbing systems |
|||||||
Nitrate (as N) (ppm) |
10 |
10 |
0.6 |
0.4 - 0.7 |
|
3.8 |
3.7 - 4.0 |
ND |
ND |
ND |
ND |
|
Y |
Runoff from fertilizer use; leaching from sewage; |
||
|
|
|
|
|
|
|
|
|
|
|
|
|
|
|
|
|
|
|
|
|
|
|
|
|
|
|
|
|
|
|
|
erosion of natural deposits |
|
|
|
|
|
|
|
|
|
|
|
|
|
|
|
|
erosion of natural deposits |
|
Perchlorate (ppb) |
1 |
6 |
ND |
ND |
|
1.9 |
1.9 |
ND |
ND |
ND |
ND |
|
Y |
|
|
|
|
|
Industrial waste discharge |
|
|||||||||||||
Radionuclides |
|
|
|
|
|
|
|
|
|
|
|
|
|
|
|
|
Alpha emitters (pCi/L) |
[0] |
15 |
2.9 |
ND - 5.8 |
|
ND |
ND |
ND |
ND |
ND |
ND |
|
Y |
Erosion of natural deposits |
||
Beta/photon emitters (pCi/L) |
[0] |
50 |
N/A |
N/A |
|
N/A |
N/A |
ND |
ND |
ND |
ND |
|
Y |
Decay of natural and |
||
Combined Radium (pCi/L) |
[0] |
5 |
ND |
ND |
|
ND |
ND |
ND |
ND |
ND |
ND |
|
Y |
Erosion of natural deposits |
||
Uranium (pCi/L) |
0.43 |
20 |
2.3 |
1.5 |
|
1.1 |
1.1 |
ND |
ND |
2 |
1 - 3 |
|
Y |
Erosion of natural deposits |
||
|
|
|
|
|
|
|
|
|
|
|
|
|
|
|
|
|
KEY TO ABBREVIATIONS
FOR ADDITIONAL WATER QUALITY QUESTIONS, CONTACT JACK MIYAMOTO, LEAD CHEMIST AT (310)
PDWS = Primary Drinking Water Standards are MCLs and MRDLs for contaminants that affect health along with their monitoring and reporting requirements, and water treatment requirements.
PHG = Public Health Goal, The level of a contaminant in drinking water below which there is no known or expected risk to health. PHGs are set by the California Environmental Protection Agency.
MCLG = Maximum Contaminant Level Goal, The level of a contaminant in drinking water below which there
is no known or expected risk to health. MCLGs are set by the U.S. Environmental Protection Agency.
MCL = Maximum Contaminant Level, The highest level of a contaminant that is allowed in drinking water. Primary MCLs are set as close to the PHGs (or MCLGs) as is economically and technologically feasible. Secondary MCLs are set to protect the odor, taste, and appearance of drinking water.
MRDL = Maximum Residual Disinfectant Level is the highest level of a disinfectant allowed in drinking water. There is convincing evidence that addition of a disinfectant is necessary for control of microbial contaminants.
MRDLG = Maximum Residual Disinfectant Level Goal is the level of a drinking water disinfectant below which there is no known or expected risk to health. MRDLGs do not reflect the benefits of the use of disinfectants to control microbial contaminants.
LRAA = Locational Running Annual Average. The running annual average is based on monitoring location.
AL = Regulatory Action Level is the concentration of a contaminant which, if exceeded, triggers treatment or other requirements that a water system must follow.
N/A = Not Applicable NS = No Standard
ND = Monitored for but Not Detected
NTU = Nephelometric Turbidity Units - used to measure cloudiness of drinking water.
-
= Treatment Technique is a required process intended to reduce the level of a contaminant in drinking water. ppb = parts per billion, or micrograms per liter (µg/l)
ppm = parts per million, or milligrams per liter (mg/l) pCi/L = picocuries per liter
- = secondary standard
- = Highest Running Annual Average (RAA)
- = SM Well#1 is pumped into a transmission line, is blended with Imported Surface Water and enters the system at 19th St. & Idaho Ave.
- = The City is not required to test for every parameter each year. If indicated, data is from a previous year.
-
= Two consecutive Total
Coliform-positive samples, one of which contains Fecal Coliform / E. Coli constitutes an acute MCL violation. No violations occurred for 2020. -
= The MCL has been replaced with a treatment technique requiring agencies to optimize corrosion control. Results given are from first draw,
at-the-tap monitoring performed every three years.
CITY OF SANTA MONICA WATER RESOURCES DIVISION
Summary of Results for Secondary Drinking Water Standards for 2020
|
|
|
LOCAL |
|
|
IMPORTED |
IMPORTED |
Dates |
Meets |
MAJOR SOURCES |
|||
|
PHG/ |
State |
WELL WATER |
SM WELL #1(a) |
SURFACE WATER |
SURFACE WATER |
Sampled |
Std |
IN DRINKING WATER |
||||
Parameter |
[MCLG] |
MCL |
Arcadia Plant |
|
|
Jensen Plant |
Weymouth Plant |
if other |
|
|
|||
|
|
|
Average |
Range |
Average |
Range |
Average |
Range |
Average |
Range |
than 2020(b) |
|
|
|
SECONDARY DRINKING WATER STANDARDS (AESTHETIC STANDARDS) |
|
|
|
|
|
|
|
|
|
|||||||
Chemical Parameters |
|
|
|
|
|
|
|
|
|
|
|
|
|
|
|
|
|
Chloride (ppm) |
NS |
500 |
42 |
37 |
- 46 |
105 |
105 |
52 |
51 - 54 |
93 |
93 |
|
|
Y |
Runoff/leaching from natural deposits; industrial wastes |
||
Color (units) |
NS |
15 |
<5 |
<5 |
<5 |
<5 |
2 |
1 |
1 |
|
1 |
|
|
Y |
|||
Iron (ppb) |
NS |
300 |
53 |
23 - 145 |
22 |
22 |
ND |
ND |
ND |
ND |
Y |
Leaching from natural deposits; industrial wastes |
|||||
Manganese (ppb) |
NS |
50 |
4.3 |
2.4 |
- 6.6 |
9.2 |
9.2 |
ND |
ND |
ND |
ND |
Y |
Leaching from natural deposits |
||||
Odor- Threshold (units) |
NS |
3 |
<1 |
|
<1 |
<1 |
<1 |
2 |
|
2 |
2 |
|
2 |
|
|
Y |
|
Specific Conductance (µmho/cm) |
NS |
1600 |
516 |
451 - 595 |
1316 |
1298 - 1336 |
460 |
451 - 468 |
966 |
963 |
- 968 |
|
|
Y |
Substances that form ions when in water; seawater influence |
||
Sulfate (ppm) |
NS |
500 |
76 |
64 |
- 84 |
247 |
247 |
54 |
53 |
- 56 |
213 |
211 |
- 215 |
|
|
Y |
Runoff/leaching from natural deposits; industrial wastes |
Total Dissolved Solids (ppm) |
NS |
1000 |
303 |
255 |
- 336 |
977 |
961 - 989 |
260 |
255 |
- 264 |
590 |
587 |
- 593 |
|
|
Y |
Runoff/leaching from natural deposits |
Turbidity (NTU) |
— |
5 |
0.14 |
0.07 |
- 0.42 |
0.35 |
0.15 - 1.00 |
ND |
ND |
ND |
ND |
Y |
Soil runoff |
||||
|
|
|
|
|
|
|
|
|
|
|
|
|
|
|
|
|
|
ADDITIONAL PARAMETERS
KEY TO ABBREVIATIONS
Alkalinity (ppm) Boron (ppb) Calcium (ppm)
Hardness (as CaCO3) (ppm) Magnesium (ppm)
pH (units) Potassium (ppm) Radon (pCi/L) Sodium (ppm)
1,
NS |
NS |
NS |
NL=1000 |
NS |
NS |
NS |
NS |
NS |
NS |
NS |
NS |
NS |
NS |
NS |
NS |
NS |
NS |
NS |
NL=1 |
3 NL=10
NS NL=12
108 |
99 - 125 |
|
170 |
170 |
|
39 |
32 |
- 44 |
163 |
137 |
- 193 |
17 |
16 |
- 18 |
8.1 7.9 - 8.4
1.4 1.2 - 1.5
ND |
ND |
45 |
43 - 47 |
0.4 ND - 1.5
N/A |
N/A |
ND |
ND |
327 |
319 |
- 334 |
120 |
120 |
|
122 |
121 |
- 125 |
567 |
549 - 585 |
|
62 |
62 |
|
7.1 6.8 - 7.3
3.83.8
400 |
400 |
84 |
84 |
ND |
ND |
N/A |
N/A |
N/A |
N/A |
82 |
79 - 86 |
170 |
170 |
27 |
26 - 28 |
108 |
107 - 110 |
12 |
11 |
8.4 8.4
2.6 2.5 - 2.6
ND |
ND |
47 |
46 - 48 |
N/A |
N/A |
22
ND ND
118 |
118 |
- 119 |
130 |
130 |
|
25 |
23 |
- 27 |
262 |
256 |
- 268 |
26 |
25 |
- 26 |
8.18.1
4.6 4.5 - 4.6
ND |
ND |
95 |
93 - 97 |
N/A |
N/A |
ND |
ND |
ND |
ND |
PHG = Public Health Goal is the level of a contaminant in drinking water below which there is no known or expected risk to health. PHGs are set by the California Environmental Protection Agency.
MCLG = Maximum Contaminant Level Goal is the level of a contaminant in drinking water below which there is no known or expected risk to health. MCLGs are set by the U.S. Environmental Protection Agency.
MCL = Maximum Contaminant Level is the highest level of a contaminant that is allowed in drinking water. Primary MCLs are set as close to the PHGs (or MCLGs) as is economically and technologically feasible. Secondary MCLs are set to protect the odor, taste, and appearance of drinking water.
MRDLG = Maximum Residual Disinfectant Level Goal is the level of a drinking water disinfectant below which there is no known or expected risk to health. MRDLGs do not reflect the benefits of the use of disinfectants to control microbial contaminants.
FOR ADDITIONAL WATER QUALITY QUESTIONS, CONTACT JACK MIYAMOTO, LEAD CHEMIST AT (310)
NL = Notification Level, or the concentration of a contaminant that the California Department of Public Health has determined does not pose not a significant health risk, but warrants notification.
N/A = Not Applicable NS = No Standard
ND = Monitored for, but Not Detected
NTU = Nephelometric Turbidity Units - used to measure cloudiness of drinking water.
ppb = parts per billion, or micrograms per liter (ug/l) ppm = parts per million, or milligrams per liter (mg/l) ppt = parts per trillion, or nanograms per liter (ng/l) umho/cm = micromhos per centimeter
- = less than
- = SM Well#1 is pumped into a transmission line, is blended with Imported Surface Water and enters the system at 19th St. & Idaho Ave.
- = We are not required to test for each parameter every year. If indicated, data is from a previous year.
-
= MWD has developed a
flavor-profile analysis method that can more accurately identify odor occurences.
COVID-19 and Drinking Water
According to the U.S. EPA and CDC, the
The Santa Monica Water Treatment Plant carries out
from the Metropolitan Water District (MWD) undergoes numerous treatment processes and complies with the same federal and state regulations. Their treatment process is effective in killing bacteria and viruses.
The Santa Monica community can continue to use and drink water from their tap as usual.
Additional information on
and Centers for Disease Control and Prevention website:
www.cdc.gov/healthywater/drinking/index.html
The Arcadia Water Treatment Plant provides
Facts about Radon
Radon is a radioactive gas that you cannot see, taste, or smell. It is found throughout the U.S. Radon can move up through the ground and into a home through cracks and holes in the foundation. Radon can build up to high levels in all types of homes. Radon can also get into indoor air when released from tap water from showering, washing dishes, and other household activities. Compared to radon entering the home through soil, radon entering the home through tap water will in most cases be a small source of radon in indoor air. Radon is a known human carcinogen. Breathing air containing radon can lead
to lung cancer. Drinking water containing radon may also cause increased risk of stomach cancer. If you are concerned about radon in your home, test the air in your home. Testing is inexpensive and easy. You should pursue radon removal for your home if the level of radon in your air is 4 picocuries per liter of air (pCi/L) or higher. There are simple ways to fix a radon problem that are not too costly. For additional information, call your state radon program (800)
Information is also available at the California EPA website: www.cdph.ca.gov/Programs/CEH/DRSEM/Pages/EMB/ Radon/Radon.aspx
Per- and Polyfluoroalkyl Substances (PFAS)
PFAS are a group of compounds containing carbon to fluorine chemical bonds, one of the strongest in organic chemistry. They are manufactured and used to enhance repellency of water, grease, and soil in consumer products; thus, they are very stable and resistant to environmental degradation. If exposed, perfluorooctanoic acid (PFOA) and perfluorooctanesulfonate (PFOS) are readily absorbed but not readily eliminated from the human body. According to the State Water Resources Control Board (SWRCB) potential health concerns,
California State Water Resources Control Board, Division of Drinking Water (DDW) has issued drinking water notification levels (NLs) and response levels (RLs) for PFAS. According to OEHHA recommendations, these levels provide some health risk protection in sensitive populations and demonstrate low cancer risk with 70- year lifetime exposure.
If a utility exceeds the RL(s), regulations require the water source be taken out of service, provide treatment, or notify customers.
Plant operators perform routine maintenance on the cartridge filters and make sure the system is working properly.
Perfluoroalkyl and Polyfluoroalkyl Substances
PFAS Compound |
Notification Level |
Response Level |
|
(ppt) |
(ppt) |
Perfluorooctanoic |
5.1ppt |
10 ppt |
Acid (PFOA) |
|
|
Perfluorooctanesulfonic |
6.5 ppt |
40 ppt |
Acid (PFOS) |
|
|
Parts per trillion (ppt) = 1 second in 31,709.8 years
Apart from drinking water, PFOA and PFOS exposure can occur from other sources: firefighting foaming/fire preventing agents; products that repel water, grease, and soil.
In April 2019, the SWRCB investigated source water wells in California most vulnerable to PFAS contamination. This included those near airports and landfills, and later those near secondary sources of PFAS activities. SWRCB did not require Santa Monica to sample its sources. However, City staff proactively sampled the City’s Drinking Water sources in August/September of 2019, and PFAS was not detected in our drinking water supply. All PFAS samples analyzed by an outside laboratory were
Additionally, Granular activated carbon (GAC) and reverse osmosis (RO), both part of the City’s treatment process, are effective at removing many PFAS compounds.
Answers to the Most Commonly Asked Questions About Your Tap Water
What affects the taste of my water?
The taste of drinking water is affected by its mineral content as well as the presence of chloramine, which is used to protect against potential bacterial contamination. Sometimes plumbing can cause a metallic flavor, especially if the water has been sitting in the pipes
for many hours.
How hard is my water?
The water delivered to our customers has an average hardness of 163 ppm. To convert to grains per gallon, divide the hardness in ppm by 17.1. The average hardness in our water is 9.47 grains per gallon.
What type of disinfectant is in my water?
A low level of chloramine disinfectant is added to your tap water to protect from waterborne pathogens. Chloramine is formed when a small amount of ammonia is added to chlorinated water. This type of disinfectant is very stable and reduces the formation of disinfection
in your water. These
Is the City’s water fluoridated?
The City of Santa Monica is required by state law to add fluoride to drinking water to help prevent dental decay in consumers. Current regulations require fluoride levels in the treated water be maintained between 0.6 to 1.2 ppm with an optimum dose of 0.7 ppm. Our monitoring showed that fluoride levels in the treated water distribution system averaged 0.74 ppm.
According to the American Dental Association and CDC, it is safe to use optimally fluoridated water for preparing infant formula. If an infant is primarily fed infant formula prepared with fluoridated water, there may
be an increased chance for mild enamel fluorosis, but enamel fluorosis does not affect the health of the infant or the health of the infant’s teeth. To lessen this chance, deionized, purified, distilled or demineralized bottled water can be used. If you have additional questions about fluoride, contact your health provider.
Additional information can be found at the State Board website: www.waterboards.ca.gov/drinking_water/ certlic/drinkingwater/Fluoridation.shtml
or the CDC website: www.cdc.gov/fluoridation
What about lead from my plumbing?
The lead contamination that made the news in Flint, Michigan is highly unlikely in Santa Monica. The quality of
our source water is much different than Flint’s, and our corrosion control processes comply with state drinking water regulations. A pool of “high risk” homes, which were plumbed before the ban on lead in solder, have been tested every three years since 1992 and has continually indicated there is little tendency of our water to leach lead out of plumbing. The next round of testing is scheduled this year in 2022.
If your home plumbing contains lead, there is a limited potential for lead to leach into your water. Fortunately, the minerals in our water help to protect against pipe corrosion, greatly reducing the potential of lead entering the water. These minerals form a film called “scale” that prevents water from coming into direct contact with home plumbing. The most common place to find lead in household plumbing is in
If present, however, elevated levels of lead can cause serious health problems, especially for pregnant women and young children. Lead in drinking water is primarily from materials and components associated with service lines and home plumbing. The City of Santa Monica Water Resources Division is responsible for providing high quality drinking water but cannot control the variety of materials used in plumbing components. When your water has been sitting for several hours, you can minimize the potential for lead exposure by flushing your tap for 30 seconds to 2 minutes before using water for drinking or cooking. If you do so, you may wish to collect the flushed water andreuse it for another beneficial purpose, such as watering plants. If you are concerned about lead in your water, you may wish to have your water tested. To get your water tested, please call the Water Quality Office. Information on lead in drinking water, testing methods, and steps you can take to minimize exposure is available from the Safe Drinking Water Hotline or at www.epa.gov/safewater/lead.
Do I really need to buy a water filter or home treatment system?
The decision to buy a water filter or home treatment system is a matter of personal preference. Our water meets or exceeds rigid state and federal health standards. If you decide to buy a filter or system, be a smart shopper and do some homework. Any treatment device you buy should be registered with the National Sanitation Foundation (NSF). Contact NSF toll free at (800)
What about bottled water?
Again, the decision is yours. You may find that keeping a pitcher of tap water in your refrigerator is a
Water Conservation
The City of Santa Monica has developed a sustainable water supply and taken responsible steps to improve water conservation in the midst of a changing climate. The City is actively seeking ways to conserve and improve the City’s water supply for future generations. To continue meeting our water conservation goals, the City urges our residents to continue their conservation effort because small changes make a difference. For more information and water saving tips, please visit www.smgov.net/ Departments/OSE/categories/water.aspx
Sustainability
The City of Santa Monica is still offering incentives for environmentally friendly measures taken by the community. For more information, please call or visit the Office of Sustainability website at www.smgov.net/water.
We need you!
Public involvement is fundamental to ensuring that we are meeting our water supply demand, water quality goals, and the highest customer service level. We welcome your feedback and invite you to get involved with the City of Santa Monica in the following ways:
- Participate in conservation events
- Attend City Council and community meetings
- Sign up for the newsletters and alerts
- Please let us know how we are doing
For information on these opportunities, please call Water Resources and the Office of Sustainability and the Environment. For a digital copy of this report, please visit: waterquality.smgov.net

Where Can I Get More Information?
City of Santa Monica Public Works and Water Resources Division Offices:
Water Resources/Water Quality |
(310) |
(310) |
|
Wastewater |
(310) |
Lead Chemist |
(310) |
Billing Office |
(310) |
Visit our website: www.smgov.net/departments/publicworks/water.aspx
Santa Monica City Council Meetings:
2nd & 4th Tuesdays of each month
Council Chamber
1685 Main Street, Santa Monica
www.smgov.net/cityclerk/agendas.apsx
City of Santa Monica Office of Sustainability and
the Environment |
(310) |
|
Conservation Office |
(310) |
|
www.sustainablesm.org |
|
|
Metropolitan Water District (MWD) |
|
|
of Southern California |
(213) |
|
Toll Free |
(800) |
|
www.mwdh2o.com |
|
|
California State Water Resources Control Board |
||
Division of Drinking Water |
(818) |
|
www.waterboards.ca.gov/drinking_water/ |
|
|
U.S. Environmental Protection Agency |
|
|
Office of Ground Water & Drinking Water |
|
|
Safe Drinking Water Hotline |
(800) |
|
www.epa.gov/safewater/dwhealth.html
Water Resources Division
P.O. Box 2200, 1685 Main Street
Santa Monica, CA
This brochure is printed with
Contaminants
Santa Monica
EWG's drinking water quality report shows results of tests conducted by the water utility and provided to the Environmental Working Group by the California State Water Resources Control Board, as well as information from the U.S. EPA Enforcement and Compliance History database (ECHO). For the latest quarter assessed by the U.S. EPA (January 2019 - March 2019), tap water provided by this water utility was in compliance with federal health-based drinking water standards.
Utility details
- Serves: 92185
- Data available: 2012-2017
- Data Source: Purchased surface water
- Total: 27
Contaminants That Exceed Guidelines
- 1%2C4-Dioxane
- Arsenic
- Bromodichloromethane
- Bromoform
- Chromium (hexavalent)
- Dibromochloromethane
- Nitrate
- Nitrate and nitrite
- Total trihalomethanes (TTHMs)
- Uranium
Other Detected Contaminants
- Barium
- Bromochloroacetic acid
- Chlorate
- Chlorodifluoromethane
- Chloroform
- Chromium (total)
- Dibromoacetic acid
- Dichloroacetic acid
- Fluoride
- Haloacetic acids (HAA5)
- Manganese
- Molybdenum
- MTBE
- Strontium
- Trichloroacetic acid
- Trichloroethylene
- Vanadium
Reminder
Always take extra precautions, the water may be safe to drink when it leaves the sewage treatment plant but it may pick up pollutants during its way to your tap. We advise that you ask locals or hotel staff about the water quality. Also, note that different cities have different water mineral contents.
Sources and Resources
Sources Cited
Additional Resources
What you have probably noticed when shopping in any of the large department stores is a large display dedicated to the topic of tap water in Santa Monica, CA. The reason this display is there is because these water sources are considered a public health concern. There are some states that have strict rules on the amount of contaminants that can be present in water, but Santa Monica is different because its population is over seven thousand people.
If the public health is something that you are concerned about then it is important to see just how safe your tap water is. Most of us do not realize that most of our water is not safe to drink because many companies have been allowed to use chemicals and other artificial materials that are known or suspected to cause cancer or other illnesses.
These water sources have been tested over the years and all reports have shown that there are no significant problems associated with it. This information has given yo