Table of Contents
Can You Drink Tap Water in Seaside?
Yes, Seaside's tap water is generally considered safe to drink as Seaside has no active health based violations of the Safe Drinking Water Act (SDWA) that we are aware of. Other factors such as lead piping in a home, or low levels of pollutants on immunocompromised individuals, should also be considered, however. To find more recent info we might have, you can check out our boil water notice page, the city's water provider website, or Seaside's local Twitter account.
According the EPA’s ECHO database, from April 30, 2019 to June 30, 2022, Seaside's water utility, Cal Am Water Company - Monterey, had 0 violations of the Safe Drinking Water Act. For more details on the violations, please see our violation history section below. The last violation for Seaside was resolved on April 30, 2012. This assessment is based on the Cal Am Water Company - Monterey water system, other water systems in the city may have different results.
While tap water that meets the EPA health guidelines generally won’t make you sick to your stomach, it can still contain regulated and unregulated contaminants present in trace amounts that could potentially cause health issues over the long-run. These trace contaminants may also impact immunocompromised and vulnerable individuals.
The EPA is reviewing if it’s current regulations around pollutant levels in tap water are strict enough, and the health dangers posed by unregulated pollutants, like PFAS.
Water Quality Report for Seaside Tap Water
The most recent publicly available numbers for measured contaminant levels in Seaside tap water are in its 2020 Water Quality Report. As you can see, there are levels which the EPA considers to be acceptable, but being below the maximum allowable level doesn’t necessarily mean the water is healthy.
Lead in tap water, for example, is currently allowed at up to 15ppb by the EPA, but it has set the ideal goal for lead at zero. This highlights how meeting EPA standards doesn’t necessarily mean local tap water is healthy.
EPA regulations continue to change as it evaluates the long term impacts of chemicals and updates drinking water acceptable levels. The rules around arsenic, as well as, lead and copper are currently being re-evaluated.
There are also a number of "emerging" contaminants that are not currently. For example, PFAS (Per- and polyfluoroalkyl substances), for which the EPA has issued a health advisory. PFAS are called "forever chemicals" since they tend not to break down in the environment or the human body and can accumulate over time.
We recommend looking at the contaminants present in Seaside's water quality reports, or getting your home's tap water tested to see if you should be filtering your water.
Seaside Tap Water Safe Drinking Water Act Violation History - Prior 10 Years
Below is a ten year history of violations for the water system named Cal Am Water Company - Monterey for Seaside in California. For more details please see the "What do these Violations Mean?" section below.
From April 1, 2012 to April 30, 2012, Seaside had 1 non-health based Safe Drinking Water Act violation with the violation category being Monitoring and Reporting, more specifically, the violation code was Monitoring, Turbidity (Enhanced SWTR) which falls into the Microbials rule code group, and the Surface Water Treatment Rules rule code family for the following contaminant code: Interim Enhanced Surface Water Treatment Rule.
Is there Lead in Seaside Water?
Based on the EPA’s ECHO Database, 90% of the samples taken from the Seaside water system, Cal Am Water Company - Monterey, between sample start date and sample end date, were at or below, 0.002 mg/L of lead in Seaside water. This is 13.3% of the 0.015 mg/L action level. This means 10% of the samples taken from Seaside contained more lead.
While Seaside water testing may have found 0.002 mg/L of lead in its water, that does not mean your water source has the same amount. The amount of lead in water in a city can vary greatly from neighborhood to neighborhood, or even building to building. Many buildings, particularly older ones, have lead pipes or service lines which can be a source of contamination. To find out if your home has lead, we recommend getting you water tested.
No amount of lead in water is healthy, only less dangerous. As lead accumulates in our bodies over time, even exposure to relatively small amounts can have negative health effects. For more information, please check out our Lead FAQ page.
Are there PFAS in Seaside Tap Water?
Currently, testing tap water for PFAS isn’t mandated on a national level. We do have a list of military bases where there have been suspected or confirmed leaks. There appears to be at least one military base - PRESIDIO OF MONTERREY - near Seaside with suspected leaks.
With many potential sources of PFAS in tap water across the US, the best information we currently have about which cities have PFAS in their water is this ewg map, which you can check to see if Seaside has been evaluated for yet.
Our stance is better safe than sorry, and that it makes sense to try to purify the tap water just in case.
Seaside SDWA Violation History Table - Prior 10 Years
| Compliance Period | Status | Health-Based? | Category Code | Code | Rule Code | Contaminant Code | Rule Group Code | Rule Family Code |
|---|---|---|---|---|---|---|---|---|
| 04/01/2012 - 04/30/2012 | Resolved | No | Monitoring and Reporting (MR) | Monitoring, Turbidity (Enhanced SWTR) (38) | Long Term 1 Enhanced Surface Water Treatment Rule (122) | Interim Enhanced Surface Water Treatment Rule (0300) | Microbials (100) | Surface Water Treatment Rules (120) |
What do these Violations Mean?
Safe Drinking Water Act Violations categories split into two groups, health based, and non-health based. Generally, health based violations are more serious, though non-health based violations can also be cause for concern.
Health Based Violations
- Maximum contaminant levels (MCLs) - maximum allowed contaminant level was exceeded.
- Maximum residual disinfectant levels (MRDLs) - maximum allowed disinfectant level was exceeded.
- Other violations (Other) - the exact required process to reduce the amounts of contaminants in drinking water was not followed.
Non-Health Based Violations
- Monitoring and reporting violations (MR, MON) - failure to conduct the required regular monitoring of drinking water quality, and/or to submit monitoring results on time.
- Public notice violations (Other) - failure to immediately alert consumers if there is a serious problem with their drinking water that may pose a risk to public health.
- Other violations (Other) - miscellaneous violations, such as failure to issue annual consumer confidence reports or maintain required records.
SDWA Table Key
| Field | Description |
|---|---|
| Compliance Period | Dates of the compliance period. |
| Status |
Current status of the violation.
|
| Health-Based? | Whether the violation is health based. |
| Category Code |
The category of violation that is reported.
|
| Code | A full description of violation codes can be accessed in the SDWA_REF_CODE_VALUES (CSV) table. |
| Contaminant Code | A code value that represents a contaminant for which a public water system has incurred a violation of a primary drinking water regulation. |
| Rule Code |
Code for a National Drinking Water rule.
|
| Rule Group Code |
Code that uniquely identifies a rule group.
|
| Rule Family Code |
Code for rule family.
|
For more clarification please visit the EPA's data dictionary.
Seaside Water - Frequently Asked Questions
| By Phone: | 831-646-3241 |
| By Email: | christopher.cook@amwater.com |
| By Mail: | 511 Forest Lodge Road, Suite 100 PACIFIC GROVE, CA, 93950 |
Existing customers can login to their Cal Am Water Company - Monterey account to pay their Seaside water bill by clicking here.
If you want to pay your Cal Am Water Company - Monterey bill online and haven't made an account yet, you can create an account online. Please click here to create your account to pay your Seaside water bill.
If you don't want to make an account, or can't remember your account, you can make a one-time payment towards your Seaside water bill without creating an account using a one time payment portal with your account number and credit or debit card. Click here to make a one time payment.
Moving to a new house or apartment in Seaside means you will often need to put the water in your name with Cal Am Water Company - Monterey. In order to put the water in your name, please click the link to the start service form below. Start service requests for water bills typically take two business days.
Leaving your house or apartment in Seaside means you will likely need to take your name off of the water bill with Cal Am Water Company - Monterey. In order to take your name off the water bill, please click the link to the stop service form below. Stop service for water bills requests typically take two business days.
USER SUBMITTED RATINGS
- Drinking Water Pollution and Inaccessibility
- Water Pollution
- Drinking Water Quality and Accessibility
- Water Quality
The above data is comprised of subjective, user submitted opinions about the water quality and pollution in Seaside, measured on a scale from 0% (lowest) to 100% (highest).
Related FAQS
Seaside Water Quality Report (Consumer Confidence Report)
The EPA mandates that towns and cities consistently monitor and test their tap water. They must report their findings in an annual Consumer Confidence Report. Below is the most recent water quality report from Seaside's Water. If you would like to see the original version of the report, please click here.
2020 Annual
Monterey
PWS ID: CA2710004
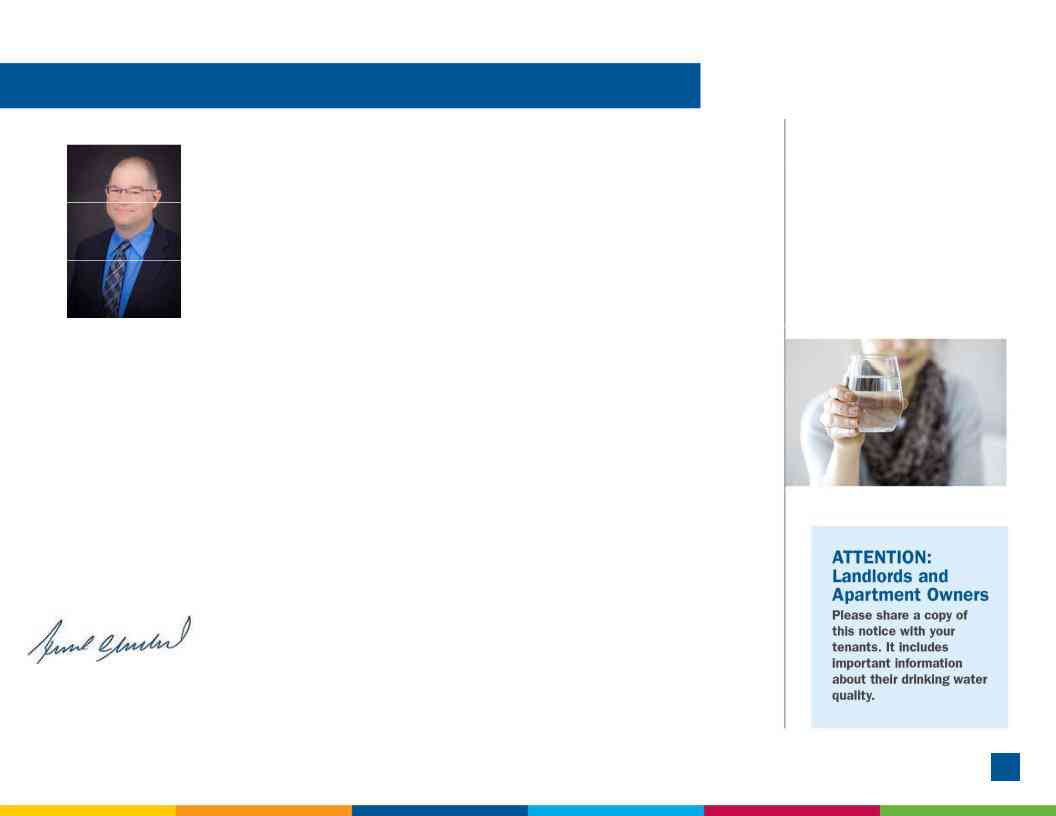
A message from California American Water’s President
Rich Svindland
President California American Water
.
Rich Svindland
California American Water
Dear California American Water Customer,
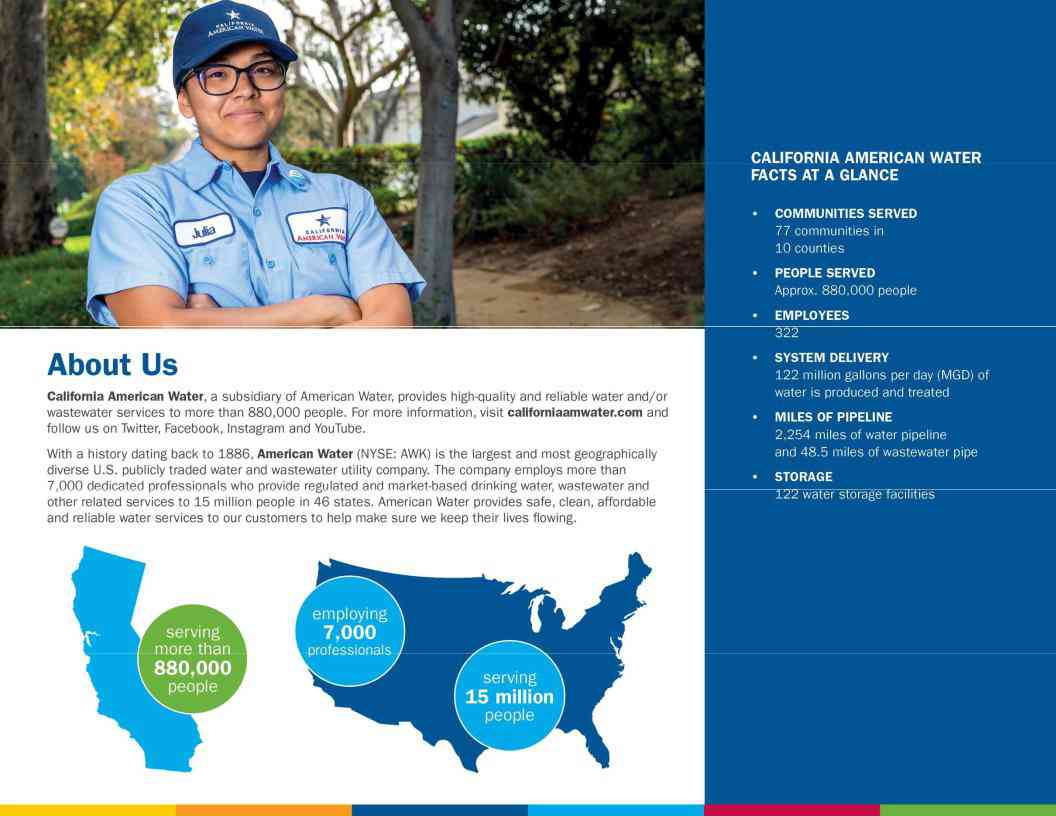
Our top priority is providing safe, reliable drinking water to our more
than 690,000 people. Most people take their water quality for granted in the United States and expect clean water to be always available. I believe this expectation is affirmation
of the hard work and investment we and other water utilities across the country have made in providing this essential service.
I am pleased to share with you our 2020 Consumer Confidence Report, which reflects the hard work and dedication of our employees who work to provide high quality drinking water. During the
activated its business continuity plans to ensure our ability to provide reliable, high quality service to our customers.
According to the U.S. Environmental Protection Agency review of current research, the risk to water supplies from COVID – 19 is low. The USEPA has also relayed that Americans can continue to use and drink water from their tap as usual.
California American Water remains committed to the delivery of safe, reliable water. We have rigorous safeguards in place to help provide water to you that meets or surpasses increasingly stringent water quality standards.
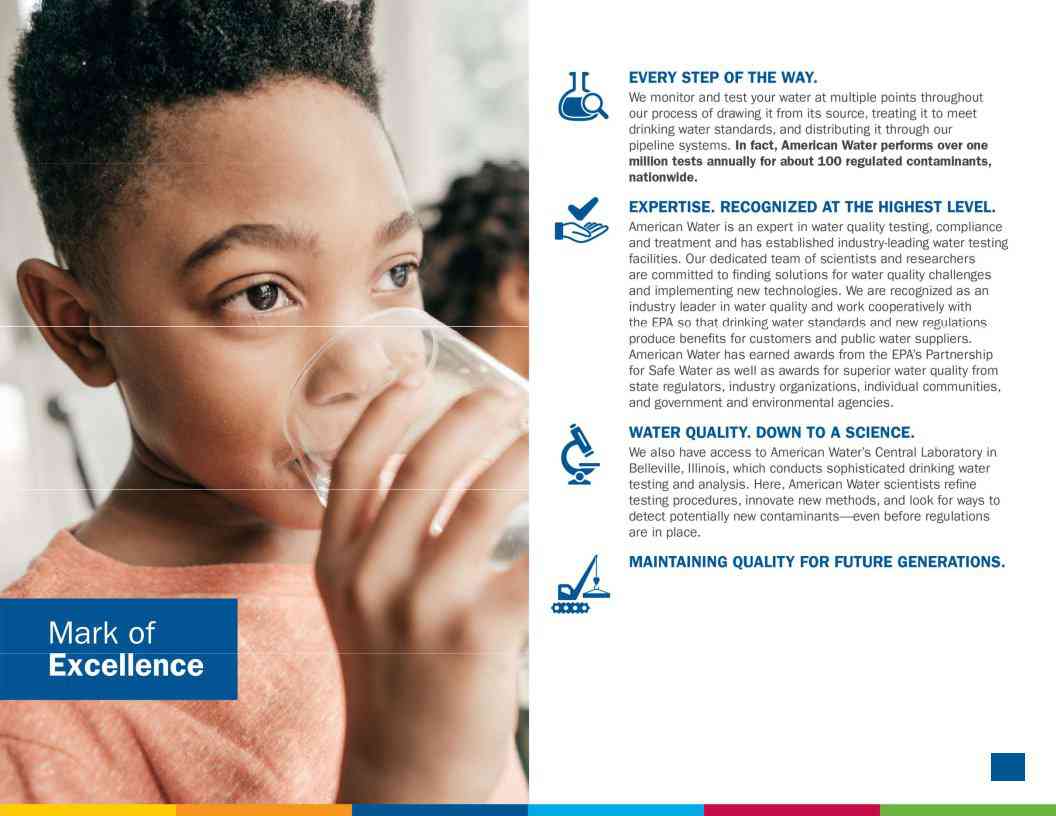
Across California, we conducted approximately 650 different tests on more
than 25,000 water samples for nearly 3,000 constituents last year. We are proud and pleased to confirm that those tests showed that we met every primary and secondary state and federal water quality standard.
SERVICE: Last year, we invested more than $68 million in water infrastructure in the California communities we serve. This investment helps maintain the safety and reliability of the facilities and technology needed to draw, treat, and distribute water.
VALUE: While costs to provide water service continue to increase across the country, our investments help us provide high quality water service that remains an exceptional value for such an essential service. California American Water also offers a variety of Customer Assistance Programs and Conservation services to help our customers. If you have any questions or concerns, you can contact us by phone, email, online at www.californiaamwater.com, or in person at our local Customer Center. Please take the time to review this report as It provides details about the source and quality of your drinking water, using data from water quality testing conducted for your local system between January and December 2020.
This report contains important information about your drinking water. Translate it or speak with someone who understands it at
-
237-1333,
Monday-Friday, 7 a.m. to 7 p.m.
2
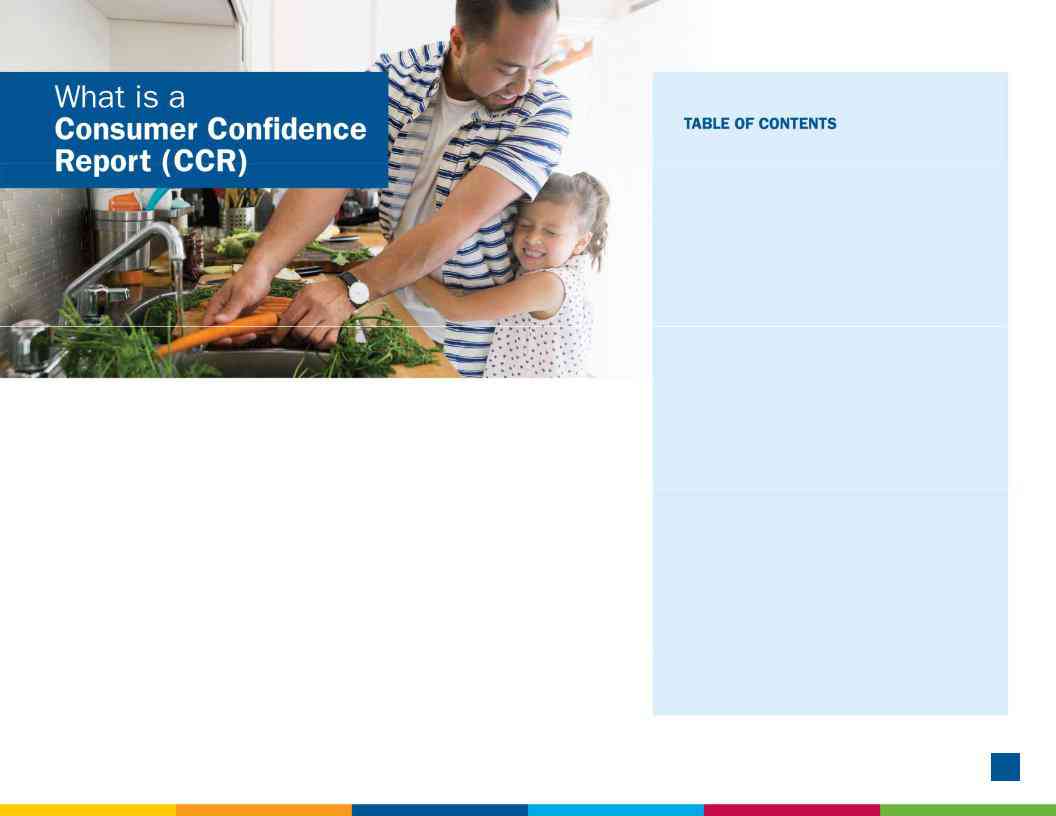
Once again, we proudly present our Annual Water Quality Report, also referred to as a Consumer Confidence Report (CCR). CCRs let consumers know what contaminants, if any, were detected in their drinking water as well as related potential health effects. CCRs also include details about where your water comes from and how it is treated. Additionally, they educate customers on what it takes to deliver safe drinking water and highlight the need to protect drinking water sources.
California American Water is committed to delivering high quality drinking water service. To that end, we remain vigilant in meeting the challenges of source water protection, water conservation, environmental compliance, sustainability and community education while continuing to serve the needs of all our water users.
A message from our President |
2 |
What is a Consumer Confidence Report |
3 |
Mark of Excellence |
4 |
About Your Drinking Water Supply |
5 |
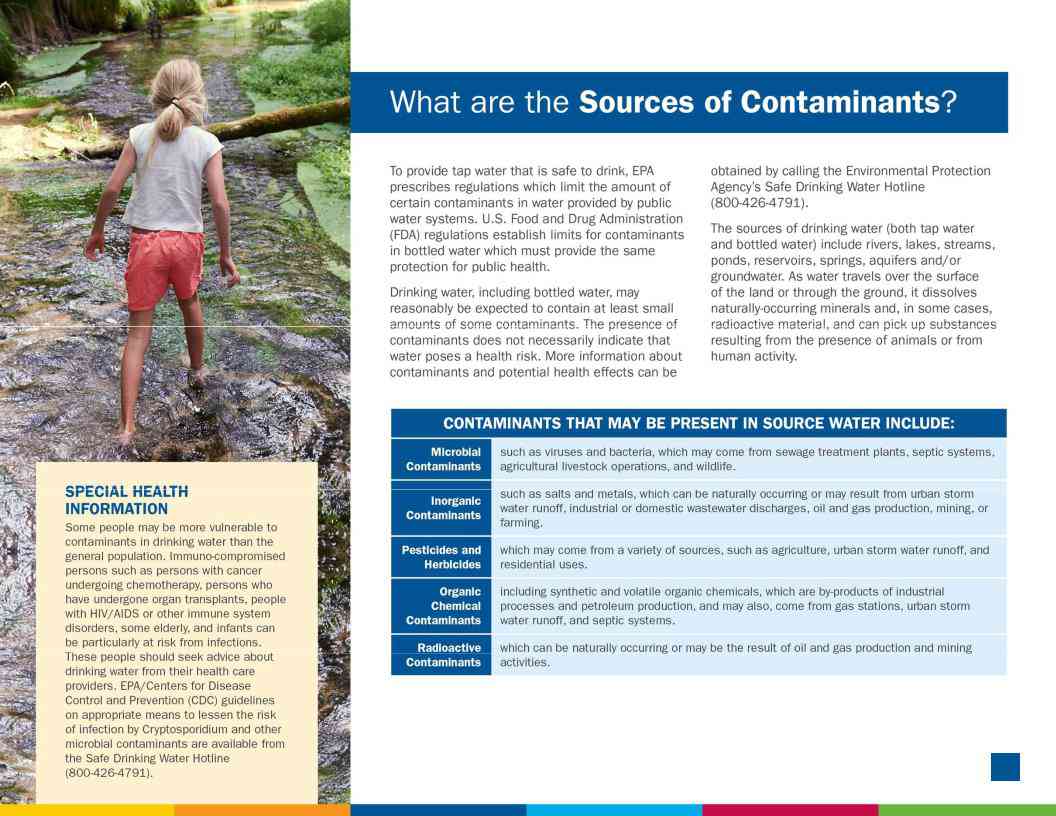
What are the Sources of Contaminants? |
6 |
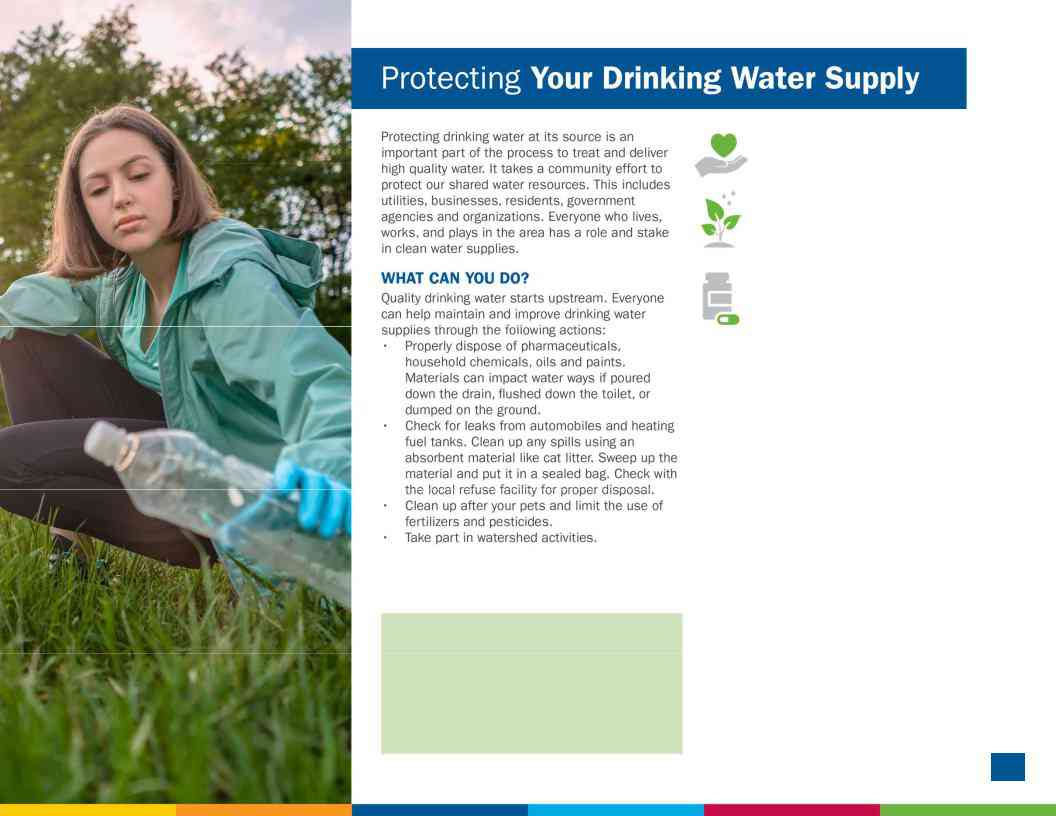
Protecting Your Drinking Water Supply |
7 |
About Lead |
8 |
Important Information About Your Water |
|
Water Quality Results |
11 |
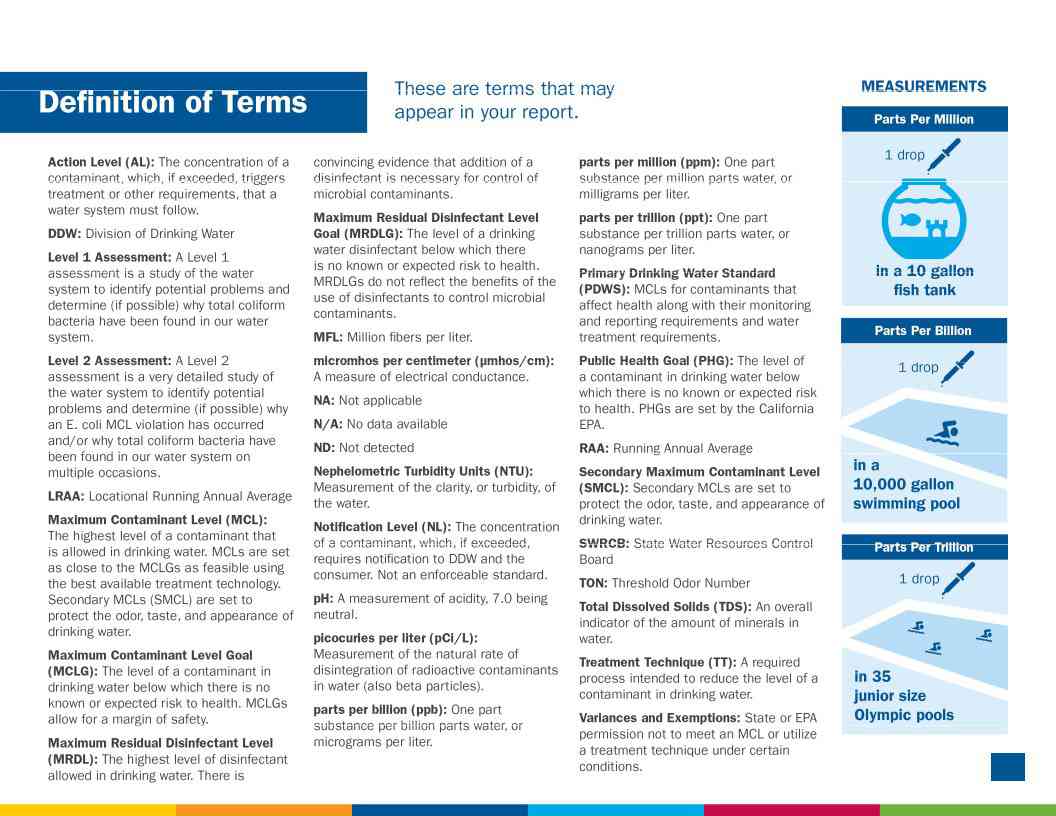
Definitions of Terms Used in Document |
12 |
Water Quality Results: Detailed Charts |
|
About Us |
17 |
Contact Us |
18 |
3
Just as California American Water are investing in research and testing, we also understand the importance of investing in the infrastructure that provides
4
WHERE YOUR WATER COMES FROM
Monterey is served by groundwater sources from the Santa Margarita, Paso Robles, and Carmel Alluvial aquifers as well as surface water from the Sand City Desalination Plant and groundwater recharged by the Pure Water Monterey Project.
Drinking water treatment technologies used in the system include reverse osmosis, iron and manganese removal, corrosion control, and disinfection for bacteriological quality. The water supply is distributed for residential and commercial use in the communities of
An assessment of the drinking water sources for the California American Water - Monterey water system was completed in February 2003. This assessment is an evaluation of drinking water sources to determine the “possible contaminating activities” (PCAs) to which a source is most vulnerable. PCAs are current or historic human activities that are actual or potential origins of contamination for a drinking water source. PCAs include activities that use, store, produce or dispose of chemicals that have the potential to contaminate drinking water supplies. A copy of the completed assessment may be viewed at California American Water, 511 Forest Lodge Road, Suite 100, Pacific Grove, CA.
SOURCE OF SUPPLY
FOR THE SYSTEM
97.6%
Surface Water
2.4% |
Groundwater |
QUICK FACTS ABOUT THE MONTEREY SYSTEM
Water sources:
Groundwater wells in Carmel Valley Groundwater Wells in Seaside Sand City Desal Plant
Pure Water Monterey Project
Water treatment:
Selection of treatment technologies was based on the quality of source waters. Treatment technologies used in the system include reverse osmosis, iron and manganese removal and corrosion control. The treated water is disinfected with chlorine for bacteriological quality before distributed for customers’ consumption.
5
6
Community Involvement: We have a proactive public outreach program to help spread the word and get people involved. This includes school education, contests, and other community activities.
Environmental Grant Program: Each year, we fund projects that improve water resources in our local communities. Pharmaceutical Collection: We sponsor drop box locations within the state for residents to safely dispose of unwanted drugs for free. This helps keep pharmaceutical products from entering water supplies.
FOR MORE INFORMATION
To learn more about your water supply and local activities, visit us online at californiaamwater.com or contact the regional Source Water Protection Lead, Dr. Jack Wang at
7
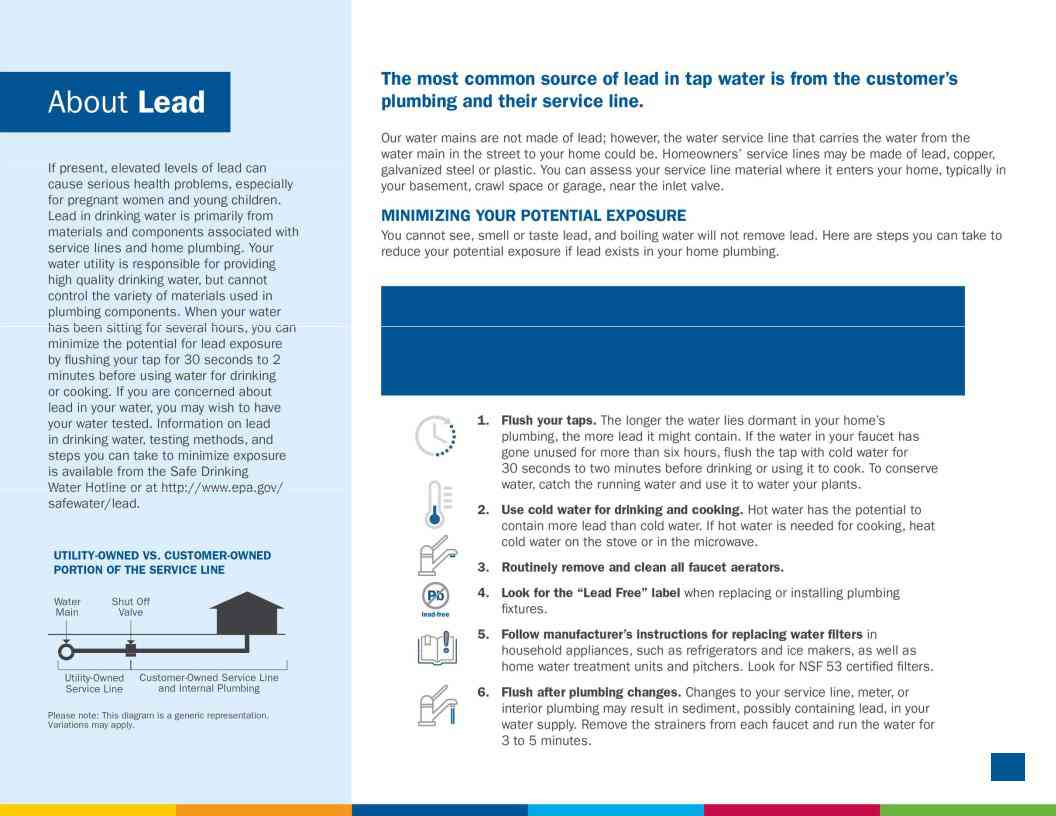
CHECK YOUR PLUMBING AND SERVICE LINE
If you live in an older home, consider having a licensed plumber check your plumbing for lead. If your service line is made of lead, and you’re planning to replace it, be sure to contact us at
8
UNREGULATED CONTAMINANT MONITORING RULE (UCMR)
The EPA created the Unregulated Contaminants Monitoring Rule (UCMR) to assist them in determining the occurrence of unregulated contaminants in drinking water and whether new regulations are warranted. The first Unregulated Contaminants Monitoring Rule (UCMR1) testing was completed in 2003 for a list of contaminants specified by the EPA. Unregulated contaminants are those for which the EPA has not established drinking water standards. UCMR2 testing was conducted between November 2008 and August 2009, and UCMR3 assessment monitoring was conducted between January 2013 and December 2016. The fourth list of contaminants to monitor as part of the UCMR was published by the EPA
in December 2016. UCMR4 testing began in 2018 and was completed in 2020. The results from the UCMR monitoring are reported directly to the EPA. The results of this monitoring are incorporated in the data tables in this report as appropriate. For more information, contact our Customer Service Center at
9
PFOA/PFOS Monitoring
PFAS refers to per- and polyfluoroalkyl substances, a class of
In accordance with Orders received from the Division of Drinking Water (DDW) California American Water is sampling designated sources for PFAS constituents. In 2019 DDW established Notification Levels (NLs) at 6.5 ppt for the PFAS constituents perfluorooctanesulfonic acid (PFOS) and 5.1 ppt for perfluorooctanoic acid (PFOA) in drinking water. In 2020 DDW established Consumer Confidence Detection Levels (CCRDL) of 4 ppt for both PFOS and PFOA.
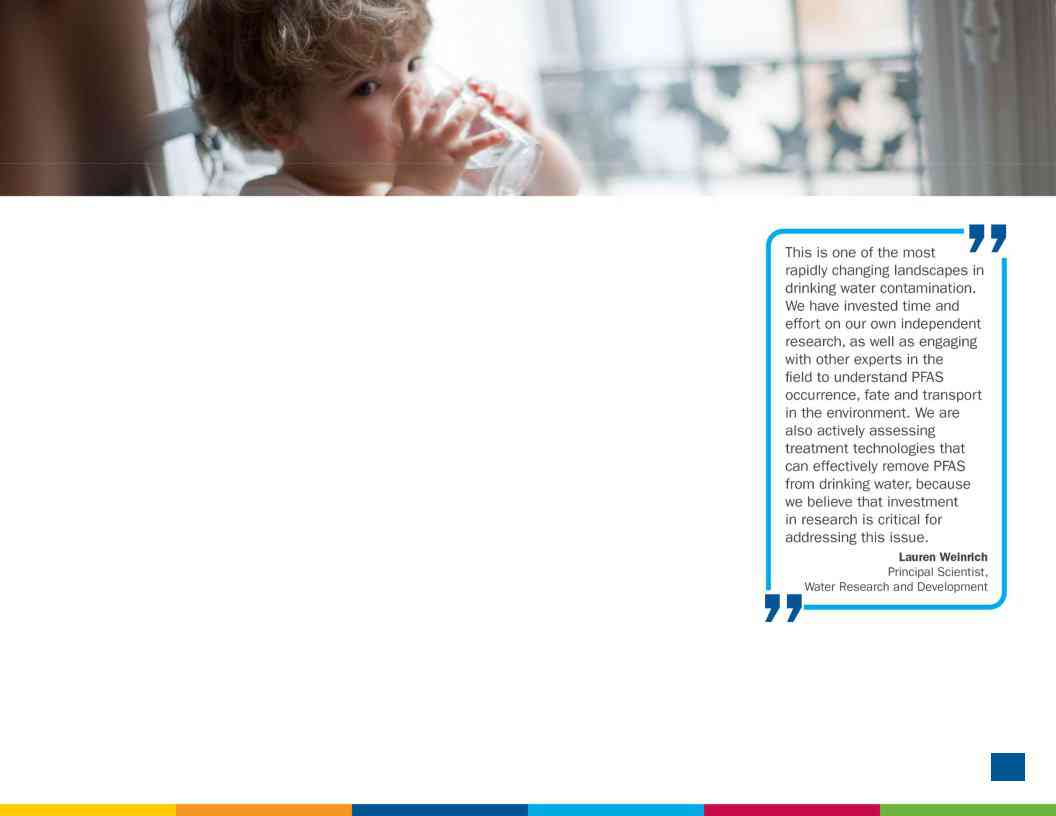
The science and regulation of PFAS and other contaminants is always evolving, and California American Water strives to be a leader in research and development. PFAS contamination is one of the most rapidly changing areas in the drinking water field. We have invested in our own independent research, as well as engaging with other experts in the field to understand PFAS occurrence in the environment. We are also actively assessing treatment technologies that can effectively remove PFAS from drinking water, because we believe that investment in research is critically important to addressing this issue.
10
WATER QUALITY STATEMENT
We are pleased to report that during calendar year 2020, the results of testing of your drinking water complied with all state and federal drinking water requirements.
For your information, we have compiled a list in the table below showing the testing of your drinking water during 2020. The Division of Drinking Water allows us to monitor for some contaminants less than once per year because the concentration of the contaminants does not change frequently. Some of our data, though representative, are more than one year old.
11
12
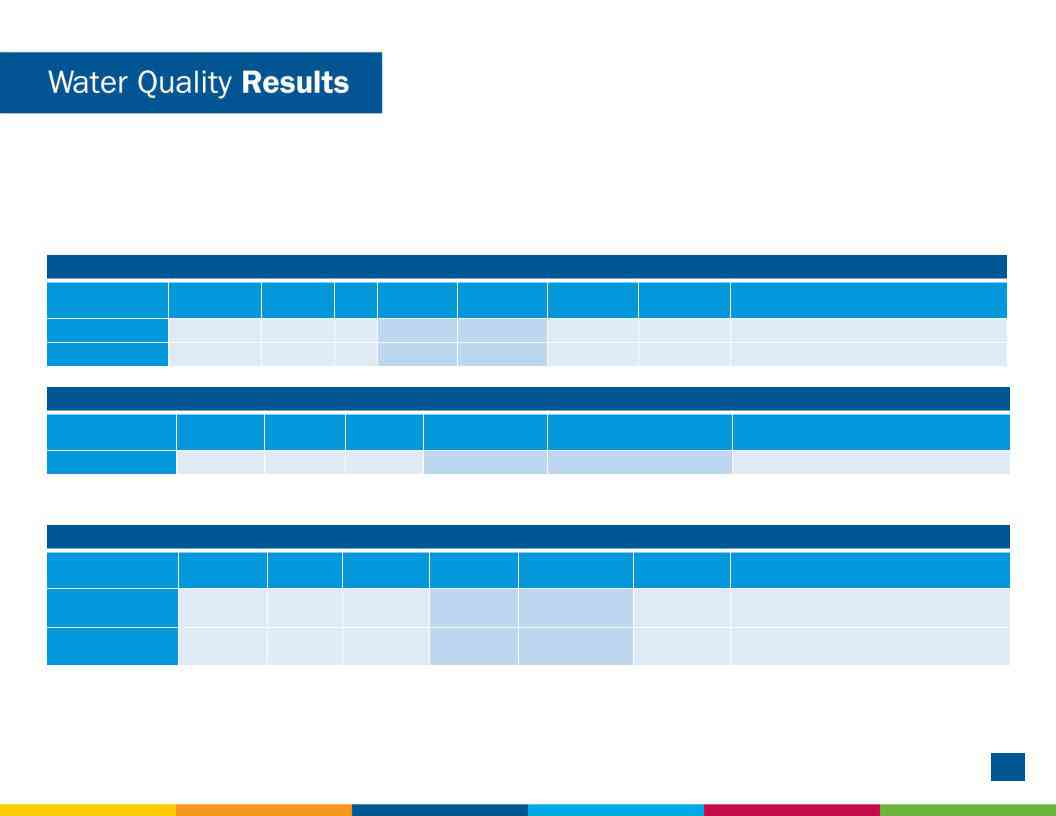
California American Water conducts extensive monitoring to determine if your water meets all water quality standards. The detections of our monitoring are reported in the following tables. While most monitoring was conducted in 2020, certain substances are monitored less than once per year because the levels do not change frequently. For help with interpreting the tables below, see the “Definition of Terms” on the previous page. Some unregulated substances are measured, but maximum contaminant levels have not been established by the government. These contaminants are shown for your information.
NOTE: Regulated contaminants not listed in the tables below were not found in the treated water supply.
LEAD AND COPPER MONITORING PROGRAM - At least 30 tap water samples collected at customers’ taps every 3 years
Substance |
Year Sampled |
Compliance |
MCLG |
Action Level |
90th Percentile |
No. of Homes |
Homes Above |
Typical Source |
(with units) |
|
Achieved |
|
(AL) |
|
Sampled |
Action Level |
|
Lead (ppb) |
2018 |
Yes |
0.2 |
15 |
2 |
31 |
0 |
Corrosion of household plumbing systems. |
Copper (ppm) |
2018 |
Yes |
0.3 |
1.3 |
0.719 |
31 |
0 |
Corrosion of household plumbing systems. |
TOTAL COLIFORM RULE - At least 27 samples collected each week in the distribution system
Substance |
Year Sampled |
Compliance |
MCLG |
MCL |
Highest Percentage |
Typical Source |
|
(with units) |
Achieved |
||||||
|
|
|
|
|
|||
Total Coliform |
2020 |
Yes |
0 |
Less than 5% |
0.725% |
Naturally present in the environment. |
NOTE: Coliforms are bacteria that are naturally present in the environment and are used as an indicator of the general bacteriological quality of the water. We are reporting the highest percentage of positive samples in any month.
DISINFECTION BYPRODUCTS - Collected in the Distribution System
Substance |
Year Sampled |
Compliance |
MCLG |
MCL |
Highest |
Range Detected |
Typical Source |
|
(with units) |
Achieved |
Compliance Result |
||||||
|
|
|
|
|
||||
Total Trihalomethanes |
2020 |
Yes |
NA |
80 |
46.4 |
ND to 70.0 |
||
(TTHMs) (ppb) |
||||||||
|
|
|
|
|
|
|
||
Haloacetic Acids |
2020 |
Yes |
NA |
60 |
22.1 |
ND to 26.4 |
||
(HAAs) (ppb) |
||||||||
|
|
|
|
|
|
|
NOTE: Compliance is based on the running annual average at each location. The Highest Compliance Result reflects the highest average at any location and the Range Detected reflects all samples from this year used to calculate the running annual average.
13
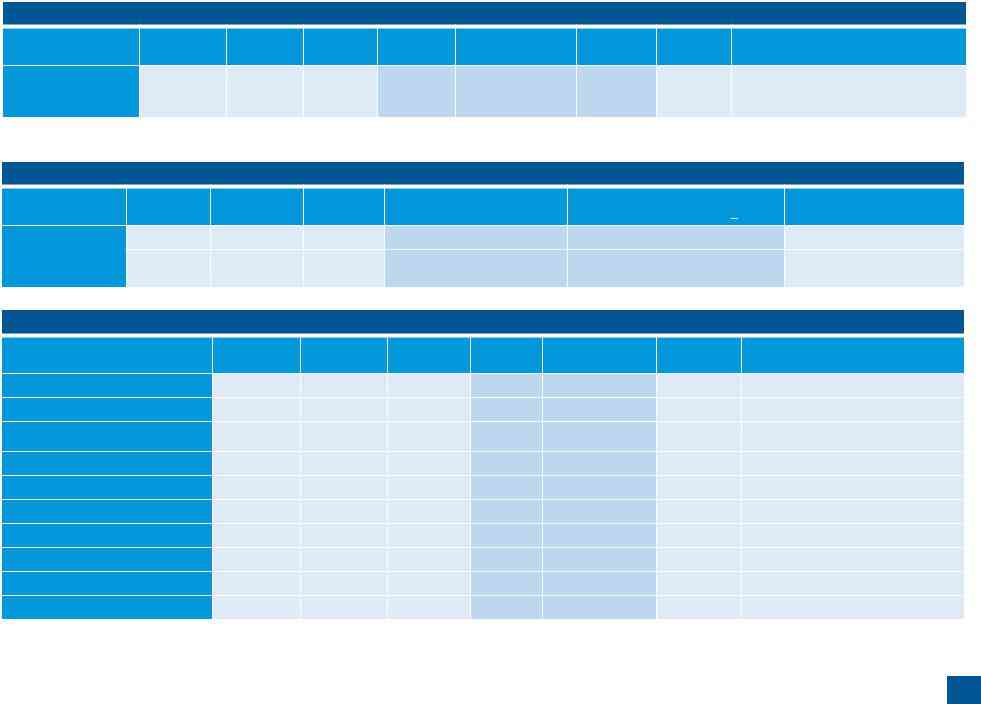
DISINFECTANTS - Collected in the Distribution System
Substance |
Year Sampled |
Compliance |
MRDLG |
MRDL |
Minimum Chlorine |
Compliance |
Range |
Typical Source |
|
(with units) |
Achieved |
Residual |
Result |
Detected |
|||||
|
|
|
|
||||||
Distribution System |
|
|
|
|
|
|
|
|
|
Chlorine Residual |
2020 |
Yes |
4 |
4 |
0.08 |
1.08 |
0.08 to 2.4 |
Water additive used to control microbes. |
|
(ppm)1 |
|
|
|
|
|
|
|
|
1 - Data represents the monthly average of chlorine residuals measured throughout our distribution system.
TURBIDITY - Continuous Monitoring at the Sand City Desalination Plant
Substance |
Year Sampled |
Compliance |
MCLG |
MCL |
Highest Single Measurement and |
Typical Source |
|
(with units) |
Achieved |
Lowest Monthly % of Samples <0.3 NTU |
|||||
|
|
|
|
||||
|
2020 |
Yes |
0 |
TT: Single result >0.5 NTU |
0.39 |
Soil runoff. |
|
Turbidity (NTU) |
2020 |
Yes |
NA |
TT: At least 95% of samples <0.1 |
99.8% |
Soil runoff. |
|
|
|||||||
|
NTU |
||||||
|
|
|
|
|
|
PRIMARY REGULATED SUBSTANCES - Collected at the Treatment Plant or Sources
Substance |
Year Sampled |
Compliance |
MCLG |
MCL |
Average |
Range |
Typical Source |
|
(with units) |
Achieved |
Compliance Result |
Detected |
|||||
|
|
|
|
|||||
Gross Alpha Particle Activity (pCi/L) |
Yes |
(0) |
15 |
1.15 |
ND to 6.54 |
Erosion of natural deposits |
||
Gross Beta Particle Activity (pCi/L) |
2012 |
Yes |
(0) |
50 |
1.35 |
ND to 4.05 |
Erosion of natural deposits |
|
Chromium VI (Hexavalent Chromium) |
2016 - 2018 |
Yes |
0.02 |
NA |
0.16 |
ND to 2.23 |
Erosion of natural deposits |
|
(ppb) |
||||||||
|
|
|
|
|
|
|
||
Radium 226 (pCi/L) |
Yes |
0.05 |
5 |
0.32 |
ND to 1.09 |
Erosion of natural deposits |
||
Radium 228 (pCi/L) |
Yes |
0.019 |
5 |
0.79 |
ND to 1.96 |
Erosion of natural deposits |
||
Uranium (pCi/L) |
2014 - 2020 |
Yes |
0.43 |
20 |
0.17 |
ND to 1.5 |
Erosion of natural deposits |
|
Arsenic (ppb) |
2020 |
Yes |
0.004 |
10 |
2.75 |
ND to 5 |
Erosion of natural deposits |
|
Fluoride (naturally occurring) (ppm)1 |
2019 |
Yes |
1 |
2.0 |
0.25 |
ND to 0.42 |
Erosion of natural deposits |
|
Nitrate as N (ppm)3 |
2020 |
Yes |
10 |
10 |
2.03 |
ND to 6.66 |
Erosion of natural deposits |
|
Selenium (ppb) |
2019 |
Yes |
30 |
50 |
1.1 |
ND to 7 |
Erosion of natural deposits |
1 – Fluoride: California American Water does not add fluoride to the water in the Monterey Peninsula area. Fluoride occurs naturally in the groundwater we serve.
14
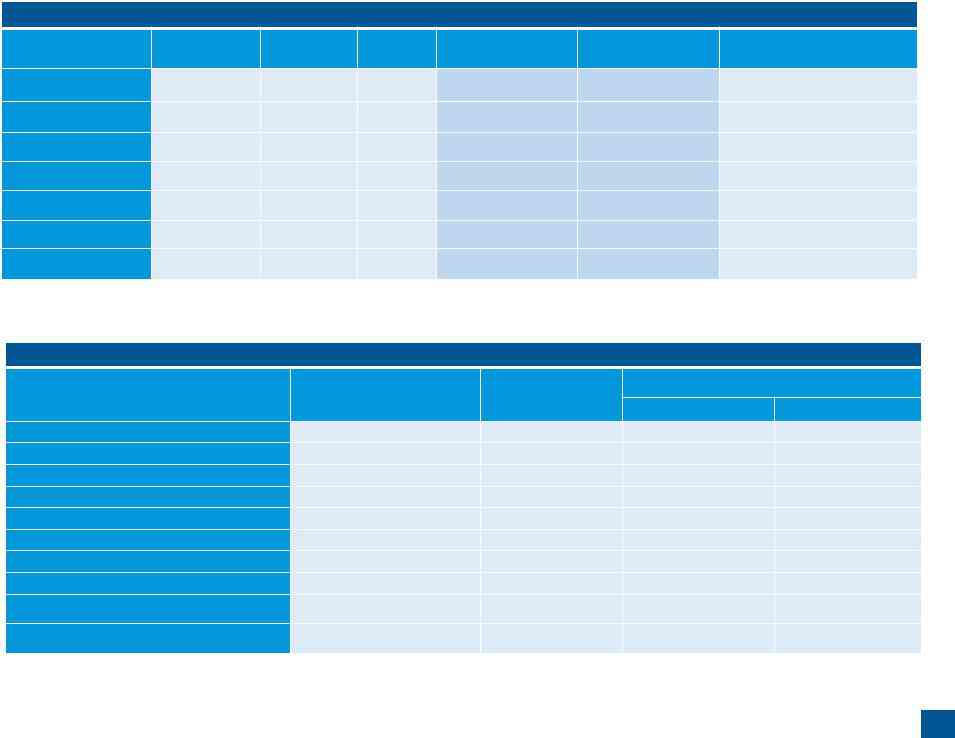
SECONDARY REGULATED SUBSTANCES - Collected at the Treatment Plant Effluent and/or at the Source
Substance |
Year Sampled |
Compliance |
SMCL |
Average |
Range Detected |
Typical Source |
|
(with units) |
Achieved1 |
Compliance Result |
|||||
|
|
|
|
||||
Chloride (ppm) |
2019 |
Yes |
500 |
51 |
10 to 202 |
Leaching from natural deposits; |
|
Seawater influence |
|||||||
|
|
|
|
|
|
||
Odor (Units) |
2020 |
Yes |
3 |
1.3 |
1 to 3 |
||
Specific Conductance |
2020 |
Yes |
1600 |
526 |
265 to 849 |
Substances that form ions when in |
|
(mmhos/cm) |
water; Seawater influence |
||||||
|
|
|
|
|
|||
Sulfate (ppm) |
2019 |
Yes |
500 |
59 |
1 to 104 |
Leaching from natural deposits |
|
Total Dissolved Solids |
2020 |
Yes |
1000 |
316 |
122 to 410 |
Leaching from natural deposits |
|
(ppm) |
|||||||
|
|
|
|
|
|
||
Turbidity (units) |
2020 |
Yes |
5 |
0.1 |
ND to 0.4 |
Soil runoff |
|
Zinc (ppm) |
2019 |
Yes |
5 |
0.02 |
ND to 0.2 |
Leaching from natural deposits; |
|
Treatment additive |
|||||||
|
|
|
|
|
|
1 – Yes: There are no PHGs, MCLGs, or mandatory standard health effects language for Secondary Substances because secondary MCLs are set based on aesthetic concerns.
OTHER SUBSTANCES OF INTEREST - Collected at the Treatment Plant Effluent and/or at the Source
Substance (with units) |
Year Sampled |
Average |
|
Range Detected |
|
|
|||
|
|
|
Low |
High |
Alkalinity as CaCO3 (ppm) |
2020 |
146 |
91 |
179 |
Boron (ppm) |
2020 |
0.6 |
ND |
1.0 |
Calcium (ppm) |
2020 |
40 |
27 |
63 |
Magnesium (ppm) |
2019 |
13 |
ND |
25 |
pH (pH Units) |
2020 |
7.52 |
6.81 |
8.17 |
Sodium (ppm) |
2019 |
45 |
16 |
132 |
Strontium (ppb) |
2019 |
227 |
ND |
500 |
Total Hardness as CaCO3 (ppm) |
2019 |
161 |
102 |
276 |
Total Hardness as Grains per Gallon (gpg) |
2019 |
9 |
6 |
16 |
Vanadium (ppb) |
2019 |
0.2 |
ND |
5 |
15
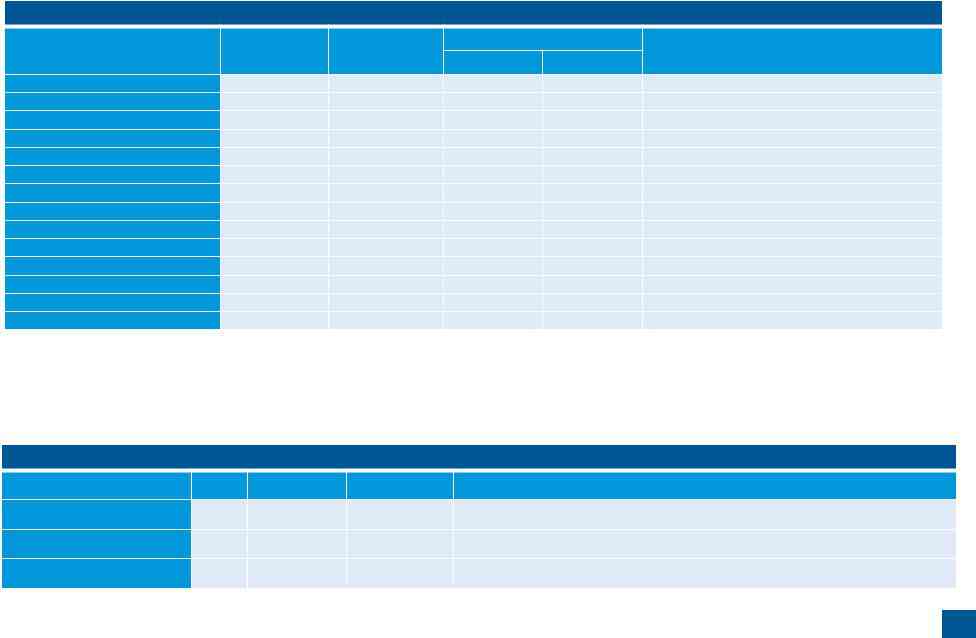
UNREGULATED CONTAMINANT MONITORING
Unregulated contaminants are those for which the EPA has not established drinking water standards. The purpose of unregulated contaminant monitoring is to assist the EPA in determining the occurrence of unregulated contaminants in drinking water and whether future regulation is necessary. Every five years, the EPA issues a new list of no more than 30 unregulated contaminants to be monitored.
ADDITIONAL WATER QUALITY PARAMETERS OF INTEREST - Water Leaving the Treatment Facility or in Distribution System
Parameter (with units) |
Year Sampled |
Average Result |
Range Detected |
Typical Source |
||
Low |
High |
|||||
|
|
|
|
|||
Bromochloromethane (ppb) |
2013 - 2015 |
0.14 |
0.08 |
0.19 |
||
Chlorate (ppb) |
2013 - 2015 |
189 |
26 |
490 |
||
Molybdenum (ppb) |
2013 - 2015 |
6 |
2.2 |
14.4 |
||
Strontium (ppb) |
2013 - 2015 |
284 |
90.8 |
397.7 |
||
Vanadium (ppb) |
2013 - 2015 |
1.41 |
0.3 |
5.6 |
||
Bromochloroacetic Acid (ppb) |
2019 |
4.1 |
0.7 |
7.4 |
||
Bromodichloroacetic acid (ppb) |
2019 |
3.8 |
ND |
6.3 |
||
Chlorodibromoacetic acid (ppb) |
2019 |
2.1 |
ND |
3.5 |
||
Dibromoacetic Acid (ppb) |
2019 |
1.8 |
0.3 |
3.3 |
||
Dichloroacetic Acid (ppb) |
2019 |
5.3 |
0.5 |
13 |
||
Monobromoacetic Acid (ppb) |
2019 |
0.3 |
ND |
0.6 |
||
Total Haloacetic Acids - Br (ppb) |
2019 |
12 |
1.4 |
21 |
||
Total Haloacetic Acids - HAA 9 (ppb) |
2019 |
22 |
2 |
40 |
||
Trichloroacetic Acid (ppb) |
2019 |
4.6 |
ND |
7.5 |
||
PER- AND POLYFLUOROALKYL SUBSTANCES
Per- or polyfluoroalkyl substances (PFASs) are
UNREGULATED PERFLUORINATED COMPOUNDS
Parameter |
Units |
Average Result |
Range Detected |
Typical Source |
|
Perfluorooctanoic Acid (PFOA) |
ppt |
1.9 |
ND to 8.2 |
Used for its emulsifier and surfactant properties in or as fluoropolymers (such as Teflon), fire |
|
fighting foams, cleaners, cosmetics, lubricants, paints, polishes, adhesives and photographic films |
|||||
|
|
|
|
||
Perfluorooctanesulfonic Acid |
ppt |
2.0 |
ND to 7.5 |
Manmade chemical; used in products for stain, grease, heat and water resistance |
|
(PFOS) |
|||||
|
|
|
|
||
Perfluorobutane sulfonic acid |
ppt |
4.0 |
ND to 17 |
Manmade chemical; used in commercial products to offer water- and |
|
(PFBS) |
|||||
|
|
|
|
16
WATER INFORMATION SOURCES
California American Water
www.californiaamwater.com
State Water Resources Control Board (State Board), Division of Drinking Water (DDW: www.waterboards.ca.gov/drinking_water/programs/index.shtml
County of Monterey Health Department
United States Environmental Protection Agency (USEPA): www.epa.gov/safewater
Safe Drinking Water Hotline: (800)
Centers for Disease Control and Prevention: www.cdc.gov
American Water Works Association: www.awwa.org
Water Quality Association: www.wqa.org
National Library of Medicine/National Institute of Health: www.nlm.nih.gov/medlineplus/drinkingwater.html
18
Reminder
Always take extra precautions, the water may be safe to drink when it leaves the sewage treatment plant but it may pick up pollutants during its way to your tap. We advise that you ask locals or hotel staff about the water quality. Also, note that different cities have different water mineral contents.