Table of Contents
Can You Drink Tap Water in San Marcos?
Yes, San Marcos's tap water is generally considered safe to drink as San Marcos has no active health based violations of the Safe Drinking Water Act (SDWA) that we are aware of. Other factors such as lead piping in a home, or low levels of pollutants on immunocompromised individuals, should also be considered, however. To find more recent info we might have, you can check out our boil water notice page, the city's water provider website, or San Marcos's local Twitter account.
According the EPA’s ECHO database, from April 30, 2019 to June 30, 2022, San Marcos's water utility, Vallecitos Wd, had 0 violations of the Safe Drinking Water Act. For more details on the violations, please see our violation history section below. This assessment is based on the Vallecitos Wd water system, other water systems in the city may have different results.
While tap water that meets the EPA health guidelines generally won’t make you sick to your stomach, it can still contain regulated and unregulated contaminants present in trace amounts that could potentially cause health issues over the long-run. These trace contaminants may also impact immunocompromised and vulnerable individuals.
The EPA is reviewing if it’s current regulations around pollutant levels in tap water are strict enough, and the health dangers posed by unregulated pollutants, like PFAS.
Water Quality Report for San Marcos Tap Water
The most recent publicly available numbers for measured contaminant levels in San Marcos tap water are in its 2020 Water Quality Report. As you can see, there are levels which the EPA considers to be acceptable, but being below the maximum allowable level doesn’t necessarily mean the water is healthy.
Lead in tap water, for example, is currently allowed at up to 15ppb by the EPA, but it has set the ideal goal for lead at zero. This highlights how meeting EPA standards doesn’t necessarily mean local tap water is healthy.
EPA regulations continue to change as it evaluates the long term impacts of chemicals and updates drinking water acceptable levels. The rules around arsenic, as well as, lead and copper are currently being re-evaluated.
There are also a number of "emerging" contaminants that are not currently. For example, PFAS (Per- and polyfluoroalkyl substances), for which the EPA has issued a health advisory. PFAS are called "forever chemicals" since they tend not to break down in the environment or the human body and can accumulate over time.
We recommend looking at the contaminants present in San Marcos's water quality reports, or getting your home's tap water tested to see if you should be filtering your water.
San Marcos Tap Water Safe Drinking Water Act Violation History - Prior 10 Years
Below is a ten year history of violations for the water system named Vallecitos Wd for San Marcos in California. For more details please see the "What do these Violations Mean?" section below.
Is there Lead in San Marcos Water?
Based on the EPA’s ECHO Database, 90% of the samples taken from the San Marcos water system, Vallecitos Wd, between sample start date and sample end date, were at or below, 0.0 mg/L of lead in San Marcos water. This is 0% of the 0.015 mg/L action level. This means 10% of the samples taken from San Marcos contained more lead.
While San Marcos water testing may have found 0.0 mg/L of lead in its water, that does not mean your water source has the same amount. The amount of lead in water in a city can vary greatly from neighborhood to neighborhood, or even building to building. Many buildings, particularly older ones, have lead pipes or service lines which can be a source of contamination. To find out if your home has lead, we recommend getting you water tested.
No amount of lead in water is healthy, only less dangerous. As lead accumulates in our bodies over time, even exposure to relatively small amounts can have negative health effects. For more information, please check out our Lead FAQ page.
Are there PFAS in San Marcos Tap Water?
Currently, testing tap water for PFAS isn’t mandated on a national level. We do have a list of military bases where there have been suspected or confirmed leaks. There appears to be no military bases near San Marcos with suspected leaks.
With many potential sources of PFAS in tap water across the US, the best information we currently have about which cities have PFAS in their water is this ewg map, which you can check to see if San Marcos has been evaluated for yet.
Our stance is better safe than sorry, and that it makes sense to try to purify the tap water just in case.
What do these Violations Mean?
Safe Drinking Water Act Violations categories split into two groups, health based, and non-health based. Generally, health based violations are more serious, though non-health based violations can also be cause for concern.
Health Based Violations
- Maximum contaminant levels (MCLs) - maximum allowed contaminant level was exceeded.
- Maximum residual disinfectant levels (MRDLs) - maximum allowed disinfectant level was exceeded.
- Other violations (Other) - the exact required process to reduce the amounts of contaminants in drinking water was not followed.
Non-Health Based Violations
- Monitoring and reporting violations (MR, MON) - failure to conduct the required regular monitoring of drinking water quality, and/or to submit monitoring results on time.
- Public notice violations (Other) - failure to immediately alert consumers if there is a serious problem with their drinking water that may pose a risk to public health.
- Other violations (Other) - miscellaneous violations, such as failure to issue annual consumer confidence reports or maintain required records.
SDWA Table Key
| Field | Description |
|---|---|
| Compliance Period | Dates of the compliance period. |
| Status |
Current status of the violation.
|
| Health-Based? | Whether the violation is health based. |
| Category Code |
The category of violation that is reported.
|
| Code | A full description of violation codes can be accessed in the SDWA_REF_CODE_VALUES (CSV) table. |
| Contaminant Code | A code value that represents a contaminant for which a public water system has incurred a violation of a primary drinking water regulation. |
| Rule Code |
Code for a National Drinking Water rule.
|
| Rule Group Code |
Code that uniquely identifies a rule group.
|
| Rule Family Code |
Code for rule family.
|
For more clarification please visit the EPA's data dictionary.
San Marcos Water - Frequently Asked Questions
| By Phone: | 760-744-0460 |
| By Email: | gpruim@vwd.org |
| By Mail: | 201 VALLECITOS DE ORO SAN MARCOS, CA, 92069 |
Existing customers can login to their Vallecitos Wd account to pay their San Marcos water bill by clicking here.
If you want to pay your Vallecitos Wd bill online and haven't made an account yet, you can create an account online. Please click here to create your account to pay your San Marcos water bill.
If you don't want to make an account, or can't remember your account, you can make a one-time payment towards your San Marcos water bill without creating an account using a one time payment portal with your account number and credit or debit card. Click here to make a one time payment.
Moving to a new house or apartment in San Marcos means you will often need to put the water in your name with Vallecitos Wd. In order to put the water in your name, please click the link to the start service form below. Start service requests for water bills typically take two business days.
Leaving your house or apartment in San Marcos means you will likely need to take your name off of the water bill with Vallecitos Wd. In order to take your name off the water bill, please click the link to the stop service form below. Stop service for water bills requests typically take two business days.
USER SUBMITTED RATINGS
- Drinking Water Pollution and Inaccessibility
- Water Pollution
- Drinking Water Quality and Accessibility
- Water Quality
The above data is comprised of subjective, user submitted opinions about the water quality and pollution in San Marcos, measured on a scale from 0% (lowest) to 100% (highest).
Related FAQS
San Marcos Water Quality Report (Consumer Confidence Report)
The EPA mandates that towns and cities consistently monitor and test their tap water. They must report their findings in an annual Consumer Confidence Report. Below is the most recent water quality report from San Marcos's Water. If you would like to see the original version of the report, please click here.
WATER QUALITY REPORT
2020
2020 Water Quality Report
For more than 60 years, the Vallecitos Water District (Vallecitos) has taken pride in the water it delivers to its now more than 102,000 residents. As a result
of its commitment to excellence, Vallecitos is proud to provide the 2020 water quality test results for drinking water delivered to its customers.
After more than 150 types of tests conducted by its wholesalers – Metropolitan Water District of South- ern California (MWD) and San Diego County Water Authority (SDCWA) – and additional tests performed by the City of Oceanside, Olivenhain Municipal Water District (OMWD) and Vallecitos, it has been concluded that your water either met or exceeded
all state and federal potable drinking water standards. Along with these tests, your drinking water went through a treatment process that included filtering and disinfecting to ensure acceptable quality. Results of our own testing, along with the City of Oceanside’s, OMWD’s and our wholesalers’ monitoring are found in the tables of this report.
This publication is a summary of last year’s water quality. Included are details about where your water comes from, what it contains, and how
it compares to state and federal standards.
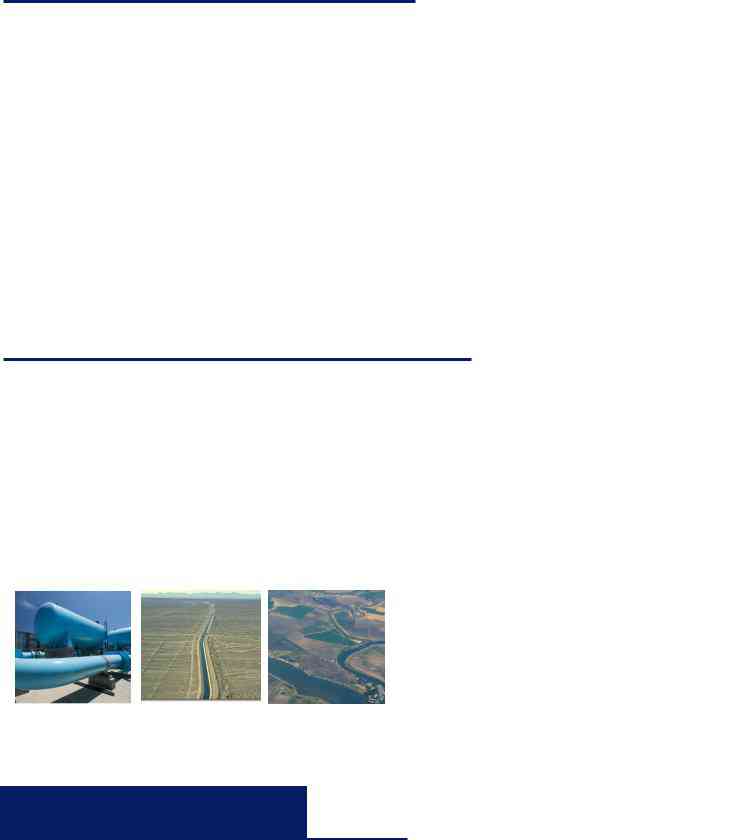
Origins of Your Drinking Water
As of 2014, Vallecitos customers received 100 percent imported water from SDCWA, which purchased the water from MWD from Northern California and the Colorado River. In November of 2015, to reduce dependence on imported water and provide custom- ers an increased level of reliability despite drought and other regulatory issues, Vallecitos customers began receiving ocean water from the Western Hemisphere’s largest desalination treatment plant. The Carlsbad Claude “Bud” Lewis Desalination Plant provides superior quality water free of salt and
virtually any mineral, biological or organic com- pounds by taking water from Carlsbad’s Agua Hedionda Lagoon, processing it, and then distribut- ing it through a
Whether imported or local, your water remains safe during its journey due to increased security at key facilities, increased water sampling, and aerial and ground patrols. Protecting your water doesn’t end with the thousands of tests performed throughout the year. Vallecitos also supports regulatory changes in public policy to improve water quality.
Claude |
Colorado River |
|
“Bud” Lewis |
via the |
Joaquin Delta via |
Desalination Plant |
Colorado River |
the |
in Carlsbad |
Aqueduct |
CA Aqueduct |
The Water We Drink
The end result is more than 5 billion gallons of an exceptional product delivered annually through 19 operational storage reservoirs and 350 miles of pipeline to a
The U.S. Congress has directed the U.S. Environmental Protection Agency (USEPA) to require water systems to report the quality of the drinking water they serve annually. Vallecitos supports this regulation and has provided Water Quality Reports and other water quality data to all of its customers for many years.
The Reason for Contaminants
Drinking water, including bottled water, may reasonably be expected to contain at least small amounts of some contaminants. The presence of contaminants does not necessarily indicate that water poses a health
risk. More information about contaminants and potential health effects can be obtained by calling the USEPA’s Safe Drinking Water Hotline at (800)
In order to ensure that tap water is safe to drink, the USEPA and the State Water Resources Control Board prescribe regulations that limit the amount of
certain contaminants in water provided by public water systems. Vallecitos and its water wholesalers treat the water according to these regulations.
The sources of drinking water (both bottled and tap water) include rivers, lakes, streams, reservoirs, ponds, springs, and wells. As water travels over the surface of the land or through the ground,
it dissolves
Contaminants possibly present in source water before treatment include:
- Microbial contaminants, such as viruses and bacteria, that may come from sewage treatment plants, septic systems, agricultural livestock operations, and wildlife.
-
Inorganic contaminants, such as salts and metals, that can be
naturally-occurring or result from urban stormwater runoff, industrial or domestic wastewater discharges, oil and gas production, mining, or farming. - Pesticides and herbicides, which may come from a variety of sources, such as agriculture, urban stormwater runoff, and residential uses.
-
Organic chemical contaminants, including synthetic and volatile organic compounds that are
by-products of industrial processes and petroleum production and can come from gas stations, urban stormwater runoff, agricultural application and septic systems. -
Radioactive contaminants, which can be
naturally-occurring or the result of oil and gas production and mining activities.
Health Advisories Regarding Your Water
Some people may be more vulnerable to contaminants in drinking water than the general population.
The tables below list all the drinking water contaminants tested for during the 2020 calendar year. Thousands of water quality tests were performed on your drinking water last year. Many more parameters were tested for and not found. The results in this report show that your water met, and in most cases exceeded, all of the stringent state (State Water Resources Control Board) and federal (U.S. Environmental Protection Agency) water quality standards relating to public health and aesthetics, such as taste, odor and color. Unless otherwise noted, the data in the following tables reflect testing from January 1, 2020, through December 31, 2020. The monitoring of certain contaminants is not required annually since they are not expected to vary significantly from year to year. Therefore, though representative of the water quality, some of the data may be more than one year old.
Summary of Vallecitos Water District's 2020 Water Quality Analysis
|
|
|
State or |
|
|
|
Treatment Plant Effluents |
|
|
||
|
|
|
Federal |
PHG |
|
Twin Oaks |
Skinner |
Weese |
Carlsbad |
Olivenhain |
Major Sources in |
|
|
|
MCL |
(MCLG) |
Range |
Treatment |
Treatment |
Treatment |
Desalination |
Treatment |
|
|
Parameter |
Units |
[MRDL] |
[MRDLG] |
Average |
Plant |
Plant |
Plant |
Plant |
Plant |
Drinking Water |
|
Percent State |
% |
NA |
NA |
Range |
NR |
0 - 84 |
NR |
NA |
0 - 82 |
NA |
|
Project Water |
Average |
32 |
34 |
|||||||
|
|
|
|
|
|
|
|
||||
PRIMARY STANDARDS - Mandatory
CLARITY
Combined Filter |
NTU |
|
0.3 |
NA |
Average |
0.012 - 0.014 |
0.09 |
0.27 |
0.08 |
% ≤ 0.3 |
Soil runoff |
Effluent Turbidity |
% |
|
95 (a) |
% ≤ 0.1 |
100% |
100% |
100% |
100% |
100% |
||
|
|
|
|||||||||
MICROBIOLOGICAL |
|
|
|
|
|
|
|
|
|
|
|
Total Coliform Bacteria (b) |
% |
|
5.0 |
(0) |
Range |
ND |
NA |
ND |
ND |
ND |
Naturally present in the environment |
|
Average |
||||||||||
|
|
|
|
|
|
|
|
|
|
|
|
E. coli (c) |
(c) |
|
(c) |
(0) |
Range |
ND |
NA |
ND |
ND |
ND |
Human and animal fecal waste |
|
Average |
||||||||||
|
|
|
|
|
|
|
|
|
|
|
|
Heterotrophic Plate (d) |
CFU/mL |
|
TT |
NA |
Range |
NR |
ND - 1 |
NR |
NA |
NR |
Naturally present in the environment |
|
Average |
ND |
|||||||||
|
|
|
|
|
|
|
|
|
|
||
INORGANIC CHEMICALS |
|
|
|
|
|
|
|
|
|
|
|
Arsenic |
ppb |
|
10 |
0.004 |
Range |
ND |
ND |
NA |
ND |
NR |
Natural deposits erosion; runoff from orchards; glass and |
|
Average |
1.1 |
electronics production wastes |
||||||||
|
|
|
|
|
|
|
|
|
|||
Barium |
ppb |
|
1,000 |
2,000 |
Range |
ND |
ND |
NA |
ND |
NR |
Oil and metal refineries discharges; natural deposits erosion |
|
Average |
80 |
|||||||||
|
|
|
|
|
|
|
|
|
|
||
|
|
|
Optimal Fluoride Control Range |
0.6 - 1.2 |
NA |
NA |
NA |
NA |
Erosion of natural deposits; water additive for dental health; |
||
Fluoride |
|
|
|
|
Range |
0.5 - 0.8 |
0.6 - 0.9 |
|
0.63 - 0.83 |
||
ppm |
|
2.0 |
1 |
Not Added |
discharge from fertilizer and aluminum factories |
||||||
(e) |
|
Average |
0.6 |
0.7 |
0.705 |
0.74 |
|||||
|
|
|
|
|
|
||||||
Nitrate (as N) (f) |
ppm |
|
10 |
10 |
Range |
ND - 0.4 |
ND |
ND - 0.28 |
ND |
NR |
Runoff and leaching from fertilizer use; sewage; natural |
|
Average |
ND |
0.19 |
deposits erosion |
|||||||
|
|
|
|
|
|
|
|
||||
RADIOLOGICALS |
|
|
|
|
|
|
|
|
|
|
|
Gross Alpha |
pCi/L |
|
15 |
(0) |
Range |
ND |
ND - 3 |
ND |
ND |
NR |
Erosion of natural deposits |
Particle Activity |
|
Average |
ND |
ND |
|||||||
|
|
|
|
|
|
|
|
||||
Gross Beta |
pCi/L |
|
50 |
(0) |
Range |
ND |
ND - 5 |
NA |
ND |
NR |
Decay of natural and |
Particle Activity (g) |
|
Average |
ND |
ND |
NA |
||||||
|
|
|
|
|
|
|
|||||
Uranium |
pCi/L |
|
20 |
0.43 |
Range |
Single/Sample |
ND - 2 |
NA |
ND |
NR |
Erosion of natural deposits |
|
Average |
1 |
2 |
1.10 |
|||||||
|
|
|
|
|
|
|
|
||||
DISINFECTION |
|
|
|
|
|
|
|
||||
Bromate (h) |
ppb |
|
10 |
0.1 |
Range |
ND - 7.4 |
ND - 5.6 |
NR |
NA |
NR |
|
|
Average |
2.8 |
2.5 |
||||||||
|
|
|
|
|
|
|
|
|
|||
DBP Precursors |
ppm |
|
TT |
NA |
Range |
2 - 2.5 |
1.9 - 2.6 |
NR |
NA |
NR |
Various natural and |
Control (TOC) |
|
Average |
2.2 |
2.3 |
|||||||
|
|
|
|
|
|
|
|
||||
This analysis report lists only the detected parameters which are required by law to be published. However, more than 150 parameters were monitored. If you would like a copy of the full reports, including the
or the reports can be viewed on our website at www.vwd.org .
Source Water Information
For information regarding the Source Water Assessment, the following contacts are provided:
For information on the Lake Skinner source water and a source water assessment, please contact Mic Stewart with MWD at
-
217-5696 or mstewart@mwdh2o.com.
For information on SDCWA’s water treatment plants, including the Twin Oaks Valley Water Treatment Plant or the Claude “Bud” Lewis Carlsbad Desalination Plant, please contact Chris Castaing with SDCWA at (760)
For more information on OMWD’s DCMWTP or distribution system, please contact OMWD’s Operations Manager at (760)
For more information on Oceanside’s Weese Treatment plant, please contact Oceanside’s Chief Plant Operator, Tim Bailey at
-
908-6545 or sterlingbailey33@gmail.com. An additional Oceanside contact is William Reedy, Water Treatment Supervisor at
-
801-0474 or wreedy@oceansideca.org.
Summary of Vallecitos Water District's 2020 Water Quality Analysis - Continued
Parameter
|
State or |
|
|
|
Treatment Plant Effluents |
|
||
|
Federal |
PHG |
|
Twin Oaks |
Skinner |
Weese |
Carlsbad |
Olivenhain |
|
MCL |
(MCLG) |
Range |
Treatment |
Treatment |
Treatment |
Desalination |
Treatment |
Units |
[MRDL] |
[MRDLG] |
Average |
Plant |
Plant |
Plant |
Plant |
Plant |
Major Sources in
Drinking Water
SECONDARY STANDARDS - Aesthetic Standards - Data provided by the San Diego County Water Authority, Metropolitan Water District, Olivenhain Municipal Water District, and the City of Oceanside.
Aluminum (i) |
ppb |
200 |
600 |
Range |
ND |
ND - 200 |
5.3 - 150 |
ND |
NR |
Residue from water treatment process; natural deposits |
|
Highest RAA |
108 |
90 |
erosion |
||||||||
|
|
|
|
|
|
|
|||||
Chloride |
ppm |
500 |
NA |
Range |
73 - 81 |
81 - 92 |
58 - 88 |
54 - 100 |
NR |
Runoff/leaching from natural deposits; seawater influence |
|
Average |
77 |
86 |
74 |
74.6 |
|||||||
|
|
|
|
|
|
||||||
Color |
Units |
15 |
NA |
Range |
ND |
1 - 2 |
ND - 3 |
ND |
NR |
Naturally occurring organic materials |
|
Average |
2 |
ND |
|||||||||
|
|
|
|
|
|
|
|
||||
Manganese |
ppb |
50 |
NL = 500 |
Range |
ND |
ND |
NA |
ND |
NR |
Leaching from natural deposits |
|
Average |
|||||||||||
|
|
|
|
|
|
|
|
|
|
||
Odor Threshold (j) |
TON |
3 |
NA |
Range |
ND |
2 |
ND |
ND |
NR |
Naturally occurring organic materials |
|
Average |
|||||||||||
|
|
|
|
|
|
|
|
|
|
||
Silver |
ppb |
100 |
NA |
Range |
ND |
ND |
NR |
ND |
NR |
Industrial discharges |
|
Average |
|||||||||||
|
|
|
|
|
|
|
|
|
|
||
Specific Conductance |
µS/cm |
1,600 |
NA |
Range |
Single/Sample |
796 - 956 |
NR |
NR |
Substances that form ions in water; seawater influence |
||
Average |
660 |
876 |
404 |
||||||||
|
|
|
|
|
|
|
|||||
Sulfate |
ppm |
500 |
NA |
Range |
63 - 100 |
152 - 208 |
64 - 237 |
12 - 16.7 |
NR |
Runoff/leaching from natural deposits; industrial wastes |
|
Average |
82 |
180 |
155 |
13.68 |
|||||||
|
|
|
|
|
|
||||||
Total Dissolved Solids |
ppm |
1,000 |
NA |
Range |
Single/Sample |
472 - 588 |
330 - 595 |
140 - 276 |
NR |
Runoff/leaching from natural deposits |
|
(TDS) |
Average |
300 |
530 |
485 |
205 |
||||||
|
|
|
|
|
|||||||
Turbidity (a) |
NTU |
5 |
NA |
Range |
ND |
ND |
0.10 - 0.40 |
ND - 0.76 |
NR |
Soil runoff |
|
Average |
0.15 |
0.1 |
|||||||||
|
|
|
|
|
|
|
|
ABBREVIATIONS AND DEFINITIONS
|
A |
- |
Absent |
|
NRA |
- No Running Average - Single Sample Collected |
||
CFU/mL |
- |
|
NR |
- |
Not Reported |
|||
DBP |
- |
Disinfection |
ND |
- |
Not Detected |
|||
MCL |
- Maximum Contaminant Level - The highest level of a contaminant |
NTU |
- |
Nephelometric Turbidity Units |
||||
|
|
|
that is allowed in drinking water. Primary MCLs are set |
as close |
NL |
- Notification Level - The level at which notification of the public water system's |
||
|
|
|
to the PHGs (or MCLGs) as is economically and technologically |
|
|
governing body is required. |
||
|
|
|
feasible. Secondary MCLs are set to protect the odor, |
|
pCi/L |
- |
picoCuries per liter |
|
|
|
|
taste and appearance of drinking water. |
PHG |
- Public Health Goal - The level of a |
contaminant in drinking water below which |
||
MCLG |
- Maximum Contaminant Level Goal - The level of a contaminant in |
|
|
there is no known or expected risk to health. PHGs are set by the California |
||||
|
|
|
drinking water below which there is no known or expected risk |
|
|
Evironmental Protection Agency. |
||
|
|
|
to health. MCLGs are set by the U.S. Environmental |
Protection |
ppb |
- parts per billion or micrograms per |
liter (µg/L) |
|
|
|
|
Agency. |
|
ppm |
- parts per million or milligrams per liter (mg/L) |
||
MPN |
- |
Most Probable Number |
|
RAA |
- |
Running Annual Average |
|
|
MRDL |
- Maximum Residual Disinfectant Level - The highest level |
SI |
- |
Saturation Index (Langelier) |
|
|||
|
|
|
of a disinfectant allowed in drinking water. There is |
|
TOC |
- |
Total Organic Carbon |
|
|
|
|
convincing evidence that addition of a disinfectant is |
|
TT |
- Treatment Technique - A required |
process intended to reduce the level of |
|
|
|
|
necessary for control of microbial contaminants. |
|
|
|
a contaminant in drinking water. |
|
MRDLG |
- Maximum Residual Disinfectant Level Goal - The level |
of a |
µS/cm |
- microSiemen per centimeter; also equivalent to µmho/cm (micromho |
||||
|
|
|
drinking water disinfectant below which there is no known |
|
|
per centimeter) |
||
|
|
|
or expected risk to health. MRDLGs do not reflect the benefits |
Primary Standards |
- (Primary Drinking Water Standards) - MCLs and MRDLs are set to provide the |
|||
|
|
|
of the use of disinfectants to control microbial contaminants. |
|
|
maxiumum feasable protection to public health. They regulate contaminant |
||
|
N |
- |
Nitrogen |
|
|
|
levels based on toxicity and adverse health affects. |
|
|
NA |
- |
Not Applicable |
|
Secondary Standards |
- (Secondary Drinking Water Standards) - Requirments that ensure |
||
|
|
|
|
|
|
|
appearance, taste and smell of drinking water are acceptable. |
|
|
|
|
|
|
|
|
|
|
FOOTNOTES
|
(a) |
- The turbidity level of the filtered water shall be less than or equal to 0.3 NTU (0.1 NTU at Twin Oaks Treatment Plant) in 95% of the measurements |
||||
|
|
|
taken each month and shall not exceed 1 NTU at anytime. The less than or equal to 0.3 NTU in 95% measurement values are Treatment Technique requirements. |
|||
|
|
|
Turbidity is a measure of the cloudiness of the water and is an indicator of treatment performance. |
|||
|
|
|
The monthly averages and ranges of turbidity shown in the Secondary Standards section were based on the treatment plant effluents. |
|||
|
(b) |
- |
Total coliform MCLs: No more than 5.0% of the monthly samples may be total |
|||
|
|
|
sampling from all the treatment plants. The MCL was not violated. |
|||
|
(c) |
- |
E. coli MCLs: The occurrence of 2 consecutive total |
|||
|
|
|
acute MCL violation. The MCL was not violated. |
|||
|
(d) |
- All distribution samples collected had detectable total chlorine residuals and no HPC was required. HPC reporting level is 1 CFU/mL. |
||||
|
(e) |
- MWD, SDCWA, and OMWD were in compliance with all provisions of the State's Fluoridation System Requirements. |
||||
|
(f) |
- State MCL is 45 mg/L as nitrate, which equals 10 mg/L |
as N. |
|||
|
(g) |
- SWRCB considers 50 pCi/L to be the level of concern for beta particles; the gross beta particle activity MCL is 4 millirem/year annual dose equivalent to the total |
||||
|
|
|
body or any |
internal organ. |
||
|
(h) |
- Reporting level is 3.0 ppb for Bromate. |
|
|
||
|
(i) |
- Aluminum and copper both have primary and secondary |
standards. |
|||
|
(j) |
- Metropolitan utilizes a |
||||
|
|
|
|
|
|
|
Summary of Vallecitos Water District's 2020 Water Quality Analysis - Continued
Other Detected Constituents That May be of Interest to Consumers
Parameter
|
State or |
|
|
|
Treatment Plant Effluents |
|
||
|
Federal |
PHG |
|
Twin Oaks |
Skinner |
Weese |
Carlsbad |
Olivenhain |
|
MCL |
(MCLG) |
Range |
Treatment |
Treatment |
Treatment |
Treatment |
Treatment |
Units |
[MRDL] |
[MRDLG] |
Average |
Plant |
Plant |
Plant |
Plant |
Plant |
Major Sources In
Drinking Water
Alkalinity |
ppm |
NA |
NA |
Range |
Single/Sample |
105 - 121 |
79 - 123 |
46 - 104 |
NR |
Runoff/leaching of natural deposits; carbonate, bicarbonate, |
|
Average |
97 |
113 |
100 |
64.43 |
hydroxide, and occasionally borate, silicate, and phosphate |
||||||
|
|
|
|
|
|||||||
Boron |
ppb |
NL = 1,000 |
NA |
Range |
Single/Sample |
130 |
NA |
360 - 780 |
NR |
Runoff/leaching from natural deposits; industrial wastes; |
|
Average |
130 |
550 |
naturally occuring in ocean water |
||||||||
|
|
|
|
|
|
|
|||||
Calcium |
ppm |
NA |
NA |
Range |
29 - 37 |
52 - 72 |
27 - 73 |
16.68 - 31.88 |
NR |
Runoff/leaching from natural deposits |
|
Average |
33 |
62 |
53 |
22.68 |
|||||||
|
|
|
|
|
|
||||||
Chlorate |
ppb |
NL = 800 |
NA |
Range |
180 - 290 |
34 |
NR |
NA |
NR |
||
Average |
255 |
processes |
|||||||||
|
|
|
|
|
|
|
|
||||
Chromium VI (a) |
ppb |
NA |
0.02 |
Range |
ND |
ND |
NR |
NA |
NR |
Industrial waste discharge; could be naturally present as |
|
Average |
ND |
well |
|||||||||
|
|
|
|
|
|
|
|
||||
Corrosivity (b) |
AI |
NA |
NA |
Range |
Single/Sample |
12.3 - 12.5 |
NR |
8.52 - 10.88 |
NR |
Elemental balance in water; affected by temperature, other |
|
(Agressiveness Index) |
Average |
12 |
12.4 |
10.58 |
factors |
||||||
|
|
|
|
|
|||||||
Corrosivity (c) (Saturation |
SI |
NA |
NA |
Range |
Single/Sample |
0.39 - 0.73 |
NR |
0.04 - 0.63 |
NR |
Elemental balance in water; affected by temperature, other |
|
Index) |
Average |
0.41 |
0.56 |
0.31 |
factors |
||||||
|
|
|
|
|
|||||||
Hardness |
ppm |
NA |
NA |
Range |
120 - 150 |
211 - 273 |
120 - 280 |
41.7 - 79.7 |
NR |
The sum of naturally occurring |
|
Average |
135 |
242 |
210 |
56.71 |
the water |
||||||
|
|
|
|
|
|||||||
Magnesium |
ppm |
NA |
NA |
Range |
13 - 15 |
20 - 26 |
12 - 25 |
0.89 - 0.98 |
NR |
Runoff/leaching from natural deposits |
|
Average |
14 |
23 |
19 |
0.93 |
|||||||
|
|
|
|
|
|
||||||
ppt |
NL = 10 |
3 |
Range |
Single/Sample |
4.2 |
NR |
NA |
NR |
|||
(NDMA) |
Average |
ND |
processes |
||||||||
|
|
|
|
|
|
|
|||||
pH |
pH Units |
NA |
NA |
Range |
7.4 - 8.2 |
8.1 |
7.7 - 8.5 |
8.27 - 8.80 |
NR |
NA |
|
Average |
7.8 |
8.0 |
8.51 |
||||||||
|
|
|
|
|
|
|
|||||
Potassium |
ppm |
NA |
NA |
Range |
3.1 - 3.5 |
4.0 - 4.8 |
NR |
0.00 - 54.46 |
NR |
Salt present in the water; |
|
Average |
3.3 |
4.4 |
14.72 |
||||||||
|
|
|
|
|
|
|
|||||
Sodium |
ppm |
NA |
NA |
Range |
61 - 65 |
76 - 98 |
NA |
45.4 - 66 |
NR |
The salt present in the water, generally naturally occurring |
|
Average |
63 |
87 |
76 |
55.1 |
|||||||
|
|
|
|
|
|
ABBREVIATIONS, DEFINITIONS AND FOOTNOTES
Abbreviations and Definitions- (Please refer to main table for other abbreviations and definitions)
|
NR |
- Not Reported |
||
|
NL |
- Notification Level - The level at which notification of the public water system's |
||
|
|
|
governing body is required. |
|
|
ppt |
- parts per trillion or nanograms per liter (ng/L). |
||
NRA |
- No Running Average - Single Sample Collected |
|||
Footnotes: |
|
|
|
|
|
(a) |
- Reporting level is 0.03 ppb for Chromium VI. |
||
|
(b) |
- |
AI <10.0 = Highly aggressive and very corrosive water |
|
|
|
|
AI ≥ 12.0 = |
|
|
|
|
AI (10.0 - 11.9 ) = Moderately aggressive water |
|
|
(c) |
- Positive SI index = |
||
|
|
|
Negative SI index = corrosive; tendency to dissolve calcium carbonate |
|
|
|
|
|
|
Summary of Vallecitos Water District's 2020 Water Quality Analysis - Continued
|
|
|
|
|
State or |
|
|
|
|
|
|
|
|
|
Federal |
PHG |
|
Within |
|
|
|
|
|
|
MCL |
(MCLG) |
Range |
VWD's |
Major Sources in |
|
Parameter |
|
Units |
[MRDL] |
[MRDLG] |
Average |
System |
Drinking Water |
|
|
Summary of Water Quality Tests Within VWD's Distribution System - Data Provided by Vallecitos Water District |
||||||||
|
|||||||||
|
Total Coliform Bacteria (a) |
|
% |
5.0 (a) |
(0) |
Range |
ND - Present |
Naturally present in the environment |
|
|
|
Average |
0.14 |
||||||
|
|
|
|
|
|
|
|
||
|
Fecal Coliform & E. coli (b) |
|
(b) |
(b) |
(0) |
Range |
ND |
Human and animal fecal waste |
|
|
|
Average |
|||||||
|
|
|
|
|
|
|
|
|
|
|
Total Trihalomethanes (TTHM) (c) |
|
ppb |
80 |
NA |
Range |
8.4 - 56 |
||
|
|
Highest LRAA |
38.0 |
||||||
|
|
|
|
|
|
|
|
||
|
Haloacetic Acids (five) (HAA5) (d) |
|
ppb |
60 |
NA |
Range |
0.0 - 12 |
||
|
|
Highest LRAA |
9.0 |
||||||
|
|
|
|
|
|
|
|
||
|
Total Chlorine Residual (e) |
|
ppm |
[4.0] |
[4.0] |
Range |
0.1 - 3.6 |
Drinking water disinfectant added for treatment |
|
|
|
Highest RAA |
2.26 |
||||||
|
|
|
|
|
|
|
|
||
|
General Physical Sampling (f) |
|
(f) |
(f) |
(f) |
Secondary Standards (aesthetics) testing required by SWRCB within VWD's Distribution System |
|||
|
|
|
|
|
|
|
|
|
|
|
MONITORED AT CUSTO |
MERS' |
TAP |
|
|
|
|
|
|
|
Copper (g) |
|
ppm |
AL = 1.3 |
0.3 |
90th |
0.270 |
House pipes internal corrosion; erosion of natural deposits; leaching from wood |
|
|
|
Percentile |
preservatives |
||||||
|
|
|
|
|
|
|
|
||
|
Lead (g) |
|
ppb |
AL = 15 |
0.2 |
90th |
1.2 |
House pipes internal corrosion; erosion of natural deposits; discharges from |
|
|
|
Percentile |
industrial manufacturers |
||||||
|
|
|
|
|
|
|
|
||
|
UNREGULATED CONTAMINANT |
MONITORING RULE 4 (UCMR4) |
|
|
|||||
|
Manganese (h) |
|
ppb |
NA |
NA |
Range |
ND - 65 |
Leaching from natural deposits |
|
|
|
Average |
12.62 |
||||||
|
|
|
|
|
|
|
|
||
|
HAA9 (h) |
|
ppb |
NA |
NA |
Range |
ND - 8.3 |
||
|
|
Average |
1.77 |
||||||
|
|
|
|
|
|
|
|
||
|
ABBREVIATIONS AND DEFINITION |
S |
|
|
|
|
|
||
|
|
AL |
- |
Action Level |
|
|
|
MRDLG - Maximum Residual Disinfectant Level Goal - The level of a |
|
|
HAA5 |
- |
Haloacetic Acids (five) |
|
|
|
drinking water disinfectant below which there is no known |
||
|
MCL |
- Maximum Contaminant Level - The highest level of a |
|
or expected risk to health. MRDLGs do not reflect the benefits |
|||||
|
|
|
|
contaminant that is allowed in drinking water. Primary |
|
of the use of disinfectants to control microbial contaminants. |
|||
|
|
|
|
MCLs are set as close to the PHGs (or MCLGs) as |
NL - |
Notification Level |
|||
|
|
|
|
is economically and technologically feasible. Secondary |
PHG - Public Health Goal - The level of a contaminant |
||||
|
|
|
|
MCLs are set to protect the odor, taste and appearance |
|
in drinking water below which there is no |
|||
|
|
|
|
of drinking water. |
|
|
|
known or expected risk to health. PHGs are set |
|
|
MCLG |
- Maximum Contaminant Level Goal - The level of a |
|
by the California Environmental Protection Agency. |
|||||
|
|
|
|
contaminant in drinking water below which there is no |
ppb - parts per billion or micrograms per liter (µg/L) |
||||
|
|
|
|
known or expected risk to health. MCLGs are set by the |
ppm - parts per million or milligrams per liter (mg/L) |
||||
|
|
|
|
U.S. Environmental Protection Agency. |
|
TTHM - |
Total Trihalomethanes |
||
|
MRDL |
- Maximum Residual Disinfectant Level - The highest level |
RAA - Running Annual Average |
||||||
|
|
|
|
of a disinfectant allowed in drinking water. There is |
LRAA - |
Locational Running Annual Average; highest LRAA is the |
|||
|
|
|
|
convincing evidence that addition of a disinfectant is |
|
highest of all Locational Running Annual Averages. Calculated |
|||
|
|
|
|
necessary for control of microbial contaminants. |
|
as average of all samples collected within a |
|||
|
FOOTNOTES |
|
|
|
|
|
|
|
|
|
|
|
|
|
|
|
|
|
|
-
- The District tested more samples than required by the SWRCB. 1,358 samples were analyzed in 2020 and two samples tested positive for Total Coliform bacteria. The positive samples were determined to be from sample handling errors.
The District was in compliance with the Total Coliform MCL for 2020. - - The District tested more samples than required by the SWRCB. 1,358 samples were analyzed in 2020 and all samples tested negative for Fecal/E. coli bacteria. The District was in compliance with the Fecal/E. coli MCL for 2020.
- - The MCL for Total Trihalomethanes (TTHM) is determined by using a Locational Running Annual Average (LRAA) of the last four quarterly tests. The District was in compliance with the regulations concerning Total Trihalomethanes (TTHM) for 2020.
- - The MCL for Haloacetic Acids (HAA5) is determined by using a Locational Running Annual Average (LRAA) of the last four quarterly tests. The District was in compliance with the regulations concerning Haloacetic Acids (HAA5) for 2020.
-
- Total chlorine is the sum of free and combined chlorine. Free chlorine is defined as the concentration of residual chlorine in water present as dissolved gas (Cl2), hypochlorous acid (HOCl), and/or hypochlorite ion
(OCl-). Combined chlorine is defined as the residual chlorine existing in water in chemical combination with ammonia or organic amines which can be found in natural or polluted waters. Ammonia is sometimes deliberately added to chlorinated public water supplies to provide inorganic chloramines. This process is generally referred to as “chloramination”. The water provided to you has had inorganic chloramines added as a disinfectant.
- - These samples were tested for turbidity, odor, and color. The District was in compliance with the Secondary Standards for these tests in 2020.
- - The federal and state standards for Lead and Copper are treatment techniques requiring agencies to optimize corrosion control treatment. The District is required to take 50 samples every three years. The data shown is from 53 samples taken during the 2018 period. Our next sample period is scheduled for July, 2021. The District was in compliance with the "Lead and Copper Rule" in 2018. In 2017, the District collected 73 samples from 19 schools and one daycare camp.
- - Quartely UCMR 4 monitoring was conducted in 2018. Manganese and Haloacetic were detected. Haloacetic acids are reported as HAA9.
*If present, elevated levels of lead can cause serious health problems, especially for pregnant women and young children. Lead in drinking water is primarily from materials and components associated with service lines and home plumbing. Vallecitos is responsible for providing high quality drinking water, but cannot control the variety of materials used in plumbing components. When your water has been sitting for several hours, you can minimize the potential for lead exposure by flushing your tap for 30 seconds to 2 mintutes before using water for drinking or cooking. If you are concerned about lead in your drinking water, you may wish to have your water tested. Information on lead in drinking water, testing methods, and steps you can take to minimize exposure is available from the Safe Drinking Water Hotline or at http://www.epa.gov/safewater/lead.
Water and Wastewater Specialists since 1955
201 Vallecitos de Oro San Marcos, CA 92069
-
744-0460
www.vwd.org
- Special Edition -
2020 Water Quality
Report
Management Staff
Glenn Pruim, General Manager
Rhondi Emmanuel, Administrative Services Manager
James Gumpel, District Engineer
Ed Pedrazzi, Operations and Maintenance Manager
Wes Owen, Finance Manager
Due to the evolving situation with the
To provide public comments prior to the meeting, submit comments via
“Like us” on Facebook or follow us on Twitter @vallecitoswater
Parts per million (ppm) = |
Parts per billion (ppb) = |
|
One drop in a |
||
One drop in a residential |
||
|
swimming pool |
FOR MORE INFORMATION: This report is only a summary of the water quality activities during the past year. If you have any questions about your water quality or Vallecitos Water District, please visit our website at www.vwd.org or call (760)
The District’s headquarters is located at 201 Vallecitos de Oro, San Marcos, CA 92069. Questions specific to water quality can be directed to Shawn Askine, Water Systems Supervisor, at (760)
For additional information, contact:
-
U.S. Environmental Protection Agency (USEPA) - (800)
426-4791 - http://water.epa.gov/drink/index.cfm -
National Center for Disease Control - (404)
639-3311 - www.cdc.gov - State Water Resources Control Board - Division of Drinking Water
-
449-5577 - http://www.waterboards.ca.gov/drinking_water/certlic/drinkingwater/CCR.shtml -
Metropolitan Water District of Southern California - (213)
217-6000 - www.mwdh2o.com -
San Diego County Water Authority -
(858)-522-6740 - www.sdcwa.org
Reminder
Always take extra precautions, the water may be safe to drink when it leaves the sewage treatment plant but it may pick up pollutants during its way to your tap. We advise that you ask locals or hotel staff about the water quality. Also, note that different cities have different water mineral contents.