Table of Contents
Can You Drink Tap Water in Hesperia?
Yes, Hesperia's tap water is generally considered safe to drink as Hesperia has no active health based violations of the Safe Drinking Water Act (SDWA) that we are aware of. Other factors such as lead piping in a home, or low levels of pollutants on immunocompromised individuals, should also be considered, however. To find more recent info we might have, you can check out our boil water notice page or the city's water provider website.
According the EPA’s ECHO database, from April 30, 2019 to June 30, 2022, Hesperia's water utility, Hesperia Wd, had 0 violations of the Safe Drinking Water Act. For more details on the violations, please see our violation history section below. The last violation for Hesperia was resolved on Dec. 31, 2010. This assessment is based on the Hesperia Wd water system, other water systems in the city may have different results.
While tap water that meets the EPA health guidelines generally won’t make you sick to your stomach, it can still contain regulated and unregulated contaminants present in trace amounts that could potentially cause health issues over the long-run. These trace contaminants may also impact immunocompromised and vulnerable individuals.
The EPA is reviewing if it’s current regulations around pollutant levels in tap water are strict enough, and the health dangers posed by unregulated pollutants, like PFAS.
Water Quality Report for Hesperia Tap Water
The most recent publicly available numbers for measured contaminant levels in Hesperia tap water are in its 2020 Water Quality Report. As you can see, there are levels which the EPA considers to be acceptable, but being below the maximum allowable level doesn’t necessarily mean the water is healthy.
Lead in tap water, for example, is currently allowed at up to 15ppb by the EPA, but it has set the ideal goal for lead at zero. This highlights how meeting EPA standards doesn’t necessarily mean local tap water is healthy.
EPA regulations continue to change as it evaluates the long term impacts of chemicals and updates drinking water acceptable levels. The rules around arsenic, as well as, lead and copper are currently being re-evaluated.
There are also a number of "emerging" contaminants that are not currently. For example, PFAS (Per- and polyfluoroalkyl substances), for which the EPA has issued a health advisory. PFAS are called "forever chemicals" since they tend not to break down in the environment or the human body and can accumulate over time.
We recommend looking at the contaminants present in Hesperia's water quality reports, or getting your home's tap water tested to see if you should be filtering your water.
Hesperia Tap Water Safe Drinking Water Act Violation History - Prior 10 Years
Below is a ten year history of violations for the water system named Hesperia Wd for Hesperia in California. For more details please see the "What do these Violations Mean?" section below.
From Dec. 1, 2010 to Dec. 31, 2010, Hesperia had 1 non-health based Safe Drinking Water Act violation with the violation category being Monitoring and Reporting, more specifically, the violation code was Monitoring, Routine Minor (TCR) which falls into the Microbials rule code group, and the Total Coliform Rules rule code family for the following contaminant code: Coliform (TCR).
Is there Lead in Hesperia Water?
Based on the EPA’s ECHO Database, 90% of the samples taken from the Hesperia water system, Hesperia Wd, between sample start date and sample end date, were at or below, 0.0 mg/L of lead in Hesperia water. This is 0% of the 0.015 mg/L action level. This means 10% of the samples taken from Hesperia contained more lead.
While Hesperia water testing may have found 0.0 mg/L of lead in its water, that does not mean your water source has the same amount. The amount of lead in water in a city can vary greatly from neighborhood to neighborhood, or even building to building. Many buildings, particularly older ones, have lead pipes or service lines which can be a source of contamination. To find out if your home has lead, we recommend getting you water tested.
No amount of lead in water is healthy, only less dangerous. As lead accumulates in our bodies over time, even exposure to relatively small amounts can have negative health effects. For more information, please check out our Lead FAQ page.
Are there PFAS in Hesperia Tap Water?
Currently, testing tap water for PFAS isn’t mandated on a national level. We do have a list of military bases where there have been suspected or confirmed leaks. There appears to be at least one military base - George Air Force Base - near Hesperia with suspected leaks.
With many potential sources of PFAS in tap water across the US, the best information we currently have about which cities have PFAS in their water is this ewg map, which you can check to see if Hesperia has been evaluated for yet.
Our stance is better safe than sorry, and that it makes sense to try to purify the tap water just in case.
Hesperia SDWA Violation History Table - Prior 10 Years
| Compliance Period | Status | Health-Based? | Category Code | Code | Rule Code | Contaminant Code | Rule Group Code | Rule Family Code |
|---|---|---|---|---|---|---|---|---|
| 12/01/2010 - 12/31/2010 | Resolved | No | Monitoring and Reporting (MR) | Monitoring, Routine Minor (TCR) (24) | Total Coliform Rule (110) | Coliform (TCR) (3100) | Microbials (100) | Total Coliform Rules (110) |
What do these Violations Mean?
Safe Drinking Water Act Violations categories split into two groups, health based, and non-health based. Generally, health based violations are more serious, though non-health based violations can also be cause for concern.
Health Based Violations
- Maximum contaminant levels (MCLs) - maximum allowed contaminant level was exceeded.
- Maximum residual disinfectant levels (MRDLs) - maximum allowed disinfectant level was exceeded.
- Other violations (Other) - the exact required process to reduce the amounts of contaminants in drinking water was not followed.
Non-Health Based Violations
- Monitoring and reporting violations (MR, MON) - failure to conduct the required regular monitoring of drinking water quality, and/or to submit monitoring results on time.
- Public notice violations (Other) - failure to immediately alert consumers if there is a serious problem with their drinking water that may pose a risk to public health.
- Other violations (Other) - miscellaneous violations, such as failure to issue annual consumer confidence reports or maintain required records.
SDWA Table Key
| Field | Description |
|---|---|
| Compliance Period | Dates of the compliance period. |
| Status |
Current status of the violation.
|
| Health-Based? | Whether the violation is health based. |
| Category Code |
The category of violation that is reported.
|
| Code | A full description of violation codes can be accessed in the SDWA_REF_CODE_VALUES (CSV) table. |
| Contaminant Code | A code value that represents a contaminant for which a public water system has incurred a violation of a primary drinking water regulation. |
| Rule Code |
Code for a National Drinking Water rule.
|
| Rule Group Code |
Code that uniquely identifies a rule group.
|
| Rule Family Code |
Code for rule family.
|
For more clarification please visit the EPA's data dictionary.
Hesperia Water - Frequently Asked Questions
| By Phone: | 760-947-7742 |
| By Email: | jmcdonald@cityofhesperia.us |
| By Mail: | 9700 SEVENTH AVE HESPERIA, CA, 92345 |
Existing customers can login to their Hesperia Wd account to pay their Hesperia water bill by clicking here.
If you want to pay your Hesperia Wd bill online and haven't made an account yet, you can create an account online. Please click here to create your account to pay your Hesperia water bill.
If you don't want to make an account, or can't remember your account, you can make a one-time payment towards your Hesperia water bill without creating an account using a one time payment portal with your account number and credit or debit card. Click here to make a one time payment.
Moving to a new house or apartment in Hesperia means you will often need to put the water in your name with Hesperia Wd. In order to put the water in your name, please click the link to the start service form below. Start service requests for water bills typically take two business days.
Leaving your house or apartment in Hesperia means you will likely need to take your name off of the water bill with Hesperia Wd. In order to take your name off the water bill, please click the link to the stop service form below. Stop service for water bills requests typically take two business days.
USER SUBMITTED RATINGS
- Drinking Water Pollution and Inaccessibility
- Water Pollution
- Drinking Water Quality and Accessibility
- Water Quality
The above data is comprised of subjective, user submitted opinions about the water quality and pollution in Hesperia, measured on a scale from 0% (lowest) to 100% (highest).
Related FAQS
Hesperia Water Quality Report (Consumer Confidence Report)
The EPA mandates that towns and cities consistently monitor and test their tap water. They must report their findings in an annual Consumer Confidence Report. Below is the most recent water quality report from Hesperia's Water. If you would like to see the original version of the report, please click here.
Cameron Gregg |
Brigit Bennington |
Bill Holland |
Larry Bird |
Rebekah Swanson |
Nils Bentsen |
Chair |
Vice Chair |
Board Member |
Board Member |
Board Member |
General Manager |
|
|
|
|
|
|
Dear Customers,
The Hesperia Water District is pleased to present to you the 2020 Consumer Confidence Report. This report contains detailed information regarding the quality of your drinking water, where it comes from, and other information in compliance with federal and state law. This report is intended to assure citizens that their drinking water is of the highest quality, meeting all Federal and State water quality standards since the implementation of the U.S. Environmental Protection Agency (USEPA) Safe Drinking Water Act was passed in 1974. The District serves a population of nearly 97,846 citizens including residential and business customers. In 2020, the District provided 13,252
Thank you,
Hesperia Water District
Board of Directors
Important Facts about Drinking Water |
• Inorganic contaminants, such as salts and |
Regulation of Drinking Water and |
|
|||||||||||||
The sources of drinking water (both tap water and |
metals, that can be naturally occurring or |
|
Bottled Water Quality |
|
|
|
||||||||||
|
|
|
|
|
|
|
|
|||||||||
bottled water) include rivers, lakes, streams, ponds, |
result from urban storm water runoff, industrial |
In order to ensure that tap water is safe to drink, the |
||||||||||||||
reservoirs, springs, and wells. As water travels over |
or domestic wastewater discharges, oil and |
U.S. Environmental Protection Agency (U.S. EPA) |
||||||||||||||
the surface of the land, or through the ground, it |
gas production, mining, or farming. |
|
and the State Water Resources Control Board (State |
|||||||||||||
dissolves |
• Pesticides and herbicides, that may come from |
Water Board) prescribe regulations that limit the |
||||||||||||||
cases, radioactive material, and can pick up |
a variety of sources such as agriculture, urban |
amount of certain contaminants in water provided by |
||||||||||||||
substances resulting from the presence of animals |
stormwater runoff, and residential uses. |
public water systems. State Water Board regulations |
||||||||||||||
or from human activity. Currently, all water supplied |
• Organic chemical contaminants, including syn- |
also establish limits for contaminants in bottled water |
||||||||||||||
to the citizens |
of Hesperia |
comes |
from |
the |
that provide the same protection for public health. |
|||||||||||
groundwater aquifer. |
|
|
|
thetic and volatile organic chemicals, that are by |
Drinking |
water, |
including |
bottled |
water, |
may |
||||||
|
|
|
petrole- |
|||||||||||||
|
|
|
|
|
reasonably be expected to contain at |
least small |
||||||||||
Contaminants that may be present in source water |
um production, |
and can also come |
from gas |
|||||||||||||
amounts |
of some contaminants. The presence of |
|||||||||||||||
include: |
|
|
|
|
stations, urban |
storm water runoff, agricultural |
||||||||||
|
|
|
|
contaminants |
does not necessarily |
indicate |
that |
|||||||||
• Microbial contaminants, such |
as viruses |
and |
application, and septic systems. |
|
||||||||||||
|
water poses a health risk. More information about |
|||||||||||||||
bacteria, that may come from sewage treatment |
• Radioactive contaminants, that can be naturally- |
|||||||||||||||
contaminants |
and |
potential |
health effects |
can be |
||||||||||||
plants, septic |
systems, agricultural |
livestock |
occurring or be the result of oil |
and gas |
||||||||||||
obtained |
by |
calling the U.S. EPA’s Safe |
Drinking |
|||||||||||||
operations, and wildlife. |
|
|
|
production and mining activities. |
|
|||||||||||
|
|
|
|
Water Hotline |
|
|
|
|||||||||
|
|
|
|
|
|
|
|
|
|
|
||||||
|
|
|
|
|
|
|
|
|
|
|
|
|
|
|
|
|
Stay Informed
Board Meetings are held the first and third Tuesday of each month at 6:30 pm in conjunction with City Council meetings. Meetings are open to the public and may be viewed live via the City’s website: www.cityofhesperia.us — City Hall is located at 9700 Seventh Ave, Hesperia, CA 92345
Noticia Importante
Este informe contiene información muy importante sobre su agua para beber. Favor de comunicarse Hesperia Water District a 9700 Seventh Ave. Hesperia, CA 92345 or (760)
Information About Drinking Water
|
Additional Information About |
|
|
|
|
|
Lead |
|
|
|
|
|
|
|
|
Source Water Assessment |
|
|||||||||
|
Drinking Water |
|
|
|
|
|
|
|
|
|
If present, elevated levels of lead can cause serious health |
A Source Water Assessment has been conducted on all 15 |
|
|||||||||||||
|
Drinking water, including bottled water, may reasonably be |
problems, |
especially |
for |
pregnant women |
and |
young |
wells for the Hesperia Water District. The water sources are |
|
|||||||||||||||||
|
children. Lead in drinking water is primarily from materials |
most vulnerable to the activities of septic systems with high |
|
|||||||||||||||||||||||
|
expected to |
contain at |
least |
|
small amounts |
of |
some |
|
||||||||||||||||||
|
|
and |
components associated with service lines and home |
density. |
|
|||||||||||||||||||||
|
contaminants. |
The |
presence |
of |
contaminants |
does |
not |
|
||||||||||||||||||
|
plumbing. |
Hesperia |
Water |
District is |
responsible for |
|
|
|||||||||||||||||||
|
necessarily indicate |
that |
water |
poses a |
health |
risk. More |
For a copy of Source Water Assessment summaries, visit: |
|
||||||||||||||||||
|
providing high quality drinking water, but cannot control the |
|
||||||||||||||||||||||||
|
information about contaminants and potential health effects |
https://www.waterboards.ca.gov/drinking_water/certlic/ |
|
|||||||||||||||||||||||
|
variety of materials used |
in |
plumbing components. When |
|
||||||||||||||||||||||
|
can be |
obtained |
by calling the |
USEPA’s |
Safe Drinking |
drinkingwater/DWSAP.html |
|
|||||||||||||||||||
|
your |
water |
has been sitting |
for |
several hours, you can |
|
||||||||||||||||||||
|
Water |
Hotline at |
|
|
||||||||||||||||||||||
|
minimize the potential for lead exposure by flushing tap for |
|
|
|||||||||||||||||||||||
|
more vulnerable to contaminants in drinking water than the |
|
|
|||||||||||||||||||||||
|
30 seconds to 2 minutes before using water for drinking or |
|
|
|||||||||||||||||||||||
|
general population. Immunocompromised persons such as |
|
|
|||||||||||||||||||||||
|
cooking. (Optional: if you do so, you may wish to collect the |
|
|
|||||||||||||||||||||||
|
persons with cancer undergoing chemotherapy, persons who |
|
|
|||||||||||||||||||||||
|
flushed water and reuse |
it for another beneficial purpose, |
|
|
||||||||||||||||||||||
|
have undergone organ transplants, people with HIV/AIDS or |
|
|
|||||||||||||||||||||||
|
such as watering plants.) If you are concerned about lead in |
|
|
|||||||||||||||||||||||
|
other immune system disorders, some elderly, and infants |
|
|
|||||||||||||||||||||||
|
your |
water, you may wish |
to |
have your water tested. |
|
|
||||||||||||||||||||
|
can be particularly |
at risk from |
infections. These |
people |
|
|
||||||||||||||||||||
|
Information on lead in drinking water, testing methods, and |
|
|
|||||||||||||||||||||||
|
should seek advice from their health care providers. USEPA/ |
|
|
|||||||||||||||||||||||
|
steps you can take to minimize exposure is available from |
|
|
|||||||||||||||||||||||
|
Centers for Disease Control (CDC) guidelines on appropriate |
|
|
|||||||||||||||||||||||
|
the Safe Drinking Water |
Hotline or at http://www.epa.gov/ |
|
|
||||||||||||||||||||||
|
means to lessen the risk of infection by Cryptosporidium and |
|
|
|||||||||||||||||||||||
|
lead. |
|
|
|
|
|
|
|
|
|
|
|
||||||||||||||
|
other microbial contaminants are available |
from |
the |
|
|
|
|
|
|
|
|
|
|
|
||||||||||||
|
|
|
|
|
|
|
|
|
|
|
|
|
||||||||||||||
|
Safe Drinking Water Hotline at |
|
|
|
|
|
|
|
|
|
|
|
|
|
|
|
||||||||||
|
|
|
|
|
|
|
|
|
|
|
|
|
|
|
|
|
|
|
|
|
|
|
|
|
|
|
|
Key Terms |
|
|
|
|
|
|
|
|
|
|
|
|
|
|
|
|
|
|
|
|
|
|
|
||
|
|
|
|
|
|
|||||||||||||||||||||
|
Maximum Contaminant Level (MCL): The |
highest |
Nephelometric Turbidity Units (NTU): A unit for |
pH: Range from 1 (acid) to 14 (basic). Neutral pH is |
|
|||||||||||||||||||||
|
level of a contaminant that is allowed in drinking |
expressing the cloudiness (turbidity) of a sample as |
7.0. Drinking water ranges between 6.0 to 8.3. |
|
||||||||||||||||||||||
|
water. Primary MCLs are set as close to the PHGs (or |
measured by a nephelometric turbidimeter. |
|
|
ND: not detectable at testing limit |
|
||||||||||||||||||||
|
MCLGs) as |
is |
economically |
and |
technologically |
|
|
|
|
|
|
|
|
|
|
|
||||||||||
|
Primary Drinking Water Standards (PDWS): MCLs |
|
|
|||||||||||||||||||||||
|
feasible. Secondary MCLs are set to |
protect the odor, |
ppm: parts per million or milligrams per liter (mg/L) |
|
||||||||||||||||||||||
|
and MRDLs for contaminants that affect health along |
|
||||||||||||||||||||||||
|
taste, and |
appearance of drinking water. |
|
|
|
|
||||||||||||||||||||
|
|
|
|
|
|
|||||||||||||||||||||
|
|
|
|
with their monitoring and |
|
reporting requirements, |
ppb: parts per billion or micrograms per liter (µg/L) |
|
||||||||||||||||||
|
|
|
|
|
|
|
|
|
|
|
|
|
|
|
|
|
||||||||||
|
Maximum Contaminant Level Goal (MCLG): The |
and water treatment requirements. |
|
|
|
|
||||||||||||||||||||
|
|
|
|
ppt: parts per trillion or nanograms per liter (ng/L) |
|
|||||||||||||||||||||
|
level of a contaminant in drinking water |
below which |
Public Health Goal (PHG): The level of a contami- |
|
||||||||||||||||||||||
|
there is no known or expected risk to health. MCLGs |
pCi/L: picocuries per liter (a measure of radiation) |
|
|||||||||||||||||||||||
|
nant in drinking water below which there is no known |
|
||||||||||||||||||||||||
|
are set by the U.S. Environmental Protection Agency |
|
||||||||||||||||||||||||
|
or |
expected risk to health. |
PHGs |
are set by |
the |
|
|
|||||||||||||||||||
|
(U.S. EPA). |
|
|
|
|
|
|
|
|
|
|
|
|
umho/cm: Micromhos per centimeter. A measure of |
|
|||||||||||
|
|
|
|
|
|
|
|
|
|
|
|
|
California Environmental Protection Agency. |
|
|
|
||||||||||
|
|
|
|
|
|
|
|
|
|
|
|
|
|
|
|
|
the conductivity of a water sample, equivalent to |
|
||||||||
|
Maximum |
Residual |
Disinfectant |
Level |
(MRDL): |
|
|
|
|
|
|
|
|
|
|
|
||||||||||
|
Regulatory Action Level (AL): The concentration of |
microsiemens per centimeter. |
|
|||||||||||||||||||||||
|
The highest level of a disinfectant allowed in drinking |
|
||||||||||||||||||||||||
|
a contaminant which, if exceeded, triggers treatment |
|
|
|||||||||||||||||||||||
|
water. There is convincing evidence that addition of a |
|
|
|||||||||||||||||||||||
|
or |
other |
requirements that |
a water system must |
|
|
||||||||||||||||||||
|
disinfectant |
is |
necessary for |
|
control |
of microbial |
|
|
||||||||||||||||||
|
|
follow. |
|
|
|
|
|
|
|
|
|
|
||||||||||||||
|
contaminants. |
|
|
|
|
|
|
|
|
|
|
|
|
|
|
|
|
|
|
|
|
|
||||
|
|
|
|
|
|
|
|
|
|
|
|
|
|
|
|
|
|
|
|
|
|
|
|
|||
|
Maximum |
Residual |
Disinfectant |
Level |
Goal |
Secondary Drinking |
Water Standards |
(SDWS): |
|
|
||||||||||||||||
|
MCLs for contaminants |
that |
affect |
taste, |
odor, or |
|
|
|||||||||||||||||||
|
(MRDLG): The level of a drinking water disinfectant |
|
|
|||||||||||||||||||||||
below which there is no known or expected risk to |
appearance of the drinking water. Contaminants with |
|
SDWSs do not affect the health at the MCL levels. |
||
health. MRDLGs do not reflect the benefits of the use |
||
|
||
of disinfectants to control microbial contaminants. |
|
Water Conservation Tips and Information
Did you know that the average U.S. household uses approximately 400 gallons of water per day or 100 gallons per person per day?
There are many
- Take short showers – a 5 minutes shower uses 4 to 5 gallons of water compared to up to 50 gallons for a bath.
- Shut off water while brushing your teeth, washing your hair, and shaving and save up to 500 gallons a month.
-
Use a
water-efficient showerhead. They are inexpensive, easy to install, and can save you up to 750 gallons a month. - Run your clothes washer and dishwasher only when they are full. You can save up to 1,000 gallons a month.
- Water plants only when necessary.
-
Fix leaking toilets and faucets. Faucet washers are inexpensive and take only a few minutes to replace. To check
your toilet for a leak, place a few drops of food coloring in the tank and wait. If it seeps into the toilet bowl without flushing, you have a leak. Fixing it or replacing it with a new, more efficient model can save up to 1,000 gallons a month. - Adjust sprinklers so only your lawn is watered. Apply water only as fast as the soil can absorb it and during the cooler parts of the day to reduce evaporation.
- Teach your kids about water conservation to ensure a future generation that uses water wisely. Make it a family effort to reduce next month’s water bill!
Visit https://www.epa.gov/watersense for more information.
For questions or concerns regarding water quality, please contact:
City of Hesperia Water Quality Specialist
District Water Sources
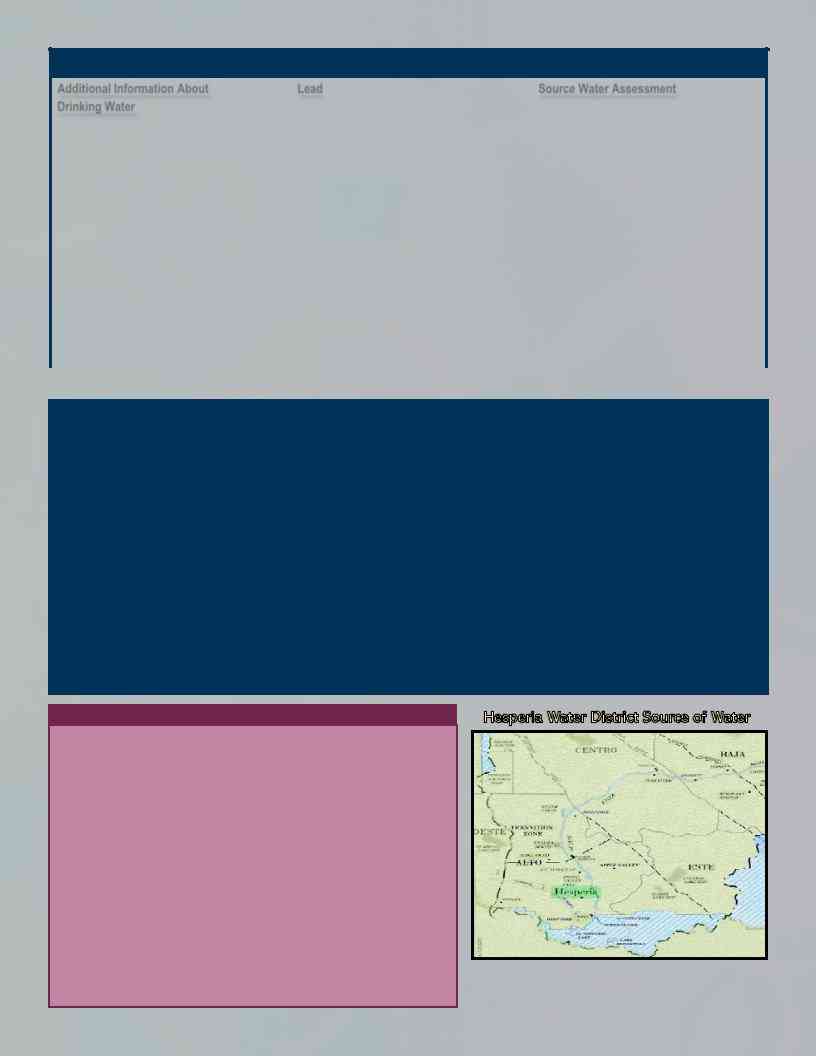
The District’s water is extracted through 15 wells where the water is regularly tested and treated in compliance with all applicable state and federal regulations. The water is pumped directly from the Alto Subarea sub basin of the Mojave River Groundwater Basin (Basin). The Basin is recharged by rainfall and snowmelt from the local mountains as well as imported water from the State Water Project. Because the water quality of the groundwater meets the state and federal standards, the wells pump directly into the Dis- trict’s distribution system or into storage reservoirs after disinfection. The peak day of production for the District was on September 2, 2020 during which the District produced over 19.5 million gallons of water within a
The State allows us to monitor for some contaminants less than once per year because the concentrations of these contaminants do not change frequently. Some of our data, though representative, are more than one year old.
Sampling Results Showing the Detection of Coliform Bacteria
Microbiological |
Highest # of |
# of |
|
|
|
|
|
|
|
|
|
|
|
Months in |
MCL |
|
MCLG |
|
Typical Source of Bacteria |
|
|||||||
|
|
|
|
||||||||||
Contaminants |
Detections |
|
|
|
|||||||||
Violation |
|
|
|
|
|
|
|
|
|
|
|||
|
|
|
|
|
|
|
|
|
|
|
|||
|
|
|
|
|
|
|
|
|
|
|
|
||
|
|
|
|
|
|
|
|||||||
|
|
|
|
|
|
Coliforms are bacteria that are naturally |
|||||||
Total Coliform Bacteria |
0 |
0 |
1 positive monthly |
0 |
present in the environment and are used as |
||||||||
an indicator that other, |
|||||||||||||
(STATE Total Coliform Rule) |
sample |
|
|||||||||||
|
|
|
|
||||||||||
(in a month) |
|
|
|
bacteria |
may |
be present. Coliforms |
were |
||||||
Sampled in 2020 |
|
(a) |
|
|
|||||||||
|
|
|
found in more samples than allowed and |
||||||||||
|
|
|
|
||||||||||
|
|
|
|
|
|
||||||||
|
|
|
|
|
|
this was a warning of potential problems. |
|||||||
|
|
|
|
|
|
|
|||||||
|
|
|
|
|
|
Fecal coliforms and E. coli are bacteria |
|||||||
|
|
|
A routine sample |
|
whose presence indicates the water may be |
||||||||
|
|
|
|
contaminated with human or animal waste. |
|||||||||
|
|
|
and a repeat |
sam- |
|
||||||||
|
|
|
|
Microbes |
in |
these |
wastes |
can |
cause |
||||
Fecal Coliform or E. coli |
0 |
0 |
ple are total coliform |
0 |
|||||||||
(STATE Total Coliform Rule) |
positive, and one of |
||||||||||||
|
|
|
|||||||||||
(in a year) |
|
|
nausea, |
headaches, |
or other |
symptoms. |
|||||||
Sampled in 2020 |
|
these is also fecal |
|
||||||||||
|
|
They may pose a special health risk for |
|||||||||||
|
|
|
|||||||||||
|
|
|
coliform or E. coli |
|
|||||||||
|
|
|
|
infants, young children, some of the elderly, |
|||||||||
|
|
|
positive |
|
|
||||||||
|
|
|
|
|
and |
people |
with |
severely compromised |
|||||
|
|
|
|
|
|
||||||||
|
|
|
|
|
|
immune systems. |
|
|
|
||||
|
|
|
|
|
|
|
|
|
|||||
E. coli |
|
|
(b) |
|
|
Human and animal fecal waste |
|
|
|||||
0 |
0 |
|
0 |
|
|
|
|
|
|
|
|||
(Federal Revised Total Coliform Rule) |
|
|
|
|
|
|
|
|
|
||||
(in a year) |
|
|
|
|
|
|
|
|
|
|
|
||
Sampled in 2020 |
|
|
|
|
|
|
|
|
|
|
|
||
|
|
|
|
|
|
|
|
|
|
|
|
||
|
|
|
|
|
|
|
|
|
|
|
|
|
|
- Two or more positive monthly samples is a violation of the MCL
-
Routine and repeat samples are total
coliform-positive and either is E.coli-positive or system fails to take repeat samples following E.coli-positive routine sample or system fails to analyze totalcoliform-positive repeat sample for E. coli.
Sampling Results Showing the Detection of Lead and Copper
Lead and |
Sample |
# of Samples |
90th Percentile |
|
|
# of Schools |
|
|
|
|
AL |
PHG |
Requesting Lead |
Typical Source of Contaminant |
|||||||
Copper |
Date |
Collected |
Level Detected |
|||||||
|
|
Sampling |
|
|
|
|||||
|
|
|
|
|
|
|
|
|
||
|
|
|
|
|
|
|
|
|
|
|
Lead |
|
|
|
|
|
|
Internal |
corrosion |
of household water |
|
2019 |
31 |
ND |
15 |
0.2 |
1 |
plumbing systems; discharges from industrial |
||||
(ppb) |
||||||||||
|
|
|
|
|
|
manufacturers; erosion of natural deposits |
||||
|
|
|
|
|
|
|
||||
|
|
|
|
|
|
|
|
|
|
|
Copper |
|
|
|
|
|
|
Internal |
corrosion |
of household plumbing |
|
2019 |
31 |
.13 |
1.3 |
0.3 |
Not applicable |
systems; erosion of natural deposits; leaching |
||||
(ppm) |
||||||||||
|
|
|
|
|
|
from wood preservatives |
||||
|
|
|
|
|
|
|
||||
|
|
|
|
|
|
|
|
|
|
|
Detection of Inorganic Contaminants
Contaminants |
Sample Date |
Average |
|
|
|
Range |
MCL |
|
PHG (MCLG) |
|
Violation |
|
|
Major Sources in Drinking Water |
|
||||||||||||||||||||||
|
|
|
|
|
|
|
|
|
|
|
|
|
|
|
|
|
|
|
|
|
|
|
|
|
|
|
|
|
|
|
|||||||
Arsenic |
|
|
|
|
|
|
|
|
|
|
|
|
|
|
|
|
|
|
|
|
|
|
|
|
Erosion |
of |
natural deposits; |
runoff |
from |
||||||||
|
|
2019 |
.38 |
|
|
|
|
ND — 3.3 |
10 |
|
.004 |
|
|
NO |
|
|
orchards; |
glass |
and |
electronics |
production |
||||||||||||||||
(ppb) |
|
|
|
|
|
|
|
|
|
|
|
||||||||||||||||||||||||||
|
|
|
|
|
|
|
|
|
|
|
|
|
|
|
|
|
|
|
|
|
|
|
|
wastes |
|
|
|
|
|
|
|
|
|
|
|
||
|
|
|
|
|
|
|
|
|
|
|
|
|
|
|
|
|
|
|
|
|
|
|
|
|
|
|
|
|
|
|
|
|
|
|
|
||
|
|
|
|
|
|
|
|
|
|
|
|
|
|
|
|
|
|
|
|
|
|
|
|
|
|
|
|
|
|
|
|
||||||
Chromium, Total |
|
|
2019 |
3.49 |
|
|
|
|
ND — 18 |
50 |
|
100 |
|
|
NO |
|
|
Discharge |
from |
steel |
and pulp |
mills |
and |
||||||||||||||
(ppb) |
|
|
|
|
|
|
|
|
|
|
|
chrome plating; erosion of natural deposits |
|||||||||||||||||||||||||
|
|
|
|
|
|
|
|
|
|
|
|
|
|
|
|
|
|
|
|
|
|
|
|
||||||||||||||
|
|
|
|
|
|
|
|
|
|
|
|
|
|
|
|
|
|
|
|
|
|
|
|
|
|
|
|||||||||||
Fluoride |
|
|
|
|
|
|
|
|
|
|
|
|
|
|
|
|
|
|
|
|
|
|
|
|
Erosion of natural deposits; water additive that |
||||||||||||
|
|
2019 |
.18 |
|
|
|
|
ND |
2 |
|
|
1 |
|
|
NO |
|
|
promotes |
strong |
teeth; |
discharge |
from |
|||||||||||||||
(ppm) |
|
|
|
|
|
|
|
|
|
|
|
|
|||||||||||||||||||||||||
|
|
|
|
|
|
|
|
|
|
|
|
|
|
|
|
|
|
|
|
|
|
|
|
fertilizer and aluminum factories |
|
|
|
|
|||||||||
|
|
|
|
|
|
|
|
|
|
|
|
|
|
|
|
|
|
|
|
|
|
|
|
|
|
|
|
|
|||||||||
|
|
|
|
|
|
|
|
|
|
|
|
|
|
|
|
|
|
|
|
|
|
|
|
|
|
|
|
|
|
|
|
||||||
Nitrate |
|
|
|
|
|
|
|
|
|
|
|
|
|
|
|
|
|
|
|
|
|
|
|
|
Runoff |
and |
leaching |
from |
fertilizer |
use; |
|||||||
|
|
2020 |
1.0 |
|
|
|
|
ND — 2.8 |
10 |
|
10 |
|
|
NO |
|
|
leaching |
|
from |
septic |
tanks |
and |
sewage; |
||||||||||||||
(ppm) |
|
|
|
|
|
|
|
|
|
|
|
|
|||||||||||||||||||||||||
|
|
|
|
|
|
|
|
|
|
|
|
|
|
|
|
|
|
|
|
|
|
|
|
erosion of natural deposits |
|
|
|
|
|
||||||||
|
|
|
|
|
|
|
|
|
|
|
|
|
|
|
|
|
|
|
|
|
|
|
|
|
|
|
|
|
|
||||||||
Detection of Disinfection Byproducts & Disinfection Residuals |
|
|
|
|
|
|
|
|
|
|
|
|
|
|
|
|
|
||||||||||||||||||||
Contaminants |
|
Sample |
Average |
|
|
|
Range |
|
MCL |
|
PHG (MCLG) or |
|
Violation |
|
|
|
Major Sources in Drinking Water |
|
|||||||||||||||||||
|
|
|
|
|
|
|
|
|
|
|
|||||||||||||||||||||||||||
|
Date |
|
|
|
|
|
(MRDLG) |
|
|
|
|
|
|||||||||||||||||||||||||
|
|
|
|
|
|
|
|
|
|
|
|
|
|
|
|
|
|
|
|
|
|
|
|
|
|
|
|
|
|
|
|
|
|
||||
|
|
|
|
|
|
|
|
|
|
|
|
|
|
|
|
|
|
|
|
|
|
|
|
|
|
|
|
|
|
|
|
|
|
|
|
|
|
Total Trihalomethane |
|
2020 |
|
ND |
|
|
|
|
ND |
|
|
80 |
|
|
|
N/A |
|
NO |
|
Byproduct of drinking water disinfection |
|
||||||||||||||||
(ppb) |
|
|
|
|
|
|
|
|
|
|
|
|
|
||||||||||||||||||||||||
|
|
|
|
|
|
|
|
|
|
|
|
|
|
|
|
|
|
|
|
|
|
|
|
|
|
|
|
|
|
|
|
|
|
|
|
||
|
|
|
|
|
|
|
|
|
|
|
|
|
|
|
|
|
|
|
|
|
|
|
|
|
|
|
|
|
|
|
|
|
|
|
|
|
|
Total Haloacetic Acid |
|
2020 |
|
ND |
|
|
|
|
ND |
|
|
60 |
|
|
|
N/A |
|
NO |
|
Byproduct of drinking water disinfection |
|
||||||||||||||||
(ppb) |
|
|
|
|
|
|
|
|
|
|
|
|
|
||||||||||||||||||||||||
|
|
|
|
|
|
|
|
|
|
|
|
|
|
|
|
|
|
|
|
|
|
|
|
|
|
|
|
|
|
|
|
|
|
|
|
||
|
|
|
|
|
|
|
|
|
|
|
|
|
|
|
|
|
|
|
|
|
|
|
|
||||||||||||||
Chlorine (ppm) |
|
2020 |
.25 |
|
|
|
.2 |
|
|
4 |
|
|
|
4(as Cl2) |
|
NO |
|
Drinking water disinfectant added for treatment |
|||||||||||||||||||
|
|
|
|
|
|
|
|
|
|
|
|
|
|
|
|
|
|
|
|
|
|
|
|
|
|
|
|
||||||||||
Detection of Regulated Contaminants with a Secondary Drinking Water Standard |
|
|
|
|
|
|
|
|
|
|
|
||||||||||||||||||||||||||
Contaminants |
Sample Date |
Average |
|
Range |
|
Secondary MCL |
|
Violation |
|
|
|
Major Sources in Drinking Water |
|
||||||||||||||||||||||||
|
|
|
|
|
|
|
|||||||||||||||||||||||||||||||
|
|
|
|
|
|
|
|
|
|
|
|
|
|
|
|
|
|
|
|
|
|
|
|
|
|
|
|||||||||||
Chloride |
2019 |
|
13.89 |
|
|
3.1 — 38 |
|
|
500 ppm |
|
|
NO |
Runoff/leaching |
from |
natural |
deposits; |
seawater |
||||||||||||||||||||
|
(ppm) |
|
|
|
|
|
|
influence |
|
|
|
|
|
|
|
|
|
|
|
||||||||||||||||||
|
|
|
|
|
|
|
|
|
|
|
|
|
|
|
|
|
|
|
|
|
|
|
|
|
|
|
|
|
|
|
|
||||||
Specific Conductance |
2019 |
|
234 |
|
|
|
|
150 — 360 |
1,600 uhmo/cm |
|
|
NO |
Substances |
|
that |
form |
ions |
when |
|
in water; |
|||||||||||||||||
(uhmo/cm) |
|
|
|
|
|
|
|
seawater influence |
|
|
|
|
|
|
|
|
|||||||||||||||||||||
|
|
|
|
|
|
|
|
|
|
|
|
|
|
|
|
|
|
|
|
|
|
|
|
|
|
|
|
||||||||||
|
|
|
|
|
|
|
|
|
|
|
|
|
|
|
|
|
|
|
|
|
|
|
|
|
|
|
|||||||||||
Sulfate |
2019 |
|
10.93 |
|
|
1.7 — 26 |
|
|
500 ppm |
|
|
NO |
Runoff/leaching |
from |
natural |
deposits; |
industrial |
||||||||||||||||||||
|
(ppm) |
|
|
|
|
|
|
wastes |
|
|
|
|
|
|
|
|
|
|
|
||||||||||||||||||
|
|
|
|
|
|
|
|
|
|
|
|
|
|
|
|
|
|
|
|
|
|
|
|
|
|
|
|
|
|
|
|
||||||
|
|
|
|
|
|
|
|
|
|
|
|
|
|
|
|
|
|
|
|
|
|
|
|
|
|
|
|
|
|
|
|
|
|
|
|
||
Total Dissolved Solids |
2019 |
|
144.6 |
|
|
84 — 250 |
|
|
1,000 ppm |
|
|
NO |
Runoff/leaching from natural deposits |
|
|
|
|||||||||||||||||||||
|
(ppm) |
|
|
|
|
|
|
|
|
|
|||||||||||||||||||||||||||
|
|
|
|
|
|
|
|
|
|
|
|
|
|
|
|
|
|
|
|
|
|
|
|
|
|
|
|
|
|
|
|
|
|
|
|
||
|
|
|
|
|
|
|
|
|
|
|
|
|
|
|
|
|
|
|
|
|
|
|
|
|
|
|
|
|
|
|
|
|
|
|
|
||
Turbidity |
2020 |
|
.13 |
|
|
|
|
ND — 0.6 |
|
|
|
5 NTU |
|
|
NO |
Soil runoff |
|
|
|
|
|
|
|
|
|
|
|
||||||||||
|
(NTU) |
|
|
|
|
|
|
|
|
|
|
|
|
|
|
|
|
|
|
|
|
||||||||||||||||
|
|
|
|
|
|
|
|
|
|
|
|
|
|
|
|
|
|
|
|
|
|
|
|
|
|
|
|
|
|
|
|
|
|
|
|
||
|
|
|
|
|
|
|
|
|
|
|
|
|
|
|
|
|
|
|
|
|
|
|
|
|
|
|
|
|
|
|
|
|
|
|
|
|
|
|
Odor |
2020 |
|
1.2 |
|
|
|
|
1 — 2 |
|
|
|
|
3 tons |
|
|
NO |
|
|
|
|||||||||||||||||
|
(tons) |
|
|
|
|
|
|
|
|
|
|
|
|
|
|
||||||||||||||||||||||
|
|
|
|
|
|
|
|
|
|
|
|
|
|
|
|
|
|
|
|
|
|
|
|
|
|
|
|
|
|
|
|
|
|
|
|
||
Unregulated Parameters That May Interest Customers |
|
|
|
|
|
|
|
|
|
|
|
|
|
|
|
|
|
|
|
|
|
||||||||||||||||
Constituents |
|
|
|
|
|
|
|
Sample Date |
|
|
|
|
Average |
|
|
|
|
|
|
|
|
Range |
|
|
|
|
|||||||||||
|
|
|
|
|
|
|
|
|
|
|
|
|
|
|
|
|
|
|
|
|
|
|
|||||||||||||||
|
|
|
|
|
|
|
|
|
|
|
|
|
|
|
|
|
|
|
|
|
|
|
|
|
|
|
|
|
|||||||||
|
|
|
Alkalinity (ppm) |
|
|
|
|
|
|
2019 |
|
|
|
|
|
|
89.12 |
|
|
|
|
|
|
|
|
75 — 110 |
|
|
|
|
|||||||
|
|
|
|
|
|
|
|
|
|
|
|
|
|
|
|
|
|
|
|
|
|
|
|
|
|
|
|
|
|||||||||
|
|
|
Bicarbonate (ppm) |
|
|
|
|
|
|
2019 |
|
|
|
|
|
|
97.5 |
|
|
|
|
|
|
|
|
52 — 180 |
|
|
|
|
|||||||
|
|
|
|
|
|
|
|
|
|
|
|
|
|
|
|
|
|
|
|
|
|
|
|
|
|
|
|
|
|||||||||
|
|
|
Calcium (ppm) |
|
|
|
|
|
|
2019 |
|
|
|
|
|
|
22.48 |
|
|
|
|
|
|
|
|
2 — 42 |
|
|
|
|
|||||||
|
|
|
|
|
|
|
|
|
|
|
|
|
|
|
|
|
|
|
|
|
|
|
|
|
|
|
|||||||||||
|
Hardness, as CaCO3 (ppm) |
|
|
|
|
|
|
2019 |
|
|
|
|
|
|
69.13 |
|
|
|
|
|
|
|
|
5 — 140 |
|
|
|
|
|||||||||
|
|
|
|
|
|
|
|
|
|
|
|
|
|
|
|
|
|
|
|
|
|
|
|
|
|
|
|
|
|||||||||
|
|
|
Magnesium (ppm) |
|
|
|
|
|
|
2019 |
|
|
|
|
|
|
3.4 |
|
|
|
|
|
|
|
|
ND — 8 |
|
|
|
|
|||||||
|
|
|
|
|
|
|
|
|
|
|
|
|
|
|
|
|
|
|
|
|
|
|
|
|
|
|
|
|
|||||||||
|
|
|
pH (pH units) |
|
|
|
|
|
|
2019 |
|
|
|
|
|
|
7.58 |
|
|
|
|
|
|
|
|
7.4 — 9.6 |
|
|
|
|
|||||||
|
|
|
|
|
|
|
|
|
|
|
|
|
|
|
|
|
|
|
|
|
|
|
|
|
|
|
|
|
|||||||||
|
|
|
Potassium (ppm) |
|
|
|
|
|
|
2019 |
|
|
|
|
|
|
1.95 |
|
|
|
|
|
|
|
|
ND — 10.2 |
|
|
|
|
|||||||
|
|
|
Sodium (ppm) |
|
|
|
|
|
|
2019 |
|
|
|
|
|
|
24.5 |
|
|
|
|
|
|
|
|
ND — 42 |
|
|
|
|
|||||||
|
|
|
|
|
|
|
|
|
|
|
|
|
|
|
|
|
|
|
|
|
|
|
|
|
|
|
|
|
|
|
|
|
|
|
|
|
|
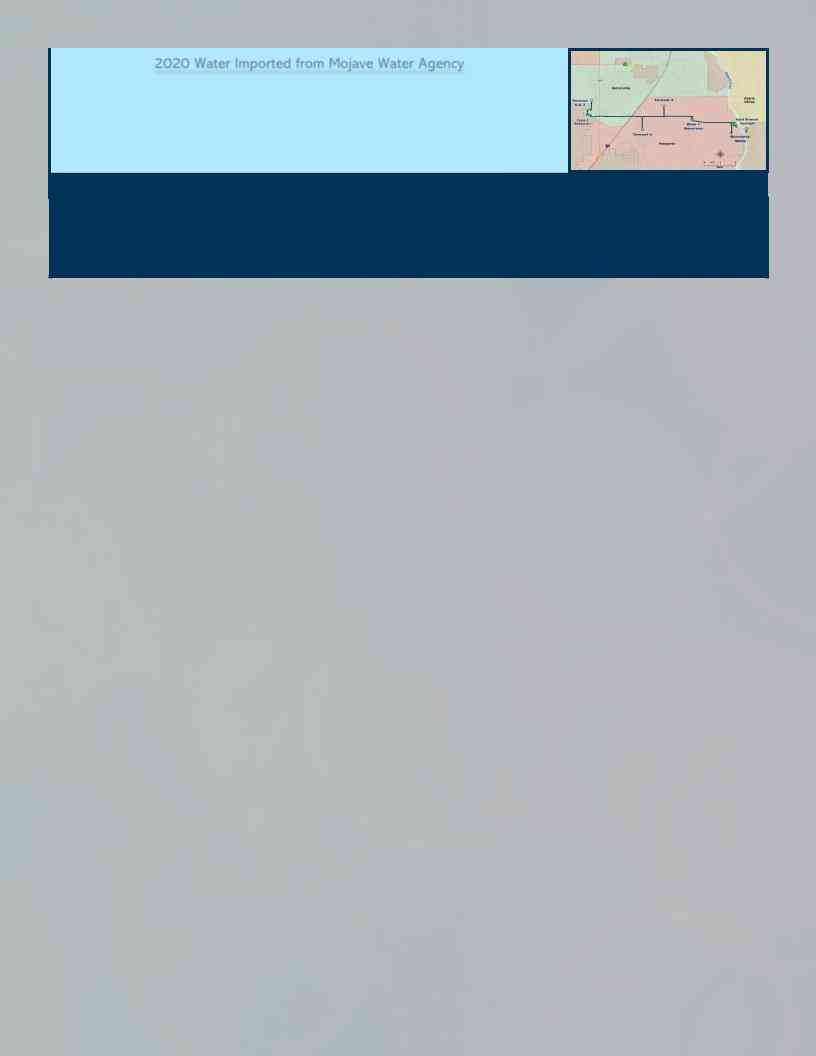
2020 Water Imported from Mojave Water Agency
The City imports a small amount of water from Mojave Water Agency (MWA). Out of the 14,392 acre feet that were produced, 3.06 acre feet were supplied by Mojave Water Agency. This equates to 997,832 gallons of the 4.68 billion gallons supplied to customers by the Hesperia Water Dis- trict. The Hesperia Water District receives water from “Turnout 4” shown on the MWA system map. The results of MWA’s 2020 Drinking Water Quality testing are reflected in their table below.
2020 MWA Drinking Water Quality Test Results
This report includes results from several tests for various constituents. Mojave Water Agency routinely monitors for constituents in the Agency’s drinking water in accordance with federal and state laws. Substances that are not detected (ND) are not listed. Values accompanied by < indicate a result less than the detection limit. The results below represent drinking water quality tests performed by Mojave Water Agency on the R3 wholesale water system and represents water produced from Wells 1, 2, 3, 4, & 5. These wells provide high quality drinking water through service connections to the cities of Victorville and Hesperia upon request. Contact your local water provider for detailed information on your water quality and where your water comes from.
Inorganic with Primary Drinking Standards |
|
|
|
|
|
|
|
|
|
|
|
|
|
|
|
|
|
|
|
|
Wells: 1, 2, 3, 4, 5 |
||||||
Contaminants |
Average |
|
|
Sample |
|
MCL |
PHG |
Sample |
Violation |
|
|
Major Sources in Drinking Water |
|||||||||||||||
|
|
|
|
|
|||||||||||||||||||||||
|
|
|
Range |
|
|
Date |
|
|
|
||||||||||||||||||
|
|
|
|
|
|
|
|
|
|
|
|
|
|
|
|
|
|
|
|
|
|
||||||
|
|
|
|
|
|
|
|
|
|
|
|
|
|
|
|
|
|
|
|
|
|
|
|
|
|
|
|
Fluoride, Naturally Occurring |
|
.28 |
|
.25 |
2 |
|
|
1 |
2019 |
|
NO |
|
Erosion of natural deposits: water additive that promotes strong teeth; |
||||||||||||||
|
(mg/L) |
|
|
|
|
|
|
discharge from fertilizer and aluminum factories |
|||||||||||||||||||
|
|
|
|
|
|
|
|
|
|
|
|
|
|
|
|
|
|
|
|
|
|
|
|||||
|
|
|
|
|
|
|
|
|
|
|
|
|
|
|
|
|
|
|
|
|
|
|
|
|
|
|
|
|
Nitrite |
|
.51 |
|
.44 |
10 |
|
10 |
2020 |
|
NO |
|
Runoff and leaching from fertilizer use; leaching from septic tanks and |
||||||||||||||
|
(mg/L) |
|
|
|
|
|
sewage; erosion of natural deposits |
||||||||||||||||||||
|
|
|
|
|
|
|
|
|
|
|
|
|
|
|
|
|
|
|
|
|
|
|
|||||
|
|
|
|
|
|
|
|
|
|
|
|
|
|
|
|
|
|
|
|
|
|
|
|
|
|
|
|
Nitrate + Nitrite (as N) |
|
.51 |
|
.44 |
10 |
|
10 |
2020 |
|
NO |
|
Runoff and leaching from fertilizer use; leaching from septic tanks and |
|||||||||||||||
|
(mg/L) |
|
|
|
|
|
sewage; erosion of natural deposits |
||||||||||||||||||||
|
|
|
|
|
|
|
|
|
|
|
|
|
|
|
|
|
|
|
|
|
|
|
|||||
Radioactive Contaminants |
|
|
|
|
|
|
|
|
|
|
|
|
|
|
|
|
|
|
|
|
|
|
|
|
Wells: 1, 2, 3, 4, 5 |
||
|
Uranium (pCi/L) |
|
.72 |
|
<1 — 1.3 |
20 |
|
.43 |
2019 |
|
NO |
|
Erosion of natural deposits |
||||||||||||||
|
|
|
|
|
|
|
|
|
|
|
|
|
|
|
|
|
|
|
|
|
|
|
|
|
|
||
Radium 226+228 (pCi/L) |
|
<1 |
|
<1 — 1.8 |
5 |
|
|
0 |
2019 |
|
NO |
|
Erosion of natural deposits |
||||||||||||||
|
|
|
|
|
|
|
|
|
|
|
|
|
|
|
|
|
|
|
|
|
|
|
|
|
|
|
|
Disinfectant Byproducts |
|
|
|
|
|
|
|
|
|
|
|
|
|
|
|
|
|
|
|
Sample results are from the distribution system from Wells: 1, 2, 3, 4, 5 |
|||||||
|
|
|
|
|
|
|
|
|
|
|
|
|
|
|
|
|
|
|
|
|
|
|
|
|
|||
Haloacetic Acids (µg/L) (HAA5) |
|
<1 |
|
<1 — 1.6 |
60 |
|
N/A |
2020 |
|
NO |
|
Byproduct of drinking water disinfection |
|||||||||||||||
|
|
|
|
|
|
|
|
|
|
|
|
|
|
|
|
|
|
|
|
|
|
|
|
|
|||
Total Trihalomethanes (µg/L) (TTHM) |
|
6 |
|
<1 — 14.6 |
80 |
|
N/A |
2020 |
|
NO |
|
Byproduct of drinking water disinfection |
|||||||||||||||
|
|
|
|
|
|
|
|
|
|
|
|
|
|
|
|
|
|
|
|
|
|
|
|
||||
Regulated Contaminants with Secondary Maximum Contaminant Levels |
|
|
|
|
|
|
|
|
|
|
Wells: 1, 2, 3, 4, 5 |
||||||||||||||||
Contaminants |
Average |
Sample Range |
|
|
Secondary MCL |
|
|
Sample Date |
Violation |
|
Major Sources in Drinking Water |
||||||||||||||||
|
|
|
|
|
|
|
|
|
|
|
|
|
|
|
|
|
|
|
|
|
|
|
|
|
|
|
|
Chloride (mg/L) |
|
22 |
|
|
18 — 25 |
|
|
|
|
500 |
|
|
|
|
|
2019 |
|
|
NO |
Runoff/leaching from natural deposits; seawater influence |
|||||||
|
|
|
|
|
|
|
|
|
|
|
|
|
|
|
|
|
|
|
|
|
|
|
|
|
|
|
|
|
Odor (units) |
|
1 |
|
|
1 |
|
|
|
|
|
3 |
|
|
|
|
|
2019 |
|
|
NO |
Naturally occurring organic materials |
|||||
|
|
|
|
|
|
|
|
|
|
|
|
|
|
|
|
|
|
|
|
|
|
|
|
|
|
||
Specific Conductance (uS/cm) |
240 |
|
220 — 250 |
|
|
|
|
1600 |
|
|
|
|
|
2019 |
|
|
NO |
Substances that form ions when in water; seawater influence |
|||||||||
|
|
|
|
|
|
|
|
|
|
|
|
|
|
|
|
|
|
|
|
|
|
|
|
|
|
|
|
|
Sulfate (mg/L) |
|
15 |
|
|
13 — 17 |
|
|
|
|
500 |
|
|
|
|
|
2019 |
|
|
NO |
Runoff/leaching from natural deposits; industrial wastes |
||||||
|
|
|
|
|
|
|
|
|
|
|
|
|
|
|
|
|
|
|
|
|
|
|
|
|
|
||
Total Dissolved Solids (mg/L) |
146 |
|
130 — 170 |
|
|
|
|
1000 |
|
|
|
|
|
2019 |
|
|
NO |
Runoff/leaching from natural deposits |
|||||||||
|
|
|
|
|
|
|
|
|
|
|
|
|
|
|
|
|
|
|
|
|
|
|
|
|
|
||
|
Turbidity (NTU) |
<.10 |
|
<.10 |
|
|
|
|
5 |
|
|
|
|
|
2019 |
|
|
NO |
Soil runoff |
||||||||
|
|
|
|
|
|
|
|
|
|
|
|
|
|
|
|
|
|
|
|
|
|
|
|
|
|
|
|
Disinfection Residuals |
|
|
|
|
|
|
|
|
|
|
|
|
|
|
|
|
|
|
|
Sample results are from the distribution system from Wells: 1, 2, 3, 4, 5 |
|||||||
Constituent |
Average |
|
|
|
Sample Range |
|
|
MCL |
|
|
PHG (MCLG) |
|
Sample Date |
Major Sources in Drinking Water |
|||||||||||||
|
|
|
|
|
|
|
|
||||||||||||||||||||
|
|
|
|
|
|
|
|
|
|
|
|
|
|
|
|
|
|
|
|
|
|
|
|
|
|||
Chlorine (mg/L) |
|
.53 |
|
|
|
.20 — 1.11 |
|
|
4 |
|
|
|
|
|
4 |
|
|
WEEKLY |
Drinking water disinfectant added for treatment |
||||||||
|
|
|
|
|
|
|
|
|
|
|
|
|
|
|
|
|
|
|
|
|
|
|
|
|
|
|
|
Unregulated Contaminants |
|
|
|
|
|
|
|
|
|
|
|
|
|
|
|
|
|
|
|
|
|
|
|
|
Wells: 1, 2, 3, 4, 5 |
||
Contaminants |
Average |
|
Sample Range |
|
|
|
MCL |
|
PHG (MCLG) |
NL |
|
Sample Date |
|
|
Major Sources in Drinking Water |
||||||||||||
|
|
|
|
|
|
|
|
|
|
|
|
|
|
|
|
|
|
|
|
|
|
|
|
|
|
|
|
Vanadium (mg/L) |
<3.0 |
|
<3.0 — 3.2 |
|
|
NONE |
|
|
NONE |
50 |
|
|
|
2019 |
|
|
Naturally occurring "rare earth" element found in the earth's crust |
||||||||||
|
|
|
|
|
|
|
|
|
|
|
|
|
|
|
|
|
|
|
|
|
|
|
|||||
Constituents That May Be of Interest to Consumers |
|
|
|
|
|
|
|
|
|
|
|
|
|
|
|
Wells: 1, 2, 3, 4, 5 |
|||||||||||
Constituents |
|
|
Average |
|
|
Range |
|
|
Sample Date |
|
|
|
|
Notes |
|||||||||||||
|
|
|
|
|
|
|
|
|
|
|
|
|
|
|
|
|
|
|
|
||||||||
|
Bicarbonate (mg/L) |
|
86 |
|
|
|
|
|
81 — |
89 |
|
|
|
|
2019 |
|
|
No PHG or MCLs available |
|
||||||||
|
|
|
|
|
|
|
|
|
|
|
|
|
|
|
|
|
|
|
|
||||||||
|
Calcium (mg/L) |
|
27 |
|
|
|
|
|
24 — |
30 |
|
|
|
|
2019 |
|
|
No PHG or MCLs available |
|
||||||||
|
|
|
|
|
|
|
|
|
|
|
|
|
|
|
|
|
|
||||||||||
|
Magnesium (mg/L) |
|
4.2 |
|
|
|
|
3.5 — |
4.9 |
|
|
|
2019 |
|
|
No PHG or MCLs available |
|
||||||||||
|
|
|
|
|
|
|
|
|
|
|
|
|
|
|
|
|
|
|
|
||||||||
|
|
|
pH |
|
7.5 |
|
|
|
|
7.4 — |
7.7 |
|
|
|
2019 |
|
|
No PHG or MCLs available |
|
||||||||
|
|
|
|
|
|
|
|
|
|
|
|
|
|
|
|
|
|
||||||||||
|
Potassium (mg/L) |
|
1.5 |
|
|
|
|
1.3 — |
1.6 |
|
|
|
2019 |
|
|
No PHG or MCLs available |
|
||||||||||
|
|
|
|
|
|
|
|
|
|
|
|
|
|
|
|
|
|
|
|
||||||||
|
Sodium (mg/L) |
|
15 |
|
|
|
|
|
14 — |
16 |
|
|
|
|
2019 |
|
|
No PHG or MCLs available |
|
||||||||
|
|
|
|
|
|
|
|
|
|
|
|
|
|
|
|
|
|
|
|||||||||
Total Alkalinity, CaCO3 (mg/L) |
|
70 |
|
|
|
|
|
67 — |
73 |
|
|
|
|
2019 |
|
|
No PHG or MCLs available |
|
|||||||||
|
|
|
|
|
|
|
|
|
|
|
|
|
|
|
|
|
|
|
|||||||||
Total Hardness, CaCO3 (mg/L) |
|
86 |
|
|
|
|
|
73 — |
96 |
|
|
|
|
2019 |
|
|
No PHG or MCLs available |
|
|||||||||
|
|
|
|
|
|
|
|
|
|
|
|
|
|
|
|||||||||||||
|
Aggressive Index |
|
11.21 |
|
|
11.09 — |
11.34 |
|
|
2019 |
|
|
No PHG or MCLs available |
|
|||||||||||||
|
|
|
|
|
|
|
|
|
|
|
|
|
|
|
|
|
|
|
|
|
|
|
|
|
|
|
|
Contaminants
Hesperia Water District
EWG's drinking water quality report shows results of tests conducted by the water utility and provided to the Environmental Working Group by the California State Water Resources Control Board, as well as information from the U.S. EPA Enforcement and Compliance History database (ECHO). For the latest quarter assessed by the U.S. EPA (January 2019 - March 2019), tap water provided by this water utility was in compliance with federal health-based drinking water standards.
Utility details
- Serves: 91627
- Data available: 2012-2017
- Data Source: Groundwater
- Total: 14
Contaminants That Exceed Guidelines
- Arsenic
- Chromium (hexavalent)
- Nitrate
- Nitrate and nitrite
- Total trihalomethanes (TTHMs)
Other Detected Contaminants
- 1%2C4-Dioxane
- Chlorate
- Chloroform
- Chromium (total)
- Fluoride
- Molybdenum
- Strontium
- Testosterone
- Vanadium
Reminder
Always take extra precautions, the water may be safe to drink when it leaves the sewage treatment plant but it may pick up pollutants during its way to your tap. We advise that you ask locals or hotel staff about the water quality. Also, note that different cities have different water mineral contents.