Table of Contents
Can You Drink Tap Water in Wilmington?
Yes, Wilmington's tap water is generally considered safe to drink as Wilmington has no active health based violations of the Safe Drinking Water Act (SDWA) that we are aware of. Other factors such as lead piping in a home, or low levels of pollutants on immunocompromised individuals, should also be considered, however. To find more recent info we might have, you can check out our boil water notice page, the city's water provider website, or Wilmington's local Twitter account.
According the EPA’s ECHO database, from April 30, 2019 to June 30, 2022, Wilmington's water utility, Cfpua-Wilmington, had 3 non-health-based violations of the Safe Drinking Water Act. For more details on the violations, please see our violation history section below. The last violation for Wilmington was resolved on March 31, 2018. This assessment is based on the Cfpua-Wilmington water system, other water systems in the city may have different results.
While tap water that meets the EPA health guidelines generally won’t make you sick to your stomach, it can still contain regulated and unregulated contaminants present in trace amounts that could potentially cause health issues over the long-run. These trace contaminants may also impact immunocompromised and vulnerable individuals.
The EPA is reviewing if it’s current regulations around pollutant levels in tap water are strict enough, and the health dangers posed by unregulated pollutants, like PFAS.
Water Quality Report for Wilmington Tap Water
The most recent publicly available numbers for measured contaminant levels in Wilmington tap water are in its 2020 Water Quality Report. As you can see, there are levels which the EPA considers to be acceptable, but being below the maximum allowable level doesn’t necessarily mean the water is healthy.
Lead in tap water, for example, is currently allowed at up to 15ppb by the EPA, but it has set the ideal goal for lead at zero. This highlights how meeting EPA standards doesn’t necessarily mean local tap water is healthy.
EPA regulations continue to change as it evaluates the long term impacts of chemicals and updates drinking water acceptable levels. The rules around arsenic, as well as, lead and copper are currently being re-evaluated.
There are also a number of "emerging" contaminants that are not currently. For example, PFAS (Per- and polyfluoroalkyl substances), for which the EPA has issued a health advisory. PFAS are called "forever chemicals" since they tend not to break down in the environment or the human body and can accumulate over time.
We recommend looking at the contaminants present in Wilmington's water quality reports, or getting your home's tap water tested to see if you should be filtering your water.
Wilmington Tap Water Safe Drinking Water Act Violation History - Prior 10 Years
Below is a ten year history of violations for the water system named Cfpua-Wilmington for Wilmington in North Carolina. For more details please see the "What do these Violations Mean?" section below.
For the compliance period beginning July 1, 2020, Wilmington had 1 non-health based Safe Drinking Water Act violation with the violation category being Other Violation, more specifically, the violation code was Consumer Confidence Report Complete Failure to Report which falls into the Other rule code group, and the Consumer Confidence Rule rule code family for the following contaminant code: Consumer Confidence Rule.
For the compliance period beginning July 1, 2019, Wilmington had 1 non-health based Safe Drinking Water Act violation with the violation category being Other Violation, more specifically, the violation code was Consumer Confidence Report Complete Failure to Report which falls into the Other rule code group, and the Consumer Confidence Rule rule code family for the following contaminant code: Consumer Confidence Rule.
From June 1, 2019 to June 30, 2019, Wilmington had 1 non-health based Safe Drinking Water Act violation with the violation category being Monitoring and Reporting, more specifically, the violation code was Monitoring, Turbidity (Enhanced SWTR) which falls into the Microbials rule code group, and the Surface Water Treatment Rules rule code family for the following contaminant code: Interim Enhanced Surface Water Treatment Rule.
From March 1, 2018 to March 31, 2018, Wilmington had 1 non-health based Safe Drinking Water Act violation with the violation category being Monitoring Violation, more specifically, the violation code was Monitoring, Routine (RTCR) which falls into the Microbials rule code group, and the Total Coliform Rules rule code family for the following contaminant code: Revised Total Coliform Rule.
From Oct. 1, 2013 to Dec. 31, 2013, Wilmington had 1 non-health based Safe Drinking Water Act violation with the violation category being Monitoring and Reporting, more specifically, the violation code was Monitoring, Regular which falls into the Chemicals rule code group, and the Synthetic Organic Chemicals rule code family for the following contaminant code: Dalapon.
Is there Lead in Wilmington Water?
Based on the EPA’s ECHO Database, 90% of the samples taken from the Wilmington water system, Cfpua-Wilmington, between sample start date and sample end date, were at or below, 0.0 mg/L of lead in Wilmington water. This is 0% of the 0.015 mg/L action level. This means 10% of the samples taken from Wilmington contained more lead.
While Wilmington water testing may have found 0.0 mg/L of lead in its water, that does not mean your water source has the same amount. The amount of lead in water in a city can vary greatly from neighborhood to neighborhood, or even building to building. Many buildings, particularly older ones, have lead pipes or service lines which can be a source of contamination. To find out if your home has lead, we recommend getting you water tested.
No amount of lead in water is healthy, only less dangerous. As lead accumulates in our bodies over time, even exposure to relatively small amounts can have negative health effects. For more information, please check out our Lead FAQ page.
Are there PFAS in Wilmington Tap Water?
Currently, testing tap water for PFAS isn’t mandated on a national level. We do have a list of military bases where there have been suspected or confirmed leaks. There appears to be at least one military base - Military Ocean Terminal Sunny Point - near Wilmington with suspected leaks.
With many potential sources of PFAS in tap water across the US, the best information we currently have about which cities have PFAS in their water is this ewg map, which you can check to see if Wilmington has been evaluated for yet.
Our stance is better safe than sorry, and that it makes sense to try to purify the tap water just in case.
Wilmington SDWA Violation History Table - Prior 10 Years
| Compliance Period | Status | Health-Based? | Category Code | Code | Rule Code | Contaminant Code | Rule Group Code | Rule Family Code |
|---|---|---|---|---|---|---|---|---|
| 07/01/2020 - | Resolved | No | Other Violation (Other) | Consumer Confidence Report Complete Failure to Report (71) | Consumer Confidence Rule (420) | Consumer Confidence Rule (7000) | Other (400) | Consumer Confidence Rule (420) |
| 07/01/2019 - | Resolved | No | Other Violation (Other) | Consumer Confidence Report Complete Failure to Report (71) | Consumer Confidence Rule (420) | Consumer Confidence Rule (7000) | Other (400) | Consumer Confidence Rule (420) |
| 06/01/2019 - 06/30/2019 | Archived | No | Monitoring and Reporting (MR) | Monitoring, Turbidity (Enhanced SWTR) (38) | Long Term 1 Enhanced Surface Water Treatment Rule (122) | Interim Enhanced Surface Water Treatment Rule (0300) | Microbials (100) | Surface Water Treatment Rules (120) |
| 03/01/2018 - 03/31/2018 | Resolved | No | Monitoring Violation (MON) | Monitoring, Routine (RTCR) (3A) | Revised Total Coliform Rule (111) | Revised Total Coliform Rule (8000) | Microbials (100) | Total Coliform Rules (110) |
| 10/01/2013 - 12/31/2013 | Resolved | No | Monitoring and Reporting (MR) | Monitoring, Regular (03) | Synthetic Organic Chemicals (320) | Dalapon (2031) | Chemicals (300) | Synthetic Organic Chemicals (320) |
What do these Violations Mean?
Safe Drinking Water Act Violations categories split into two groups, health based, and non-health based. Generally, health based violations are more serious, though non-health based violations can also be cause for concern.
Health Based Violations
- Maximum contaminant levels (MCLs) - maximum allowed contaminant level was exceeded.
- Maximum residual disinfectant levels (MRDLs) - maximum allowed disinfectant level was exceeded.
- Other violations (Other) - the exact required process to reduce the amounts of contaminants in drinking water was not followed.
Non-Health Based Violations
- Monitoring and reporting violations (MR, MON) - failure to conduct the required regular monitoring of drinking water quality, and/or to submit monitoring results on time.
- Public notice violations (Other) - failure to immediately alert consumers if there is a serious problem with their drinking water that may pose a risk to public health.
- Other violations (Other) - miscellaneous violations, such as failure to issue annual consumer confidence reports or maintain required records.
SDWA Table Key
| Field | Description |
|---|---|
| Compliance Period | Dates of the compliance period. |
| Status |
Current status of the violation.
|
| Health-Based? | Whether the violation is health based. |
| Category Code |
The category of violation that is reported.
|
| Code | A full description of violation codes can be accessed in the SDWA_REF_CODE_VALUES (CSV) table. |
| Contaminant Code | A code value that represents a contaminant for which a public water system has incurred a violation of a primary drinking water regulation. |
| Rule Code |
Code for a National Drinking Water rule.
|
| Rule Group Code |
Code that uniquely identifies a rule group.
|
| Rule Family Code |
Code for rule family.
|
For more clarification please visit the EPA's data dictionary.
Wilmington Water - Frequently Asked Questions
| By Mail: | 235 GOVERNMENT CENTER DR WILMINGTON, NC, 28403 |
Existing customers can login to their Cfpua-Wilmington account to pay their Wilmington water bill by clicking here.
If you want to pay your Cfpua-Wilmington bill online and haven't made an account yet, you can create an account online. Please click here to create your account to pay your Wilmington water bill.
If you don't want to make an account, or can't remember your account, you can make a one-time payment towards your Wilmington water bill without creating an account using a one time payment portal with your account number and credit or debit card. Click here to make a one time payment.
Moving to a new house or apartment in Wilmington means you will often need to put the water in your name with Cfpua-Wilmington. In order to put the water in your name, please click the link to the start service form below. Start service requests for water bills typically take two business days.
Leaving your house or apartment in Wilmington means you will likely need to take your name off of the water bill with Cfpua-Wilmington. In order to take your name off the water bill, please click the link to the stop service form below. Stop service for water bills requests typically take two business days.
The estimated price of bottled water
$2.15 in USD (1.5-liter)
USER SUBMITTED RATINGS
- Drinking Water Pollution and Inaccessibility
- Water Pollution
- Drinking Water Quality and Accessibility
- Water Quality
The above data is comprised of subjective, user submitted opinions about the water quality and pollution in Wilmington, measured on a scale from 0% (lowest) to 100% (highest).
Related FAQS
Wilmington Water Quality Report (Consumer Confidence Report)
The EPA mandates that towns and cities consistently monitor and test their tap water. They must report their findings in an annual Consumer Confidence Report. Below is the most recent water quality report from Wilmington's Water. If you would like to see the original version of the report, please click here.
2020
Annual Drinking Water Quality Report

Cape Fear Public Utility Authority 2020 Drinking Water Quality Results
From the
Executive Director
This Annual Water Quality Report is your guide to the drinking water supplied by Cape Fear Public Utility Authority to you, our customers. It includes important information about the rigorous testing, analysis, and treatment CFPUA’s staff performs each day to
provide high quality water service.
Consider this our official report card for 2020, detailing how we are meeting or exceeding the many drinking water standards established by the State of North Carolina and the U.S. Environmental Protection Agency. I am proud to share these results with you.
The COVID-19 pandemic was a stark reminder of the importance of CFPUA’s mission to main- tain reliable, quality water service for our community. By the time the first cases of COVID-19 were reported in New Hanover County in early 2020, staff was implementing plans for remote work and additional precautions at CFPUA facilities. During the spring and summer peak of cases, staff even sheltered in-place at our Sweeney and Richardson water treatment plants to reduce the chances of staffing shortages among these essential employees (learn more on page 3 of this report). I am grateful to all of CFPUA’s staff, whose hard work and flexibility kept our community’s critical water and wastewater services flowing during a difficult year.
The past year also saw steady progress on our Sweeney Treatment Enhancements Project, which will significantly increase the Sweeney Plant’s ability to remove PFAS, such as GenX, from raw Cape Fear River water. This $43 million investment by CFPUA will add eight new Granular Activated Carbon (GAC) filters to our Sweeney Plant, which serves approximately 80 percent of CFPUA’s customers. We look forward to these state-of-the-art filters coming online at the start of 2022.
Whether innovating to meet the challenges of a pandemic or investing in our region’s infrastructure, everything we do at CFPUA is driven by our commitment to offer the highest possible level of service at the lowest practicable cost to our customers.
1
James R. Flechtner
Executive Director
Table of Contents |
www.cfpua.org | @CFPUA |
|
|
|
3 |
Your Water Service Area |
5 |
Protecting Your Water |
7 |
Lead and Home Plumbing |
9 |
Water Disinfection and Health Effects.. |
10 |
Glossary of Drinking Water Terms |
11 |
Results: Sweeney System |
13 |
Results: Richardson System |
19 |
Results: Monterey Heights System |
25 |
Share this Report
This report contains information on drinking water that may be of interest to your family, friends, and others you know in our community. To share a digital copy of this report, use the following link: www.cfpua.org/2020WaterQuality
To receive a printed copy of this report, please email: communications@cfpua.org. You may also contact us on our social media accounts to ask for a copy of this report.
En Español
Para obtener una copia del informe |
|
en Español sobre los resultados |
|
más recientes de la calidad del |
|
agua publicado por el Cape Fear |
|
Public Utility Authority, llame al |
|
|
2 |
|
Cape Fear Public Utility Authority 2020 Drinking Water Quality Results
Above and Beyond
From April to June 2020, staff sheltered in-place at CFPUA’s water treatment plants as COVID cases spiked.
With cases of COVID-19 rising in New Hanover County, CFPUA leaders moved in spring 2020
to protect employees. Among the most important priorities: making sure that water treatment plants consistently had healthy staff to provide critical water services to CFPUA’s customers during the pandemic.
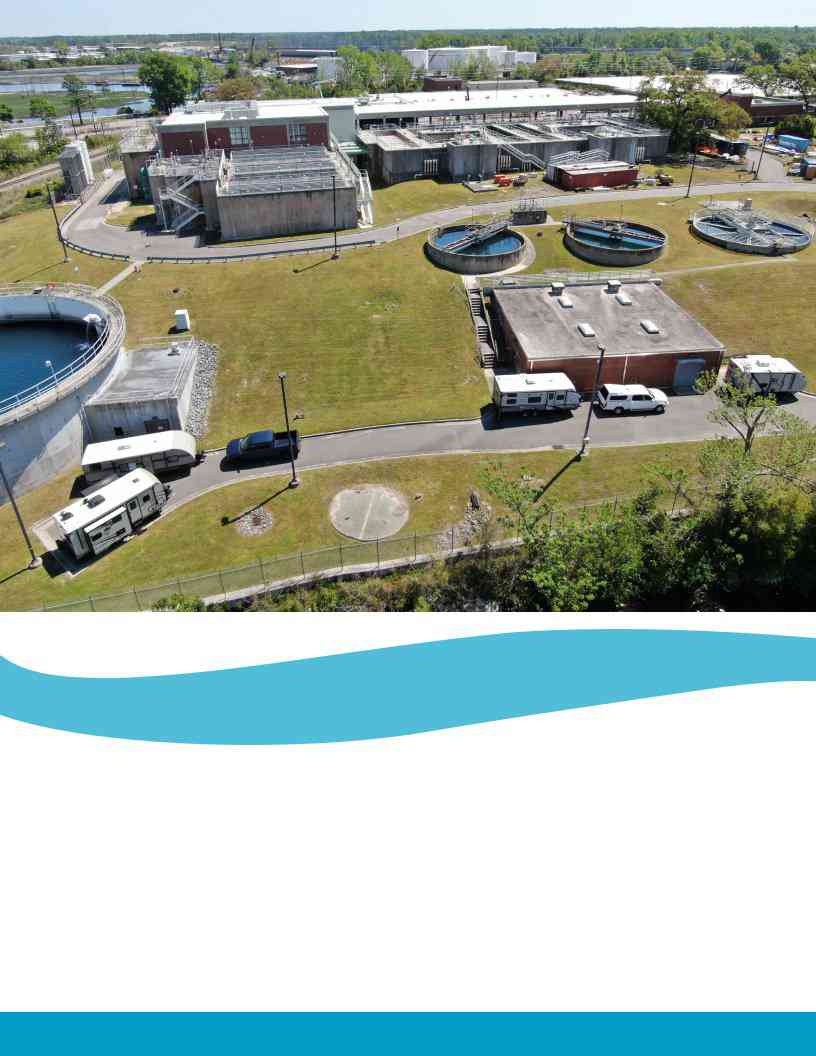
Staff determined that the best way to protect employees from COVID transmission was by limiting contact with the public. While CFPUA’s facilities were closed to the public in April, rented trailers were dispatched to the Sweeney and Richardson water treatment plants, allowing staff to temporarily shelter in- place.
3 |
Picture: Fully furnished trailers placed at the Sweeney Water Treatment Plant in Wilmington in spring 2020. |

www.cfpua.org | @CFPUA
Each trailer -- fully furnished and supplied with food and necessities -- became an office-home for CFPUA’s wa- ter plant staff. Team members worked and lived at the plants for 7-day shifts, trading off each week with an- other team of operators before heading home for a weeklong break. A support team of other employees handled food and supply drops, allowing plant oper- ators to stay safely isolated.
“We understand there’re 10 people in this world that can run this plant and that’s us, so we can’t be selfish.
We have to isolate,” Water Control Operator Michael Brock Dombrowski said this summer while working from the
Sweeney Plant. “Myself and my fellow operators understand we are essential employees, and we take pride in our service.”
Staff still found ways to safely socialize, whether over FaceTime with family or socially distant dinners with co-workers.
“It’s been pretty nice,” Water Control Operator Chris Fulcher said at the time. “Me and my fellow operators, I think we’ve all got a little closer.”
By late June the spread of COVID-19 had slowed consider- ably in the region, and CFPUA ended the trailer program, with staff returning to regular shifts but keeping safety protocols in place. The program, which cost CFPUA rough-
ly $160,000 per month, ensured that water treatment plants ran consistently throughout the peak of the pandemic.
“I just wanted to tell CFPUA leadership that I thank them, because they’ve really taken good care of us here,” Water Control Operator Vatrice Robinson said. “They did go over and above for us. And I thank our families for having our backs. We wouldn’t be able to do this without them.”
Pictures (Top to bottom): Michael Dombrowski, Chris Fulcher, Vatrice Robinson |
4 |
YourCape Fear Public Utility AuthorityWater2020 Drinking Quality Results
Service Area
This report includes drinking water quality results for
CFPUA's three water distribution systems.
Results from this testing period found that our drinking water continues to meet or exceed
federal and state regulatory standards.
These standards are designed to protect public health and the taste and appearance of drinking water.
5
Cape Fear Public Utility Authority is required by the U.S. Environmental Pro- tection Agency to produce an Annual Water Quality Report for its customers. However, this report goes beyond basic requirements and provides you infor- mation on the water systems that serve your home, workplace, and the places you visit for entertainment and commu- nity services. We hope you find it informative and educational.
If you have any questions about this re- port or concerning your water, please contact CFPUA’s Water Treatment Di- vision at 910-332-6739. We want our valued customers to be informed about their water utility. If you want to learn more, consider attending an Authority Board Meeting on the second Wednes- day of each month at 9:00 a.m. in Room 601 of the New Hanover County Government Center Complex.
www.cfpua.org | @CFPUA |
Richardson Water System (CFPUA/NHC |
|
|
|
system PWS ID# |
|
|
|
water in northern New Hanover County in |
|
areas including Murrayville, Northchase, |
|
Porters Neck, and parts of Castle Hayne |
|
and Ogden. Water is provided via the |
|
Richardson Water Treatment Plant using |
|
groundwater sourced from the Castle |
|
Hayne and PeeDee aquifers. |
|
|
Sweeney Water System (CFPUA/ Wilmington system PWS ID# 04-65- 010): CFPUA’s largest system, which distributes water within the City of Wilmington, parts of the Ogden area, Monkey Junction/ Independence Boulevard (including Pine Valley, Echo Farms, Barclay, Crosswinds, and Lake Brewster), Kings Grant, Tarin Woods, River Lights, U.S. 421, and Wrightsboro. Water is provided via the Sweeney Water Treatment Plant using source water from the Cape Fear River.
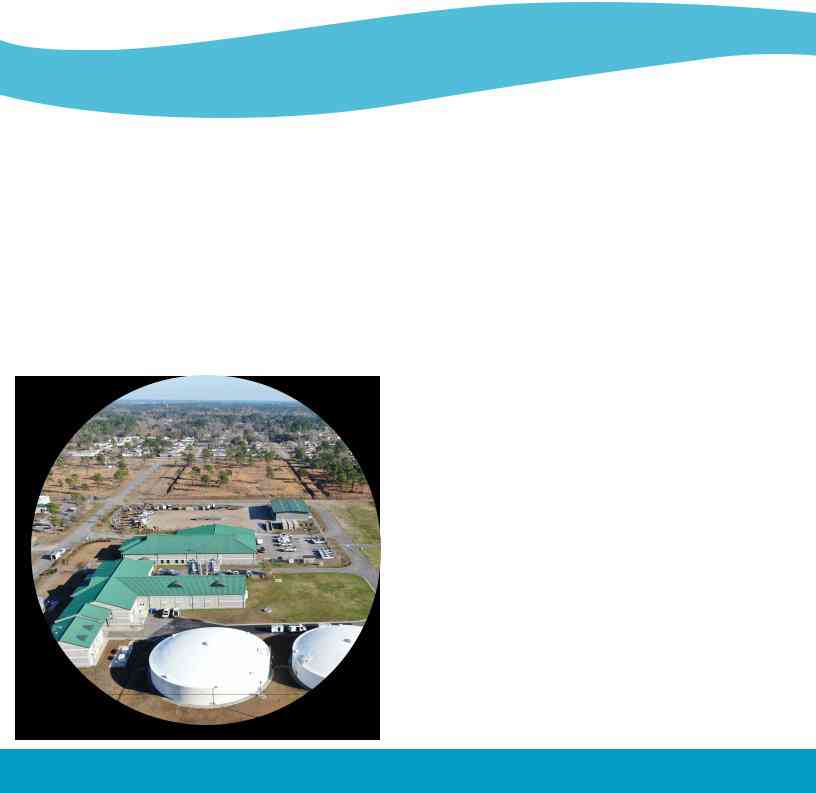
Monterey Heights Water System (CFPUA/
Monterey Heights system PWS ID# 04-
65-137): CFPUA’s smallest system, which distributes water in southern New Hanover County in areas including Monterey Heights, Woodlake, Laurel Ridge, Sentry Oaks, and Veterans Park. Groundwater is sourced from the Castle Hayne aquifer and distributed by a series of wells. This system differs from our two other drinking water systems in that it does not rely on a water treatment plant.
New Hanover County
6
ProtectingCape Fear Public Utility Authority 2020 Drinking WateryourQuality Results
Water
Drinking water, including bottled water, may reasonably be expected to contain at least small amounts of some contaminants. The presence of contaminants does not neces- sarily indicate that water poses a health risk. More information about contaminants and
potential health effects can be obtained by calling the Environmental Protection Agency’s Safe Drinking Water Hotline (800-426-4791).
Some people may be more vulnerable to contaminants in drinking water than the general pop- ulation. Immuno-compromised persons such as persons with cancer undergoing chemother- apy, persons who have undergone organ transplants, people with HIV/AIDS or other immune system disorders, some elderly, and infants can be particularly at risk from infections. These people should seek advice about drinking water from their health care providers. EPA/CDC guidelines on appropriate means to lessen the risk of infection by Cryptosporidium and other microbial contaminants are available from the Safe Drinking Water Hotline (800-426-4791).
If present, elevated levels of lead can cause serious health problems, especially for pregnant women and young children. Lead in drinking water is primarily from materials and components associated with service lines and home plumbing. CFPUA is responsible for providing high
quality drinking water but cannot control the variety of materials used in plumbing compo- nents. When your water has been sitting for several hours, you can mini-
mize the potential for lead exposure by flushing your tap for 30 seconds to 2 minutes before using water
for drinking or cooking. If you are
7

www.cfpua.org | @CFPUA
concerned about lead in your water, you may wish to have your water tested. Information on lead in drinking water, testing methods, and steps you can take to minimize exposure is avail- able from the Safe Drinking Water Hotline or at www.epa.gov/safewater/lead.
Across the nation, rivers, lakes, streams, ponds, reservoirs, springs, and wells are sources of drinking water (both tap and bottled). As water travels over the surface of the land or through the ground, it dissolves naturally occurring minerals and, in some cases, radioactive material, and can pick up contaminants resulting from animal or human activity. Contaminants that may be present in source water include:
Microbial Contaminants, such as viruses and bacteria, which may come from sewage treatment plants, septic systems, agricultural livestock operations, or wildlife.
Inorganic Contaminants, such as salts and metals, which can be naturally occurring or may result from urban stormwater runoff, industrial or domestic wastewater discharges, oil and gas production, mining, or farming.
Pesticides and Herbicides, which may come from a variety of sources such as agricul- ture, urban stormwater runoff, and residential uses.
Organic Chemical Contaminants, including synthetic and volatile organic chemicals, which are byproducts of industrial processes and petroleum production and may also come from gas stations, urban stormwater runoff, and septic systems.
Radioactive Contaminants, which can be naturally occurring or may be the result of oil and gas production and mining activities.
To ensure that tap water is safe to drink, EPA prescribes regulations that limit the amounts of certain contaminants in water provided by public water systems. FDA regulations establish lim- its for substances in bottled water to provide protection for public health.
8
Cape Fear Public Utility Authority 2020 Drinking Water Quality Results
Lead and
Home Plumbing
Lead in drinking water has been a concern in the water and wastewater industries for de- cades. The primary sources of lead in drinking water are corrossion in drinking water sys- tems and internal plumbing appliances maintained by homeowners.
In 1991, the EPA introduced the Lead and Copper Rule (LCR) to ensure public water suppliers manage lead and copper in drinking water. Public water suppliers have several tools to make sure they are meeting the requirements of this rule.
To effectively monitor and manage lead and copper in drinking water, public water suppliers often implement corrosion-control measures. Water treatment operators maintain pH levels and add orthophosphate to the water to protect against corrosion in the plumbing and pipes in the water system, homes and businesses. To monitor effectiveness, CFPUA staff regularly test lead and copper levels in our customer’s homes and frequently test water quality parameters throughout the water service area.
CFPUA’s corrosion-control program has successfully managed the threat of lead in our drinking water. However, we cannot control the variety of materials used in internal plumbing compo- nents—the private parts of water systems that are owned and maintained by home and busi- ness owners.
In older areas of New Hanover County, homes may rely on aging plumbing systems that ha- ven’t been updated to meet newer standards. When internal plumbing components contain lead, residents and customers are more likely to be exposed to these metals as they leach into drinking water from faucets and other plumbing materials.
Reducing Lead Exposure at Home
- Use only cold water for drinking, cooking, and making baby formula.
- Boiling water does not remove lead from water.
- Regularly clean your faucet’s screen (also known as an aerator).
- Before use, flush your pipes by running your tap for at least 30 seconds.
- Contact CFPUA to learn more about sources of
9 |
lead and removing lead service lines. |
|

Water Disinfection and
Health Effects
Disinfecting source water is a critical part of any water treatment process. Chlorine and other disinfectants eliminate water-borne pathogens such as Giardia, Cryptosporidium, E. Coli, bacteria, and viruses. These microbial pathogens are known to cause gastroin-
testinal illnesses and other health issues. Because these pathogens are found in the Cape Fear River, the water source for the Sweeney Water Treatment Plant, CFPUA uses chlorine to treat our water prior to its distribution. The Richardson and Monterey Heights water systems also undergo disinfection.
Chlorine treatment has proven to be a transformative achievement in public health. Intro- duced as the solution to the 1850 cholera epidemic in London, chlorine became a widely used water disinfectant by the 1900s.
Unfortunately, chlorine and other disinfectants may cause problems once in the distribution system. They can react with naturally occurring compounds in water to form byproducts such as Trihalomethanes (THM), Haloacetic acids (HAA), Chlorite, and Bromate. According to the EPA, some disinfection byproducts are “suspected to cause bladder cancer and reproductive effects in humans.” To ensure that public water suppliers such as CFPUA provide clean drinking water, the U.S. Environmental Protection Agency (EPA) developed the Stage 2 Disinfection Byproduct rule.
CFPUA developed a plan to not only meet but surpass state and federal regulations. As part of the plan, 17 aeration systems have been installed at the Sweeney plant. These systems reduce formation of disinfection byproducts by spraying fine, uniform particles of water into the air.
This process allows volatile compounds to escape into the atmosphere. Without this escape mechanism, these volatile compounds could react with chlorine and other disinfectants to cre- ate disinfection byproducts. The effectiveness of the aeration systems in reducing disinfection byproducts is evident in CFPUA’s consistent compliance with the EPA Stage 2 Rule. Sweeney’s treatment process also includes ozone and ultraviolet light disinfection.
CFPUA also practices routine water system flushing. This helps maintain water pressure and pipe integrity and minimizes the formation of disinfection byproducts. During flushing, water is forced through pipes and out of fire hydrants at a high velocity, removing accumulated min- eral sediment until the water is clear. Because disinfection byproducts are more easily formed at high temperatures, CFPUA conducts flushing during the summer months. CFPUA conducts sampling to confirm that these protocols effectively reduce disinfection byproducts and ensure compliance with state and federal requirements.
10
Cape Fear Public Utility Authority 2020 Drinking Water Quality Results
Glossary of
Drinking Water Terms
Action Level (AL) - The concentration of a con- taminant that, if exceeded, triggers treatment or other requirements that a water system must follow.
Locational Running Annual Average (LRAA)
- The average of sample analytical results for samples taken at a particular monitoring location during the previous four calendar quarters under the Stage 2 Disinfectants and Disinfection Byproducts Rule.
Maximum Contaminant Level (MCL) - The highest level of a contaminant that is allowed in drinking water. MCLs are set as close to the MCLGs as feasible using the best available treatment technology.
Maximum Contaminant Level Goal (MCLG) - The level of a contaminant in drinking water below which there is no known or expected risk to health. MCLGs allow for a margin of safety.
Maximum Residual Disinfection Level (MRDL)
- The highest level of a disinfectant allowed in drinking water. There is convincing evidence that addition of a disinfectant is necessary for control of microbial contaminants.
Maximum Residual Disinfection Level Goal (MRDLG) - The level of a drinking water dis- infectant below which there is no known or expected risk to health. MRDLGs do not re- flect the benefits of the use of disinfectants to control microbial contaminants.
Million Fibers per Liter (MFL) - Million fibers per liter is a measure of the presence of as- bestos fibers that are longer than 10 microm- eters.
Nephelometric Turbidity Unit (NTU) - Neph- elometric turbidity unit is a measure of the clarity of water. Turbidity in excess of 5 NTU is just noticeable to the average person.
11
www.cfpua.org | @CFPUA
Not-Applicable (N/A) - Information not applicable/not required for that particular water system or for that particular rule.
Non-Detects (ND) - Laboratory analysis indicates that the contaminant is not present at the level of detection set for the particular methodology used.
Parts per million (ppm) or Milligrams per liter (mg/L) - One part per million corresponds to one minute in two years or a single penny in $10,000.
Parts per billion (ppb) or Micrograms per liter (ug/L)
- One part per billion corresponds to one minute in 2,000 years, or a single penny in $10,000,000.
Parts per trillion (ppt) or Nanograms per liter (ng/L)
- One part per trillion corresponds to one minute in 2,000,000 years, or a single penny in $10,000,000,000.
Parts per quadrillion (ppq) or Picograms per liter (picograms/L) - One part per quadrillion corresponds to one minute in 2,000,000,000 years or one penny in $10,000,000,000,000.
Picocuries per liter (pCi/L) - Picocuries per liter is a measure of the radioactivity in water.
Secondary Maximum Contaminant Level (SMCL) - The highest level of a contaminant that is allowed in drink- ing water under the EPA’s National Secondary Drinking Water Regulations. These non-mandatory regulations provide standards for aesthetic considerations in water, such as taste, color, and odor. These contaminants are not considered to present a risk to human health.
Treatment Technique (TT) - A required process intend- ed to reduce the level of a contaminant in drinking water.
12

Cape Fear Public Utility Authority 2020 Drinking Water Quality Results
2020 Drinking Water Quality Results – PWS ID# 04-65-010, Sweeney Water System
We routinely monitor for over 150 contaminants in your drinking water according to Federal and State laws. The tables below list all the drinking water contaminants that we detected in the last round of sampling for each particular contaminant group. The presence of contaminants does not necessarily indicate that water poses a health risk. Unless otherwise noted, the data presented in this table is from testing done January 1 through December 31, 2020. The EPA and the State allow us to monitor for certain contaminants less than once per year because the concentrations of these contaminants are not expected to vary significantly from year to year. Some of the data, though representative of the water quality, is more than one year old.
Microbiological | Turbidity | Inorganic Contaminants |
Other Disinfection By-Products | Disinfection Residuals Summary
E.coli - Fecal coliforms and E.coli are bacteria whose presence indicates that the water may be contaminated with human or animal wastes. Microbes in these wastes can cause
Fecal Indicators (enterococci or coliphage) - Fecal indicators are microbes whose presence indicates that the water may be contaminated with human or animal wastes. Microbes in these wastes can cause
Contaminant |
Contaminant |
Reporting |
Your |
Sample |
TT |
MCL/MRDL |
Range |
MCLG/ |
MCL |
Likely Source |
|
(units) |
Type |
Basis |
Water |
Date |
Violation |
Violation |
Low - High |
MRDL |
of Contamination |
||
|
|
|
|
|
|
|
|
|
|
|
|
Total coliform |
Microbiological |
|
|
|
|
|
|
|
|
|
|
Contaminants in |
|
N/A |
2020 |
N/A |
N/A |
N/A |
N/A |
TT* |
Naturally present in the |
||
bacteria |
the Distribution |
|
environment |
||||||||
|
|
|
|
|
|
|
|
||||
|
System |
|
|
|
|
|
|
|
|
|
|
|
Microbiological |
Highest Monthly |
|
|
|
|
|
|
|
|
|
E. Coli |
Contaminants in |
0% |
2020 |
N/A |
NO |
N/A |
0 |
** |
Human and animal fecal |
||
the Distribution |
Percent of |
waste |
|||||||||
|
Positive Samples |
|
|
|
|
|
|
|
|||
|
System |
|
|
|
|
|
|
|
|
|
|
Turbidity |
Turbidity – |
Highest single |
|
|
NO1 |
|
|
|
|
|
|
Systems with |
0.275 |
2020 |
|
|
|
|
|
||||
turbidity |
N/A |
N/A |
N/A |
N/A |
Soil Runoff |
||||||
(NTU) ** |
population > |
measurement |
|
|
|
|
|
|
|
|
|
|
10,000 |
|
|
|
|
|
|
|
|
||
|
|
|
|
|
|
|
|
|
|
||
Turbidity |
Turbidity – |
Lowest monthly |
|
|
NO2 |
|
|
|
|
|
|
Systems with |
|
2020 |
|
|
|
|
|
||||
percent of sample |
100% |
N/A |
N/A |
N/A |
N/A |
Soil Runoff |
|||||
(NTU) ** |
population > |
meeting limits |
|
|
|
|
|
|
|
|
|
|
10,000 |
|
|
|
|
|
|
|
|
||
|
|
|
|
|
|
|
|
|
|
||
|
|
Highest |
|
2018 |
|
|
|
|
|
Erosion of natural deposits; |
|
Fluoride (ppm) |
Inorganic |
|
|
|
|
|
|
water additive that pro- |
|||
Compliance |
0.7 |
2019 |
N/A |
NO |
0.1 – 0.7 |
4 |
4 |
motes strong teeth; |
|||
Contaminants |
|||||||||||
|
|
Result |
|
2020 |
|
|
|
|
|
discharge from fertilizers |
|
|
|
|
|
|
|
|
|
|
|
and aluminum factories |
|
|
|
Highest |
|
|
|
|
|
|
|
Leaching from |
|
Thallium (ppb) |
Inorganic |
|
|
|
|
|
|
|
ing sites; discharge from |
||
Compliance |
1.0 |
2019 |
N/A |
NO |
ND – 1.0 |
0.5 |
2 |
||||
Contaminants |
electronics, glass, and drug |
||||||||||
|
Result |
|
|
|
|
|
|
|
|||
|
|
|
|
|
|
|
|
|
factories |
||
|
|
|
|
|
|
|
|
|
|
||
Chlorine (ppm) |
Disinfectant |
Highest Running |
|
|
|
|
|
|
|
Water additive used to |
|
Residuals |
1.36 |
2020 |
N/A |
NO |
0.20 – 2.32 |
4 |
4 |
||||
Annual Average |
control microbes |
||||||||||
|
Summary |
|
|
|
|
|
|
|
|||
|
|
|
|
|
|
|
|
|
|
*TT: If a system collecting 40 or more samples per month finds greater than 5% of monthly samples are positive in one month, an assessment is required.
** Turbidity is a measure of the cloudiness of the water. We monitor it because it is a good indicator of the effectiveness of our filtra- |
|
tion system. The turbidity rule requires that 95% or more of the monthly samples must be less than or equal to 0.3 NTU. |
|
13 |
Continued on next page |
|
|

1 TT Violation if: Turbidity > 1 NTU.
2 TT Violation if: Less than 95% of monthly turbidity measurements are < 0.3 NTU.
-
Routine and repeat samples are total
coliform-positive and either is E.coli-positive or system fails to take repeat samples following E.coli-positive routine sample or system fails to analyze totalcoliform-positive repeat sample for E. coli. If either an original routine sample and/or its repeat sample(s) are E. coli positive, a Tier 1 violation exists.
Water Characteristics Contaminants
Secondary Substances, required by the NC Public Water Supply Section, are substances that affect the taste, odor, and/or color of drinking water. These aesthetic substances normally do not have any health effects and normally do not affect the safety of your water.
|
Contaminant |
|
|
Reporting |
|
|
Your |
|
Sample |
|
|
Range |
|
|
|
SMCL |
|||||||||||
|
(units) |
|
|
|
|
|
Basis |
|
|
Water |
|
Date |
|
|
|
|
Low - High |
|
|
||||||||
|
|
|
|
|
|
|
|
|
|
|
|
|
|
|
|
|
|||||||||||
|
Iron (ppm) |
|
|
|
Highest |
|
|
|
|
|
2018 |
|
|
|
|
|
|
|
|
|
|
|
|||||
|
|
Compliance |
0.53 |
|
|
2019 |
|
|
|
|
ND – 0.53 |
|
|
0.3 mg/L |
|||||||||||||
|
|
|
|
|
|
|
|
|
Result |
|
|
|
|
|
2020 |
|
|
|
|
|
|
|
|
|
|
|
|
|
|
|
|
|
|
|
|
|
|
|
|
|
|
|
|
|
|
|
|
|
|
|
|
|
|
|
|
|
Manganese (ppm) |
|
|
|
Highest |
|
|
|
|
|
2018 |
|
|
|
|
|
|
|
|
|
|
|
|||||
|
|
Compliance |
0.017 |
|
|
2019 |
|
|
|
|
ND – 0.017 |
|
|
0.05 mg/L |
|||||||||||||
|
|
|
|
|
|
|
|
|
Result |
|
|
|
|
|
2020 |
|
|
|
|
|
|
|
|
|
|
|
|
|
|
|
|
|
|
|
|
|
|
|
|
|
|
|
|
|
|
|
|
|
|
|
|
|
|
|
|
|
pH (standard units) |
|
|
|
Highest |
|
|
|
|
|
2018 |
|
|
|
|
|
|
|
|
|
|
|
|||||
|
|
Compliance |
7.6 |
|
|
2019 |
|
|
|
|
7.0 – 7.6 |
|
|
6.5 to 8.5 |
|||||||||||||
|
|
|
|
|
|
|
|
|
Result |
|
|
|
|
|
2020 |
|
|
|
|
|
|
|
|
|
|
|
|
|
|
|
|
|
|
|
|
|
|
|
|
|
|
|
|
|
|
|
|
|
|
|
|
|
|
|
|
|
Sodium (ppm) |
|
|
|
Highest |
|
|
|
|
|
2018 |
|
|
|
|
|
|
|
|
|
|
|
|||||
|
|
Compliance |
37 |
|
|
2019 |
|
|
|
|
11 – 37 |
|
|
|
N/A |
||||||||||||
|
|
|
|
|
|
|
|
|
Result |
|
|
|
|
|
2020 |
|
|
|
|
|
|
|
|
|
|
|
|
|
|
|
|
|
|
|
|
|
|
|
|
|
|
|
|
|
|
|
|
|
|
|
|
|
|
|
|
|
Sulfate (ppm) |
|
|
|
Highest |
|
|
|
|
|
2018 |
|
|
|
|
|
|
|
|
|
|
|
|||||
|
|
Compliance |
38 |
|
|
2019 |
|
|
|
|
ND – 38 |
|
|
250 mg/L |
|||||||||||||
|
|
|
|
|
|
|
|
|
Result |
|
|
|
|
|
2020 |
|
|
|
|
|
|
|
|
|
|
|
|
|
|
|
|
|
|
|
|
|
|
|
|
|
|
|
|
|
|
|
|
|
|
|
|
|
|
|
|
|
Lead & Copper |
|
|
|
|
|
|
|
|
|
|
|
|
|
|
|
|
|
|
|
|
|
|
||||
|
|
|
|
|
|
|
|
|
|
|
|
|
|
|
|
|
|
|
|
|
|
|
|||||
|
Contaminant |
|
Reporting |
|
|
|
Your |
|
|
Sample |
|
# Sites |
|
MCLG |
|
Action |
|
|
|
Likely Source |
|
||||||
|
(units) |
|
|
Basis |
|
|
|
Water |
|
|
Date |
|
Above AL |
|
|
Level |
|
|
|
of Contamination |
|
||||||
|
|
|
|
|
|
|
|
|
|
|
|
|
|
|
|
||||||||||||
|
|
|
|
|
|
|
|
|
|
|
|
|
|
|
|
|
|
|
|
|
|
|
|
||||
|
Copper (ppm) |
|
|
90th |
|
|
0.150 |
|
|
2020 |
|
0 |
|
|
1.3 |
|
1.3 |
|
Corrosion of household plumbing |
|
|||||||
|
|
percentile |
|
|
|
|
|
|
|
systems; erosion of natural deposits |
|
||||||||||||||||
|
|
|
|
|
|
|
|
|
|
|
|
|
|
|
|
|
|
|
|
|
|||||||
|
|
|
|
|
|
|
|
|
|
|
|
|
|
|
|
|
|
|
|
|
|
|
|
||||
|
Lead (ppb) |
|
|
90th |
|
|
< 3.0 |
|
|
2020 |
|
0 |
|
|
0 |
|
15 |
|
Corrosion of household plumbing |
|
|||||||
|
|
percentile |
|
|
|
|
|
|
|
systems; erosion of natural deposits |
|
||||||||||||||||
|
|
|
|
|
|
|
|
|
|
|
|
|
|
|
|
|
|
|
|
|
|||||||
|
|
|
|
|
|
|
|
|
|
|
|
|
|
|
|
|
|
|
|
|
|
|
|
||||
Total Organic Carbon |
|
|
|
|
|
|
|
|
|
|
|
|
|
|
|
|
|
|
|
|
|||||||
|
|
|
|
|
|
|
|
|
|
|
|
|
|
|
|
|
|
|
|
|
|
|
|
||||
|
Contaminant |
|
Contaminant |
|
Reporting |
|
|
Your |
|
Sample |
|
|
TT |
Range |
|
Compliance |
Likely Source of |
||||||||||
|
(units) |
|
Type |
|
|
|
Basis |
|
|
Water |
|
|
Date |
|
Violation |
Low - High |
Method |
Contamination |
|||||||||
|
Total Organic |
|
Disinfection |
|
|
|
RAA |
|
|
|
|
|
|
|
|
|
|
|
|
|
|
|
|
|
|
||
|
Carbon |
|
|
|
|
|
|
|
|
|
|
|
|
|
|
|
|
|
|
|
|
Naturally present in |
|||||
|
|
Byproduct |
|
|
|
Removal |
|
1.85 |
|
2020 |
|
|
NO |
76% – 90% |
Step 1 |
||||||||||||
|
[TOC Treated] |
|
|
|
|
|
|
|
|
environment |
|||||||||||||||||
|
|
Precursors - TOC |
|
Ratio |
|
|
|
|
|
|
|
|
|
|
|
|
|
|
|
|
|||||||
|
(removal ratio) |
|
|
|
|
|
|
|
|
|
|
|
|
|
|
|
|
|
|
|
|
||||||
|
|
|
|
|
|
|
|
|
|
|
|
|
|
|
|
|
|
|
|
|
|
|
|
|
|
|
|
|
|
|
|
|
|
|
|
|
|
|
|
|
|
|
|
|
|
|
|
|
|
|
|
|
|
14 |
|
Cape Fear Public Utility Authority 2020 Drinking Water Quality Results
Disinfection Byproduct Compliance
Some people who drink water containing trihalomethanes (TTHM) in excess of the MCL over many years may ex- perience problems with their liver, kidneys, or central nervous systems, and may have an increased risk of getting cancer. Some people who drink water containing haloacetic acids (HAA5) in excess of the MCL over many years may have an increased risk of getting cancer.
Disinfection |
Your Water |
Date |
MCL |
Range |
MCL |
Likely Source |
|
Byproduct |
(LRAA) |
Sampled |
Violation |
Low - High* |
of Contamination |
||
|
|||||||
TTHM (ppb) |
39.1 |
2020 |
NO |
N/A |
80 |
Byproduct of drinking |
|
water disinfection |
|||||||
|
|
|
|
|
|
||
B01 |
28.0 |
2020 |
NO |
16.2 – 23.7 |
80 |
|
|
|
|
|
|
|
|
|
|
B02 |
26.1 |
2020 |
NO |
14.7 – 24.4 |
80 |
|
|
|
|
|
|
|
|
|
|
B03 |
29.7 |
2020 |
NO |
14.6 – 25.1 |
80 |
|
|
|
|
|
|
|
|
|
|
B04 |
27.7 |
2020 |
NO |
14.6 – 29.4 |
80 |
|
|
|
|
|
|
|
|
|
|
B05 |
28.1 |
2020 |
NO |
15.7 – 28.8 |
80 |
|
|
|
|
|
|
|
|
|
|
B06 |
33.3 |
2020 |
NO |
18.3 – 29.6 |
80 |
|
|
|
|
|
|
|
|
|
|
B07 |
39.1 |
2020 |
NO |
21.9 – 44.8 |
80 |
|
|
|
|
|
|
|
|
|
|
B08 |
30.5 |
2020 |
NO |
14.6 – 28.5 |
80 |
|
|
|
|
|
|
|
|
|
|
HAA5 (ppb) |
17.6 |
2020 |
NO |
N/A |
60 |
Byproduct of drinking |
|
water disinfection |
|||||||
|
|
|
|
|
|
||
B01 |
11.1 |
2020 |
NO |
4.8 – 15.7 |
60 |
|
|
|
|
|
|
|
|
|
|
B02 |
11.8 |
2020 |
NO |
4.2 – 17.7 |
60 |
|
|
|
|
|
|
|
|
|
|
B03 |
12.1 |
2020 |
NO |
3.5 – 16.1 |
60 |
|
|
|
|
|
|
|
|
|
|
B04 |
11.9 |
2020 |
NO |
3.6 – 19.7 |
60 |
|
|
|
|
|
|
|
|
|
|
B05 |
10.0 |
2020 |
NO |
3.3 – 16.4 |
60 |
|
|
|
|
|
|
|
|
|
|
B06 |
14.4 |
2020 |
NO |
4.4 – 20.1 |
60 |
|
|
|
|
|
|
|
|
|
|
B07 |
17.6 |
2020 |
NO |
6.9 – 24.9 |
60 |
|
|
|
|
|
|
|
|
|
|
B08 |
11.8 |
2020 |
NO |
4.1 – 19.2 |
60 |
|
*Range of individual sample results for all compliance samples.
Unregulated Contaminants
The purpose of unregulated contaminant monitoring is to assist EPA in determining the occurrence of unregulated contaminants in drinking water and whether future regulations are warranted.
1,4-Dioxane
|
Contaminant |
Sample Date |
Your Water |
Range |
Health Information |
|
(units) |
|
Average |
Low - High |
|
|
2020 |
0.23 |
|
EPA established a |
|
|
|||||
|
(ppb) |
||||
15 |
|
|
|
lifetime health advisory of 200 ppb in drinking water |
|
|
|
|
|
||
|
|
|
|
|

www.cfpua.org | @CFPUA
Per- and Polyfluoroalkyl Substances (PFAS)
PFAS are found in a wide range of consumer products that people use daily such as cookware, pizza boxes, and stain repellants. Most people have been exposed to PFAS. Certain PFAS can accumulate and stay in the human body for long periods of time. There is evidence that exposure to PFAS can lead to adverse health outcomes in humans. The
Contaminant |
Sample Date |
Your Water |
Range |
Health Information |
|
(units) |
|
Average |
Low - High |
|
|
GenX (ppt) |
2020 |
7.09 |
3.50 - 12.8 |
NC DHHS health goal is 140 ppt for GenX |
|
|
|
|
|
|
|
PFOS (ppt) |
2020 |
2.34 |
1.06 - 4.57 |
70 ppt EPA Health Advisory for Total |
|
Combined Concentration of PFOA and PFOS |
|||||
|
|
|
|
||
|
|
|
|
|
|
PFOA (ppt) |
2020 |
2.87 |
1.32 – 6.09 |
70 ppt EPA Health Advisory for Total |
|
Combined Concentration of PFOA and PFOS |
|||||
|
|
|
|
||
|
|
|
|
|
|
Byproduct 4 |
2020 |
10.9 |
6.14 – 18.0 |
None Established |
|
(BP4)* |
|||||
|
|
|
|
||
|
|
|
|
|
|
Byproduct 5 |
2020 |
8.93 |
3.72 – 17.5 |
None Established |
|
(BP5)* |
|||||
|
|
|
|
||
|
|
|
|
|
|
2020 |
5.29 |
2.88 – 9.38 |
None Established |
||
|
|
|
|
|
|
PEPA* |
2020 |
2.97 |
1.49 – 5.09 |
None Established |
|
|
|
|
|
|
|
PFPeA |
2020 |
8.04 |
3.72 – 15.6 |
None Established |
|
|
|
|
|
|
|
PFPeS |
2020 |
0.04 |
ND – 0.79 |
None Established |
|
|
|
|
|
|
|
6:2 FTS |
2020 |
0.67 |
ND – 12.2 |
None Established |
|
|
|
|
|
|
|
PFHxA |
2020 |
6.77 |
3.41 – 14.0 |
None Established |
|
|
|
|
|
|
|
PFHxS |
2020 |
1.41 |
ND – 3.28 |
None Established |
|
|
|
|
|
|
|
PFBA |
2020 |
4.99 |
2.92 – 7.39 |
None Established |
|
|
|
|
|
|
|
|
|
|
|
Continued on next page. |
* Results obtained using an analytical standard provided by Chemours; not a certified standard. |
16 |
|
Cape Fear Public Utility Authority 2020 Drinking Water Quality Results
Continued from previous page.
Contaminant |
Sample Date |
Your Water |
Range |
Health Information |
|
(units) |
Average |
Low - High |
|||
|
|
||||
|
|
|
|
|
|
PFBS |
2020 |
2.45 |
1.08 – 4.96 |
None Established |
|
|
|
|
|
|
|
PFHpA |
2020 |
3.07 |
1.70 – 6.06 |
None Established |
|
|
|
|
|
|
|
PFMPA* |
2020 |
8.34 |
ND – 17.8 |
None Established |
|
|
|
|
|
|
|
PFO2HxA* |
2020 |
10.4 |
4.00 – 21.0 |
None Established |
|
|
|
|
|
|
|
PFO3OA* |
2020 |
3.51 |
ND – 7.50 |
None Established |
|
|
|
|
|
|
|
PFO4DA* |
2020 |
0.45 |
ND – 2.11 |
None Established |
|
|
|
|
|
|
|
PFMOAA* |
2020 |
20.3 |
4.81 – 48.2 |
None Established |
|
|
|
|
|
|
|
NVHOS* |
2020 |
0.60 |
ND – 1.77 |
None Established |
|
|
|
|
|
|
|
PFMBA* |
2020 |
2.76 |
ND – 5.44 |
None Established |
|
|
|
|
|
|
* Results obtained using an analytical standard provided by Chemours; not a certified standard.
Additional Monitoring of Other Contaminants
|
|
Contaminant |
Sample Date |
Your Water |
Range |
||
|
|
(units) |
Average |
Low - High |
|||
|
|
|
|||||
|
|
Hardness (ppm) |
2020 |
21 |
17 |
- 28 |
|
|
|
|
|
|
|
|
|
|
|
Alkalinity (ppm) |
2020 |
17 |
14 |
- 22 |
|
|
|
|
|
|
|
|
|
|
|
Conductivity (umhos/cm) |
2020 |
152 |
125 |
- 184 |
|
|
|
|
|
|
|
|
|
|
|
Total Dissolved Solids (ppm) |
2020 |
100 |
83 |
- 121 |
|
|
|
|
|
|
|
|
|
|
|
Chloride (ppm) |
2020 |
10 |
9 |
- 10 |
|
|
|
|
|
|
|
||
|
|
Ortho Phosphate (ppm) |
2020 |
0.79 |
0.70 – 0.89 |
||
|
|
|
|
|
|
||
|
|
Total Phosphate (ppm) |
2020 |
1.49 |
1.22 – 1.87 |
||
|
|
|
|
|
|
|
|
|
|
Chlorate (ppb) |
2020 |
122 |
64 |
- 180 |
|
|
|
|
|
|
|
||
17 |
|
Perchlorate (ppb) |
2020 |
0.07 |
0.06 – 0.10 |
||
|
|
|
|
|
|
|
|
|
|
|
|
|
|
|
|

Source Water Assessment Program (SWAP)
www.cfpua.org | @CFPUA
As part of the Source Water Assessment Program (SWAP), the North Carolina Department of Environmental Quality's Public Water Supply Section conducted assessments for all drinking water sources across North Carolina. The purpose of the assessments was to determine the susceptibility of each drinking water source (well or surface water intake) to Potential Contam- inant Sources (PCSs). The results of the assessment are available in SWAP Assessment Reports that include maps, background information, and a relative susceptibility rating of Higher, Mod- erate or Lower.
The relative susceptibility rating of each source for the Sweeney Water System was determined by combining the contaminant rating (number and location of PCSs within the assessment area) and the inherent vulnerability rating (i.e., characteristics or existing conditions of the well or watershed and its delineated assessment area). The assessment findings are summarized in the table below:
Source
Name
Susceptibility
Rating
SWAP
Report Date
Cape Fear River Kings Bluff |
Moderate |
September 2020 |
|
|
|
Lower Cape Fear Water and Sewer |
Moderate |
September 2020 |
Authority Kings Bluff |
|
|
Queens Point Well #31 |
Moderate |
September 2020 |
|
|
|
Sea Spray Well #34 |
Higher |
September 2020 |
|
|
|
Foxcroft Well #38 |
Moderate |
September 2020 |
|
|
|
Masonboro Forest Well #43 |
Lower |
September 2020 |
|
|
|
Sea Pines Well #44 |
Lower |
September 2020 |
|
|
|
Beacon Woods Well #45 |
Lower |
September 2020 |
|
|
|
The complete SWAP Assessment report for the CFPUA-Wilmington Water System may be viewed on the Web at: www.ncwater.org/?page=600. Note that because SWAP results and reports are periodically updated by the PWS Section, the results available on this web site may differ from the results that were available at the time this report was prepared. If you are unable to access your SWAP report on the web, you may mail a written request for a printed copy to: Source Water Assessment Program – Report Request, 1634 Mail Service Center, Ra- leigh, NC 27699-1634, or email requests to swap@ncdenr.gov. Please indicate the system name and number (CFPUA-Wilmington Water System, PWS ID# 04-65-010) and provide your name, mailing address, and phone number. If you have any questions about the SWAP report, please contact the Source Water Assessment staff at 919-707-9098. It is important to understand that a susceptibility rating of “higher” does not imply poor water quality, only the system’s potential to become contaminated by PCSs in the assessment area.
18

Cape Fear Public Utility Authority 2020 Drinking Water Quality Results
2020 Drinking Water Quality Results – PWS ID# 04-65-232, Richardson Water System
We routinely monitor for over 150 contaminants in your drinking water according to Federal and State laws. The tables below list all the drinking water contaminants that we detected in the last round of sampling for each par- ticular contaminant group. The presence of contaminants does not necessarily indicate that water poses a health risk. Unless otherwise noted, the data presented in this table is from testing done January 1 through December 31, 2020. The EPA and the State allow us to monitor for certain contaminants less than once per year because the concentrations of these contaminants are not expected to vary significantly from year to year. Some of the data, though representative of the water quality, is more than one year old.
Microbiological | Inorganic Contaminants | Disinfection Residuals Summary
E.coli - Fecal coliforms and E.coli are bacteria whose presence indicates that the water may be contaminated with human or animal wastes. Microbes in these wastes can cause
Fecal Indicators (enterococci or coliphage) - Fecal indicators are microbes whose presence indicates that the water may be contaminated with human or animal wastes. Microbes in these wastes can cause
|
Contaminant |
Contaminant |
Reporting |
Your |
Sample |
TT |
MCL/MRDL |
Range |
MCLG/ |
MCL |
Likely Source |
|
(units) |
Type |
Basis |
Water |
Date |
Violation |
Violation |
Low - High |
MRDL |
of Contamination |
|
|
Total coliform |
Microbiological |
|
|
|
|
|
|
|
|
|
|
Contaminants in |
|
N/A |
2020 |
N/A |
N/A |
N/A |
N/A |
TT* |
Naturally present in |
|
|
bacteria |
the Distribution |
|
the environment |
|||||||
|
|
|
|
|
|
|
|
|
|||
|
|
System |
|
|
|
|
|
|
|
|
|
|
|
Microbiological |
Highest Monthly |
|
|
|
|
|
|
|
|
|
E. Coli |
Contaminants in |
0% |
2020 |
N/A |
NO |
N/A |
0 |
** |
Human and animal |
|
|
the Distribution |
Percent of |
fecal waste |
||||||||
|
|
Positive Samples |
|
|
|
|
|
|
|
||
|
|
System |
|
|
|
|
|
|
|
|
|
|
|
|
|
|
|
|
|
|
|
|
Erosion of natural |
|
Fluoride |
|
Highest |
|
2018 |
|
|
|
|
|
deposits; water |
|
Inorganic |
0.2 *** |
|
|
|
|
|
additive that promotes |
|||
|
Compliance |
2019 |
N/A |
NO |
ND – 0.2 |
4 |
4 |
||||
|
(ppm) |
Contaminants |
strong teeth; discharge |
||||||||
|
Result |
|
2020 |
|
|
|
|
|
|||
|
|
|
|
|
|
|
|
|
from fertilizers and |
||
|
|
|
|
|
|
|
|
|
|
|
|
|
|
|
|
|
|
|
|
|
|
|
aluminum factories |
|
|
|
|
|
|
|
|
|
|
|
Discharge of drilling |
|
Barium |
Inorganic |
Highest |
|
2018 |
|
|
|
|
|
wastes; discharge from |
|
Compliance |
0.009 |
2019 |
N/A |
NO |
ND – 0.009 |
2 |
2 |
metal refineries; |
||
|
(ppm) |
Contaminants |
|||||||||
|
Result |
|
2020 |
|
|
|
|
|
erosion of natural |
||
|
|
|
|
|
|
|
|
|
|||
|
|
|
|
|
|
|
|
|
|
|
deposits |
|
Chromium |
Inorganic |
Highest |
|
2018 |
|
|
|
|
|
Discharge from steel |
|
Compliance |
0.002 |
2019 |
N/A |
NO |
ND – 0.002 |
100 |
100 |
and pulp mills; erosion |
||
|
(ppb) |
Contaminants |
|||||||||
|
Result |
|
2020 |
|
|
|
|
|
of natural deposits |
||
|
|
|
|
|
|
|
|
|
|||
|
|
|
|
|
|
|
|
|
|
|
|
|
Chlorine |
Disinfectant |
Highest Running |
|
|
|
|
|
|
|
Water additive used to |
|
Residuals |
1.46 |
2020 |
N/A |
N/A |
0.51 – 1.93 |
4 |
4 |
|||
|
(ppm) |
Annual Average |
control microbes |
||||||||
|
Summary |
|
|
|
|
|
|
|
|||
|
|
|
|
|
|
|
|
|
|
|
|
|
*TT: If a system collecting 40 or more samples per month finds greater than 5% of monthly samples are positive in one month, an |
||||||||||
|
assessment is required. |
|
|
|
|
|
|
|
|
|
|
19 |
|
|
|
|
|
|
|
|
Continued on next page |
||
|
|
|
|
|
|
|
|
|
|
||
www.cfpua.org | @CFPUA
**Routine and repeat samples are total
- Result indicated is the highest reported naturally occurring fluoride result from an individual source not related to the Richard- son Water Treatment Plant, where Fluoride equipment was down for repair during compliance sampling. The highest result with fluoride equipment on at the plant during 2020 is 0.8 mg/L.
Water Characteristics Contaminants
Secondary Substances, required by the NC Public Water Supply Section, are substances that affect the taste, odor, and/or color of drinking water. These aesthetic substances normally do not have any health effects and normally do not affect the safety of your water.
Contaminant |
Reporting |
Your |
Sample |
Range |
SMCL |
|
(units) |
Basis |
Water |
Date |
Low - High |
||
|
||||||
Iron (ppm) |
Highest |
|
2018 |
|
|
|
0.54 |
2019 |
ND – 0.54 |
0.3 mg/L |
|||
Compliance Result |
||||||
|
|
2020 |
|
|
||
|
|
|
|
|
||
Manganese (ppm) |
Highest |
|
2018 |
|
|
|
0.026 |
2019 |
ND – 0.026 |
0.05 mg/L |
|||
Compliance Result |
||||||
|
|
2020 |
|
|
||
|
|
|
|
|
||
pH (standard units) |
Highest |
|
2018 |
|
|
|
7.7 |
2019 |
7.1 – 7.7 |
6.5 to 8.5 |
|||
Compliance Result |
||||||
|
|
2020 |
|
|
||
|
|
|
|
|
||
Sodium (ppm) |
Highest |
|
2018 |
|
|
|
32 |
2019 |
13 – 32 |
N/A |
|||
Compliance Result |
||||||
|
|
2020 |
|
|
||
|
|
|
|
|
||
Sulfate (ppm) |
Highest |
|
2018 |
|
|
|
20 |
2019 |
ND – 20 |
250 mg/L |
|||
Compliance Result |
||||||
|
|
2020 |
|
|
||
|
|
|
|
|
||
Radiological Contaminants, Volatile Organic Chemical (VOC) Contaminants |
||||||
Contaminant |
Contaminant |
Your |
Sample |
Range |
MCLG |
MCL |
Likely Source |
|
(units) |
Type |
Water |
Date |
Low - High |
of Contamination |
|||
|
|
|
|
|
|
|
|
|
Combined Radium |
|
|
2017 |
|
|
|
Erosion of natural |
|
Radiological |
1.1 |
2019 |
ND – 1.1 |
0 |
5 |
|||
(pCi/L) |
|
|
2020 |
|
|
|
deposits |
|
|
|
|
|
|
|
|
||
Toluene (ppm) |
VOC |
0.0009 |
2018 |
ND – 0.0009 |
1 |
1 |
Discharge from |
|
2020 |
petroleum factories |
|||||||
|
|
|
|
|
|
|||
|
|
|
|
|
|
|
|
Lead & Copper
|
|
|
|
|
|
|
|
|
|
Contaminant |
Reporting |
Your |
Sample |
# Sites |
|
Action |
Likely Source |
|
|
(units) |
Basis |
Water |
Date |
Above |
MCLG |
Level |
of Contamination |
|
|
|
|
|
|
AL |
|
|
|
|
|
Copper (ppm) |
90th |
|
|
|
|
|
Corrosion of household |
|
|
0.41 |
2019 |
0 |
1.3 |
1.3 |
plumbing systems; erosion of |
|
|||
percentile |
|
||||||||
|
|
|
|
|
|
|
natural deposits |
|
|
Lead (ppb) |
90th |
|
|
|
|
|
Corrosion of household |
|
|
6 |
2019 |
1 |
0 |
15 |
plumbing systems; erosion of |
|
|||
percentile |
|
||||||||
|
|
|
|
|
|
natural deposits |
|
|
|
|
|
|
|
|
|
|
|
|
|
|
|
|
|
|
|
|
|
20 |
|
Cape Fear Public Utility Authority 2020 Drinking Water Quality Results
Disinfection Byproduct Compliance
Some people who drink water containing trihalomethanes (TTHM) in excess of the MCL over many years may ex- perience problems with their liver, kidneys, or central nervous systems, and may have an increased risk of getting cancer.
Some people who drink water containing haloacetic acids (HAA5) in excess of the MCL over many years may have an increased risk of getting cancer.
Disinfection |
Your Water |
Date |
MCL |
Range |
MCL |
Likely Source |
|
Byproduct |
(LRAA) |
Sampled |
Violation |
Low - High* |
of Contamination |
||
|
|||||||
|
|
|
|
|
|
|
|
TTHM (ppb) |
50.8 |
2020 |
NO |
30.3 – 50.8 |
80 |
Byproduct of drinking |
|
water disinfection |
|||||||
|
|
|
|
|
|
||
|
|
|
|
|
|
|
|
B01 |
50.8 |
2020 |
NO |
N/A |
80 |
|
|
|
|
|
|
|
|
|
|
B02 |
30.3 |
2020 |
NO |
N/A |
80 |
|
|
|
|
|
|
|
|
|
|
HAA5 (ppb) |
27.0 |
2020 |
NO |
23.5 – 27.0 |
60 |
Byproduct of drinking |
|
water disinfection |
|||||||
|
|
|
|
|
|
||
|
|
|
|
|
|
|
|
B01 |
27.0 |
2020 |
NO |
N/A |
60 |
|
|
|
|
|
|
|
|
|
|
B02 |
23.5 |
2020 |
NO |
N/A |
60 |
|
|
|
|
|
|
|
|
|
*Range of individual sample results for all compliance samples.
Additional Monitoring of Other Contaminants
Contaminant |
Sample Date |
Your Water |
Range |
||
(units) |
Average |
Low - High |
|||
|
|||||
Hardness (ppm) |
2020 |
45 |
28 |
– 68 |
|
|
|
|
|
|
|
Alkalinity (ppm) |
2020 |
49 |
44 |
– 64 |
|
|
|
|
|
||
Conductivity (umhos/cm) |
2020 |
125 |
75.9 – 163 |
||
|
|
|
|
||
Total Dissolved Solids (ppm) |
2020 |
82.3 |
50.1 – 107 |
||
|
|
|
|
||
Chloride (ppm) |
2020 |
9.5 |
6.1 – 14.0 |
||
|
|
|
|
|
|
Ortho Phosphate (ppm) |
2020 |
1.40 |
1.10 |
– 1.62 |
|
|
|
|
|
|
|
Total Phosphate (ppm) |
2020 |
2.67 |
2.08 |
– 3.73 |
|
|
|
|
|
|
|
Turbidity (NTU) |
2020 |
0.28 |
0.15 |
– 0.65 |
|
21
Unregulated Contaminants |
www.cfpua.org | @CFPUA |
|
The purpose of unregulated contaminant monitoring is to assist EPA in determining the occurrence of unregulated contaminants in drinking water and whether future regulations are warranted.
Per- and Polyfluoroalkyl Substances (PFAS)
Contaminant
(units)
Sample Date
Your Water
Average
Range
Low - High
Health Information
PFMPA* (ppt)
2020
2.38
ND – 4.75
None Established
* Results obtained using an analytical standard provided by Chemours; not a certified standard.
Fourth Unregulated Contaminant Monitoring Rule (UCMR4) Contaminants
The 1996 Safe Drinking Water Act (SDWA) amendments require that once every five years EPA issue a new list of no more than 30 unregulated contaminants to be monitored by public water systems.
The fourth Unregulated Contaminant Monitoring Rule (UCMR 4) was published in the Federal Register on De- cember 20, 2016. UCMR 4 requires monitoring for 30 chemical contaminants between 2018 and 2020 using analytical methods developed by EPA and consensus organizations. This monitoring provides a basis for future regulatory actions to protect public health.
Contaminant |
Sample Date |
Your Water |
Range |
||
(units) |
Average |
Low - High |
|||
|
|||||
|
|
|
|
|
|
Bromochloroacetic acid (ppb) |
2020 |
2.82 |
2.57 |
– 3.06 |
|
|
|
|
|
|
|
Bromodichloroacetic acid (ppb) |
2020 |
3.19 |
3.03 |
– 3.35 |
|
|
|
|
|
|
|
Chlorodibromoacetic acid (ppb) |
2020 |
1.36 |
1.33 |
– 1.39 |
|
|
|
|
|
|
|
Dibromoacetic acid [HAA5] (ppb) |
2020 |
0.960 |
0.931 |
– 0.988 |
|
|
|
|
|
|
|
Dichloroacetic acid [HAA5] (ppb) |
2020 |
4.42 |
3.64 |
– 5.19 |
|
|
|
|
|
|
|
Trichloroacetic acid [HAA5] (ppb) |
2020 |
4.57 |
3.95 |
– 5.18 |
|
|
|
|
|
|
|
22

Cape Fear Public Utility Authority 2020 Drinking Water Quality Results
Source Water Assessment Program (SWAP)
As part of the Source Water Assessment Program (SWAP), the North Carolina Department of Environ- mental Quality's Public Water Supply Section conducted assessments for all drinking water sources across North Carolina. The purpose of the assessments was to determine the susceptibility of each drinking water source (well or surface water intake) to Potential Contaminant Sources (PCSs). The results of the assessment are available in SWAP Assessment Reports that include maps, background information, and a relative susceptibility rating of Higher, Moderate or Lower.
The relative susceptibility rating of each source for the Richardson Water System was determined by combining the contaminant rating (number and location of PCSs within the assessment area) and the inherent vulnerability rating (i.e., characteristics or existing conditions of the well or watershed and its delineated assessment area). The assessment findings are summarized in the table below and on the following page:
Source
Name
Susceptibility
Rating
SWAP
Report Date
Elkmont Well #15 |
Moderate |
September 2020 |
|
|
|
Marsh Oaks Well #19 |
Moderate |
September 2020 |
|
|
|
Old Marsh Oaks #2 Well #20 |
Higher |
September 2020 |
|
|
|
Well #28 M |
Higher |
September 2020 |
|
|
|
Well #4 White Road |
Moderate |
September 2020 |
|
|
|
Well A - Castle Hayne |
Higher |
September 2020 |
|
|
|
Well A - Pee Dee |
Higher |
September 2020 |
|
|
|
Well B - Castle Hayne |
Higher |
September 2020 |
|
|
|
Well B - Pee Dee |
Higher |
September 2020 |
|
|
|
Well C - Castle Hayne |
Moderate |
September 2020 |
|
|
|
Well C - Pee Dee |
Moderate |
September 2020 |
|
|
|
Well F - Castle Hayne |
Higher |
September 2020 |
|
|
|
Well F - Pee Dee |
Higher |
September 2020 |
23

www.cfpua.org | @CFPUA
Source
Name
Susceptibility
Rating
SWAP
Report Date
Well G - Castle Hayne |
Moderate |
September 2020 |
|
|
|
Well G - Pee Dee |
Moderate |
September 2020 |
|
|
|
Well H - Castle Hayne |
Moderate |
September 2020 |
|
|
|
Well H - Pee Dee |
Moderate |
September 2020 |
|
|
|
Well I - Castle Hayne |
Lower |
September 2020 |
|
|
|
Well I - Pee Dee |
Lower |
September 2020 |
|
|
|
Well J - Castle Hayne |
Lower |
September 2020 |
|
|
|
Well J - Pee Dee |
Lower |
September 2020 |
|
|
|
Well K - Castle Hayne |
Moderate |
September 2020 |
|
|
|
Well K - Pee Dee |
Moderate |
September 2020 |
|
|
|
Well L - Castle Hayne |
Moderate |
September 2020 |
|
|
|
Well L - Pee Dee |
Moderate |
September 2020 |
|
|
|
Well P - Pee Dee |
Moderate |
September 2020 |
|
|
|
Well Q - Pee Dee |
Higher |
September 2020 |
|
|
|
Well #29 N |
Higher |
September 2020 |
|
|
|
Well #30 O |
Moderate |
September 2020 |
|
|
|
The complete SWAP Assessment report for the CFPUA/NHC Water System may be viewed on the Web at: www.ncwater.org/?page=600. Note that because SWAP results and reports are periodically up- dated by the PWS Section, the results available on this web site may differ from the results that were available at the time this report was prepared. If you are unable to access your SWAP report on the web, you may mail a written request for a printed copy to: Source Water Assessment Program – Re- port Request, 1634 Mail Service Center, Raleigh, NC
gov. Please indicate the system name and number (CFPUA/NHC Water System, PWS ID# 04-65-
-
and provide your name, mailing address and phone number. If you have any questions about the SWAP report, please contact the Source Water Assessment staff at
919-707-9098.
It is important to understand that a susceptibility rating of “higher” does not imply poor water quality, only the system’s potential to become contaminated by PCSs in the assessment area.
24

Cape Fear Public Utility Authority 2020 Drinking Water Quality Results
2020 Drinking Water Quality Results – PWS ID# 04-65-137, Monterey Heights Water System
We routinely monitor for over 150 contaminants in your drinking water according to Federal and State laws. The tables below list all the drinking water contaminants that we detected in the last round of sampling for each par- ticular contaminant group. The presence of contaminants does not necessarily indicate that water poses a health risk. Unless otherwise noted, the data presented in this table is from testing done January 1 through December 31, 2020. The EPA and the State allow us to monitor for certain contaminants less than once per year because the concentrations of these contaminants are not expected to vary significantly from year to year. Some of the data, though representative of the water quality, is more than one year old.
Microbiological | Inorganic Contaminants | Disinfection Residuals Summary
E.coli - Fecal coliforms and E.coli are bacteria whose presence indicates that the water may be contaminated with human or animal wastes. Microbes in these wastes can cause
Fecal Indicators (enterococci or coliphage) - Fecal indicators are microbes whose presence indicates that the water may be contaminated with human or animal wastes. Microbes in these wastes can cause
Contaminant |
Contaminant |
Reporting |
Your |
Sample |
TT |
MCL/MRDL |
Range |
MCLG/ |
MCL |
Likely Source |
|
(units) |
Type |
Basis |
Water |
Date |
Violation |
Violation |
Low - High |
MRDL |
of Contamination |
||
|
|
|
|
|
|
|
|
|
|
|
|
Total |
Microbiological |
|
|
|
|
|
|
|
|
|
|
Contaminants |
|
|
|
|
|
|
|
|
Naturally present in the |
||
coliform |
in the |
|
N/A |
2020 |
N/A |
N/A |
N/A |
N/A |
TT* |
||
bacteria |
Distribution |
|
|
|
|
|
|
|
|
environment |
|
|
|
|
|
|
|
|
|
|
|||
|
System |
|
|
|
|
|
|
|
|
|
|
|
|
|
|
|
|
|
|
|
|
|
|
|
Microbiological |
|
|
|
|
|
|
|
|
|
|
E. Coli |
Contaminants |
Highest Monthly |
|
|
|
|
|
|
|
Human and animal |
|
in the |
Percent of |
0% |
2020 |
N/A |
NO |
N/A |
0 |
** |
|||
fecal waste |
|||||||||||
|
Distribution |
Positive Samples |
|
|
|
|
|
|
|
||
|
|
|
|
|
|
|
|
|
|||
|
System |
|
|
|
|
|
|
|
|
|
|
|
|
|
|
|
|
|
|
|
|
|
|
|
|
|
|
|
|
|
|
|
|
Erosion of natural |
|
Fluoride |
Inorganic |
Highest |
|
2019 |
|
|
|
|
|
deposits; water additive |
|
|
|
|
|
|
|
that promotes strong |
|||||
Compliance |
0.2 |
N/A |
NO |
ND – 0.2 |
4 |
4 |
|||||
(ppm) |
Contaminants |
2020 |
teeth; discharge from |
||||||||
Result |
|
|
|
|
|
|
|||||
|
|
|
|
|
|
|
|
|
fertilizers and aluminum |
||
|
|
|
|
|
|
|
|
|
|
||
|
|
|
|
|
|
|
|
|
|
factories |
|
|
|
|
|
|
|
|
|
|
|
|
|
Chlorine |
Disinfectant |
Highest Running |
|
|
|
|
|
|
|
Water additive used to |
|
Residuals |
1.13 |
2020 |
N/A |
NO |
0.25 – 1.88 |
4 |
4 |
||||
(ppm) |
Annual Average |
control microbes |
|||||||||
Summary |
|
|
|
|
|
|
|
||||
|
|
|
|
|
|
|
|
|
|
||
|
|
|
|
|
|
|
|
|
|
|
*TT: If a system collecting 40 or more samples per month finds greater than 5% of monthly samples are positive in one month, an assessment is required.
**Routine and repeat samples are total
25
Lead & Copper |
|
|
|
|
|
www.cfpua.org | @CFPUA |
||
|
|
|
|
|
|
|||
|
|
|
|
|
|
|
|
|
Contaminant |
Reporting |
Your |
Sample |
# Sites |
MCLG |
Action |
Likely Source |
|
(units) |
Basis |
Water |
Date |
Above AL |
Level |
of Contamination |
||
|
||||||||
|
|
|
|
|
|
|
|
|
Copper |
90th |
|
|
|
|
|
Corrosion of household plumbing |
|
0.330 |
2019 |
0 |
1.3 |
1.3 |
systems; erosion of natural |
|||
(ppm) |
percentile |
|||||||
|
|
|
|
|
deposits |
|||
|
|
|
|
|
|
|
||
Lead (ppb) |
90th |
|
|
|
|
|
Corrosion of household plumbing |
|
5 |
2019 |
0 |
0 |
15 |
systems; erosion of natural |
|||
percentile |
||||||||
|
|
|
|
|
|
deposits |
||
|
|
|
|
|
|
|
||
Water Characteristics Contaminants
Secondary Substances, required by the NC Public Water Supply Section, are substances that affect the taste, odor, and/or color of drinking water. These aesthetic substances normally do not have any health effects and normally do not affect the safety of your water.
Contaminant |
Reporting |
Your |
Sample |
Range |
MCLG |
SMCL |
|
(units) |
Basis |
Water |
Date |
Low - High |
|||
|
|
||||||
Iron (ppm) |
Highest |
0.11 |
2019 |
ND – 0.11 |
N/A |
0.3 mg/L |
|
Compliance Result |
2020 |
||||||
|
|
|
|
|
|||
|
|
|
|
|
|
|
|
Manganese (ppm) |
Highest |
0.031 |
2019 |
ND – 0.031 |
N/A |
0.05 mg/L |
|
Compliance Result |
2020 |
||||||
|
|
|
|
|
|||
|
|
|
|
|
|
|
|
pH (standard units) |
Highest |
8.1 |
2019 |
7.2 – 8.1 |
N/A |
6.5 to 8.5 |
|
Compliance Result |
2020 |
||||||
|
|
|
|
|
|||
|
|
|
|
|
|
|
|
Sodium (ppm) |
Highest |
21 |
2019 |
7.1 – 21 |
N/A |
N/A |
|
Compliance Result |
2020 |
||||||
|
|
|
|
|
|||
|
|
|
|
|
|
|
Disinfection Byproduct Compliance
Some people who drink water containing trihalomethanes (TTHM) in excess of the MCL over many years may ex- perience problems with their liver, kidneys, or central nervous systems, and may have an increased risk of getting cancer. Some people who drink water containing haloacetic acids (HAA5) in excess of the MCL over many years may have an increased risk of getting cancer.
Disinfection |
Your Water |
Date |
MCL Violation |
Range |
MCL |
Likely Source |
|
Byproduct |
(LRAA) |
Sampled |
Low - High* |
of Contamination |
|||
|
|
||||||
TTHM (ppb) |
50.9 |
2020 |
NO |
42.3 – 50.9 |
80 |
Byproduct of drinking |
|
water disinfection |
|||||||
|
|
|
|
|
|
||
B01 |
50.9 |
2020 |
NO |
NA |
80 |
|
|
|
|
|
|
|
|
|
|
B02 |
42.3 |
2020 |
NO |
NA |
80 |
|
|
|
|
|
|
|
|
|
|
HAA5 (ppb) |
28.0 |
2020 |
NO |
16.4 – 28.0 |
60 |
Byproduct of drinking |
|
water disinfection |
|||||||
|
|
|
|
|
|
||
B01 |
28.0 |
2020 |
NO |
N/A |
60 |
|
|
|
|
|
|
|
|
|
|
B02 |
16.4 |
2020 |
NO |
N/A |
60 |
|
|
|
|
*Range of individual sample results for all compliance samples. |
26 |
|
|
|
|

Cape Fear Public Utility Authority 2020 Drinking Water Quality Results
Unregulated Contaminants
The purpose of unregulated contaminant monitoring is to assist EPA in determining the occurrence of unregulat- ed contaminants in drinking water and whether future regulations are warranted.
Per- and Polyfluoroalkyl Substances (PFAS)
PFAS are found in a wide range of consumer products that people use daily such as cookware, pizza boxes, and stain repellants. Most people have been exposed to PFAS. Certain PFAS can accumulate and stay in the human body for long periods of time. There is evidence that exposure to PFAS can lead to adverse health outcomes in humans. The
Contaminant |
Sample Date |
Your Water |
Range |
Health Information |
|
(units) |
|
Average |
Low - High |
|
|
PFOA (ppt) |
2020 |
0.078 |
ND – 0.781 |
70 ppt EPA Health Advisory for Total |
|
Combined Concentration of PFOA and PFOS |
|||||
|
|
|
|
||
|
|
|
|
|
|
PFO2HxA* |
2020 |
0.153 |
ND – 1.53 |
None Established |
|
(ppt) |
|||||
|
|
|
|
||
|
|
|
|
|
|
PFMOAA* |
2020 |
1.01 |
ND – 10.1 |
None Established |
|
(ppt) |
|||||
|
|
|
|
||
|
|
|
|
|
|
PFMPA* (ppt) |
2020 |
0.478 |
ND – 4.78 |
None Established |
|
|
|
|
|
|
|
PFBS (ppt) |
2020 |
0.529 |
ND – 2.81 |
None Established |
|
|
|
|
|
|
|
PFBA (ppt) |
2020 |
0.196 |
ND – 1.05 |
None Established |
|
|
|
|
|
|
|
PFHxS (ppt) |
2020 |
0.900 |
ND – 5.35 |
None Established |
|
|
|
|
|
|
|
PFHxA (ppt) |
2020 |
0.086 |
ND – 0.858 |
None Established |
|
|
|
|
|
|
|
PFPeS (ppt) |
2020 |
0.258 |
ND – 1.59 |
None Established |
|
|
|
|
|
|
|
PFPeA (ppt) |
2020 |
0.206 |
ND – 1.26 |
None Established |
|
|
|
|
|
|
* Results obtained using an analytical standard provided by Chemours; not a certified standard.
27

www.cfpua.org | @CFPUA
Source Water Assessment Program (SWAP)
As part of the Source Water Assessment Program (SWAP), the North Carolina Department of Environmental Quality's Public Water Supply Section conducted assessments for all drinking water sources across North Carolina. The purpose of the assessments was to determine the susceptibility of each drinking water source (well or surface water intake) to Potential Contam- inant Sources (PCSs). The results of the assessment are available in SWAP Assessment Reports that include maps, background information, and a relative susceptibility rating of Higher, Mod- erate or Lower.
The relative susceptibility rating of each source for the Monterey Heights Water System was determined by combining the contaminant rating (number and location of PCSs within the as- sessment area) and the inherent vulnerability rating (i.e., characteristics or existing conditions of the well or watershed and its delineated assessment area). The assessment findings are summarized in the table below:
Source
Name
Susceptibility
Rating
SWAP
Report Date
Hillside |
Moderate |
September 2020 |
|
|
|
Lords Creek |
Lower |
September 2020 |
|
|
|
Well #1 |
Higher |
September 2020 |
|
|
|
Well #2 |
Moderate |
September 2020 |
|
|
|
Well #3 |
Moderate |
September 2020 |
|
|
|
The complete SWAP Assessment report for CFPUA/Monterey Heights Water System may be viewed on the Web at: www.ncwater.org/?page=600. Note that because SWAP results and reports are periodically updated by the PWS Section, the results available on this web site may differ from the results that were available at the time this CCR was prepared. If you are unable to access your SWAP report on the web, you may mail a written request for a printed copy to: Source Water Assessment Program – Report Request, 1634 Mail Service Center, Raleigh, NC 27699-1634, or email requests to swap@ncdenr.gov. Please indicate the system name and number (CFPUA/Monterey Heights Water System, PWS ID# 04-65-137) and provide your name, mailing address, and phone number. If you have any questions about the SWAP report, please contact the Source Water Assessment staff at 919-707-9098.
It is important to understand that a susceptibility rating of “higher” does not imply poor water quality, only the system’s potential to become contaminated by PCSs in the assessment area. 28
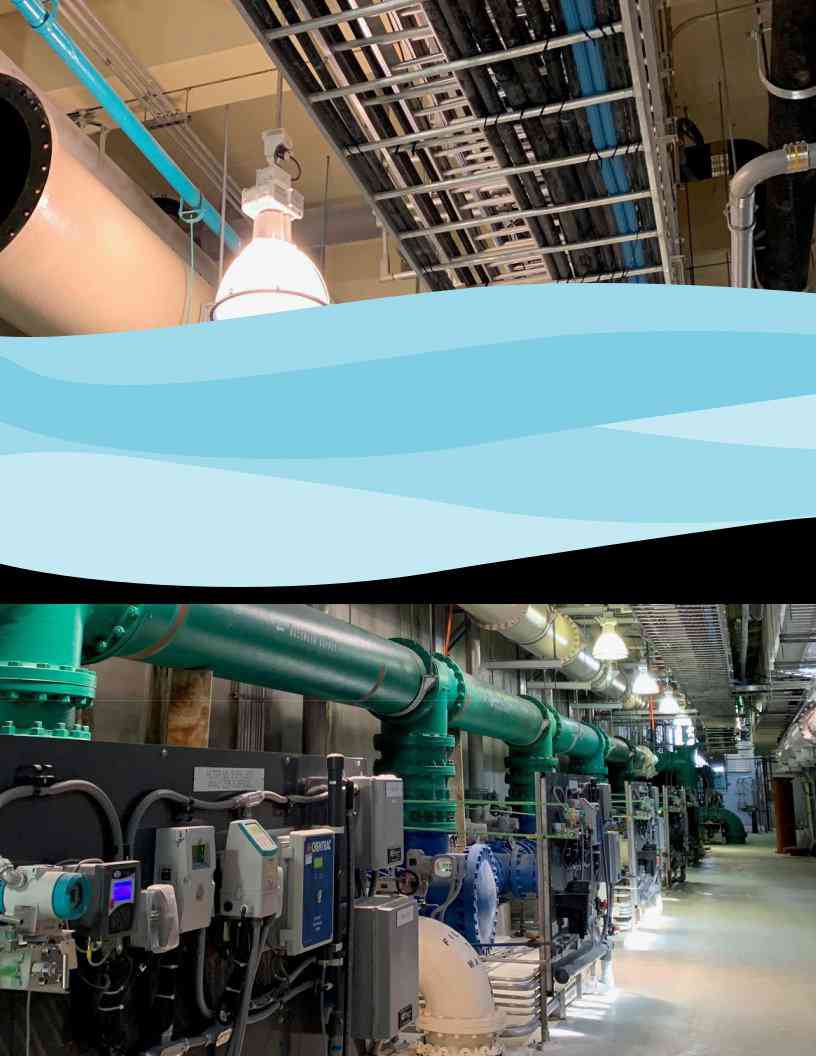
Cape Fear Public Utility Authority
235 Government Center Drive,
Wilmington, NC 28403
910-332-6550 | CFPUA.org
Contaminants
Cape Fear Public Utility Authority - Wilmington
EWG's drinking water quality report shows results of tests conducted by the water utility and provided to the Environmental Working Group by the North Carolina Department of Environment and Natural Resources, as well as information from the U.S. EPA Enforcement and Compliance History database (ECHO). For the latest quarter assessed by the U.S. EPA (January 2019 - March 2019), tap water provided by this water utility was in compliance with federal health-based drinking water standards.
Utility details
- Serves: 128800
- Data available: 2012-2017
- Data Source: Surface water
- Total: 24
Contaminants That Exceed Guidelines
- 1%2C4-Dioxane
- Bromate
- Bromodichloromethane
- Bromoform
- Chloroform
- Chromium (hexavalent)
- Dibromochloromethane
- Dichloroacetic acid
- Perfluoroheptanoic acid (PFHPA)
- Radium%2C combined (-226 & -228)
- Total trihalomethanes (TTHMs)
- Trichloroacetic acid
Other Detected Contaminants
- Bromide
- Chlorate
- Di(2-ethylhexyl) phthalate
- Dibromoacetic acid
- Fluoride
- Haloacetic acids (HAA5)
- Manganese
- Monobromoacetic acid
- Monochloroacetic acid
- Perchlorate
- Strontium
- Vanadium
Reminder
Always take extra precautions, the water may be safe to drink when it leaves the sewage treatment plant but it may pick up pollutants during its way to your tap. We advise that you ask locals or hotel staff about the water quality. Also, note that different cities have different water mineral contents.
Sources and Resources
Sources Cited
Additional Resources
Many people do not realize that tap water in Wilmington, DE is just as safe as bottled water from any location. Unfortunately, this is not always the case. There are chemicals that seep into the ground and contaminate our drinking water supplies. This is a problem that has plagued the country for a long time, yet we seem to expect worse from our tap water. Many of us have purchased expensive home filtration systems, only to find out that they do not remove all of the contaminants that are in our tap water.
Your body can only tell you if it is clean or not. If it has an unpleasant taste, then it probably contains some level of contaminants. You can also test your water yourself by filling up a cup with tap water and throwing it in the garbage can. You will soon notice the difference between the odor and the taste. Many times we simply assume that our tap water tastes bad because we do not like to taste anything else.
So, how do we know that our tap wat