Table of Contents
Can You Drink Tap Water in Carrboro?
Yes, Carrboro's tap water is generally considered safe to drink as Carrboro has no active health based violations of the Safe Drinking Water Act (SDWA) that we are aware of. Other factors such as lead piping in a home, or low levels of pollutants on immunocompromised individuals, should also be considered, however. To find more recent info we might have, you can check out our boil water notice page, the city's water provider website, or Carrboro's local Twitter account.
According the EPA’s ECHO database, from April 30, 2019 to June 30, 2022, Carrboro's water utility, Orange Water & Sewer Authority, had 0 violations of the Safe Drinking Water Act. For more details on the violations, please see our violation history section below. This assessment is based on the Orange Water & Sewer Authority water system, other water systems in the city may have different results.
While tap water that meets the EPA health guidelines generally won’t make you sick to your stomach, it can still contain regulated and unregulated contaminants present in trace amounts that could potentially cause health issues over the long-run. These trace contaminants may also impact immunocompromised and vulnerable individuals.
The EPA is reviewing if it’s current regulations around pollutant levels in tap water are strict enough, and the health dangers posed by unregulated pollutants, like PFAS.
Water Quality Report for Carrboro Tap Water
The most recent publicly available numbers for measured contaminant levels in Carrboro tap water are in its 2020 Water Quality Report. As you can see, there are levels which the EPA considers to be acceptable, but being below the maximum allowable level doesn’t necessarily mean the water is healthy.
Lead in tap water, for example, is currently allowed at up to 15ppb by the EPA, but it has set the ideal goal for lead at zero. This highlights how meeting EPA standards doesn’t necessarily mean local tap water is healthy.
EPA regulations continue to change as it evaluates the long term impacts of chemicals and updates drinking water acceptable levels. The rules around arsenic, as well as, lead and copper are currently being re-evaluated.
There are also a number of "emerging" contaminants that are not currently. For example, PFAS (Per- and polyfluoroalkyl substances), for which the EPA has issued a health advisory. PFAS are called "forever chemicals" since they tend not to break down in the environment or the human body and can accumulate over time.
We recommend looking at the contaminants present in Carrboro's water quality reports, or getting your home's tap water tested to see if you should be filtering your water.
Carrboro Tap Water Safe Drinking Water Act Violation History - Prior 10 Years
Below is a ten year history of violations for the water system named Orange Water & Sewer Authority for Carrboro in North Carolina. For more details please see the "What do these Violations Mean?" section below.
Is there Lead in Carrboro Water?
Based on the EPA’s ECHO Database, 90% of the samples taken from the Carrboro water system, Orange Water & Sewer Authority, between sample start date and sample end date, were at or below, 0.0 mg/L of lead in Carrboro water. This is 0% of the 0.015 mg/L action level. This means 10% of the samples taken from Carrboro contained more lead.
While Carrboro water testing may have found 0.0 mg/L of lead in its water, that does not mean your water source has the same amount. The amount of lead in water in a city can vary greatly from neighborhood to neighborhood, or even building to building. Many buildings, particularly older ones, have lead pipes or service lines which can be a source of contamination. To find out if your home has lead, we recommend getting you water tested.
No amount of lead in water is healthy, only less dangerous. As lead accumulates in our bodies over time, even exposure to relatively small amounts can have negative health effects. For more information, please check out our Lead FAQ page.
Are there PFAS in Carrboro Tap Water?
Currently, testing tap water for PFAS isn’t mandated on a national level. We do have a list of military bases where there have been suspected or confirmed leaks. There appears to be at least one military base - Morrisville AASF #1 - near Carrboro with suspected leaks.
With many potential sources of PFAS in tap water across the US, the best information we currently have about which cities have PFAS in their water is this ewg map, which you can check to see if Carrboro has been evaluated for yet.
Our stance is better safe than sorry, and that it makes sense to try to purify the tap water just in case.
What do these Violations Mean?
Safe Drinking Water Act Violations categories split into two groups, health based, and non-health based. Generally, health based violations are more serious, though non-health based violations can also be cause for concern.
Health Based Violations
- Maximum contaminant levels (MCLs) - maximum allowed contaminant level was exceeded.
- Maximum residual disinfectant levels (MRDLs) - maximum allowed disinfectant level was exceeded.
- Other violations (Other) - the exact required process to reduce the amounts of contaminants in drinking water was not followed.
Non-Health Based Violations
- Monitoring and reporting violations (MR, MON) - failure to conduct the required regular monitoring of drinking water quality, and/or to submit monitoring results on time.
- Public notice violations (Other) - failure to immediately alert consumers if there is a serious problem with their drinking water that may pose a risk to public health.
- Other violations (Other) - miscellaneous violations, such as failure to issue annual consumer confidence reports or maintain required records.
SDWA Table Key
| Field | Description |
|---|---|
| Compliance Period | Dates of the compliance period. |
| Status |
Current status of the violation.
|
| Health-Based? | Whether the violation is health based. |
| Category Code |
The category of violation that is reported.
|
| Code | A full description of violation codes can be accessed in the SDWA_REF_CODE_VALUES (CSV) table. |
| Contaminant Code | A code value that represents a contaminant for which a public water system has incurred a violation of a primary drinking water regulation. |
| Rule Code |
Code for a National Drinking Water rule.
|
| Rule Group Code |
Code that uniquely identifies a rule group.
|
| Rule Family Code |
Code for rule family.
|
For more clarification please visit the EPA's data dictionary.
Carrboro Water - Frequently Asked Questions
| By Mail: | 400 JONES FERRY ROAD ORANGE WATER & SEWER AUTHORITY CARRBORO, NC, 27510 |
Existing customers can login to their Orange Water & Sewer Authority account to pay their Carrboro water bill by clicking here.
If you want to pay your Orange Water & Sewer Authority bill online and haven't made an account yet, you can create an account online. Please click here to create your account to pay your Carrboro water bill.
If you don't want to make an account, or can't remember your account, you can make a one-time payment towards your Carrboro water bill without creating an account using a one time payment portal with your account number and credit or debit card. Click here to make a one time payment.
Moving to a new house or apartment in Carrboro means you will often need to put the water in your name with Orange Water & Sewer Authority. In order to put the water in your name, please click the link to the start service form below. Start service requests for water bills typically take two business days.
Leaving your house or apartment in Carrboro means you will likely need to take your name off of the water bill with Orange Water & Sewer Authority. In order to take your name off the water bill, please click the link to the stop service form below. Stop service for water bills requests typically take two business days.
USER SUBMITTED RATINGS
- Drinking Water Pollution and Inaccessibility
- Water Pollution
- Drinking Water Quality and Accessibility
- Water Quality
The above data is comprised of subjective, user submitted opinions about the water quality and pollution in Carrboro, measured on a scale from 0% (lowest) to 100% (highest).
Related FAQS
Carrboro Water Quality Report (Consumer Confidence Report)
The EPA mandates that towns and cities consistently monitor and test their tap water. They must report their findings in an annual Consumer Confidence Report. Below is the most recent water quality report from Carrboro's Water. If you would like to see the original version of the report, please click here.
ANNUAL
WATER
QUALITY
REPORT
CARD 2020
It’s our pleasure to share our 2020 report card on the quality of your water, how we treat it to make it safe to drink 24/7, and trends in drinking water that we are monitoring locally and nationally.
OWASA is
What follows is an overview of the community’s water sources, laboratory testing results of your water, and how it compares to regulatory standards. In other words, this is our report card to you. It’s a team effort to provide you with safe, dependable drinking water and the information you need to know. Grab a glass of water, get comfortable, and read on! From our team to yours: cheers!

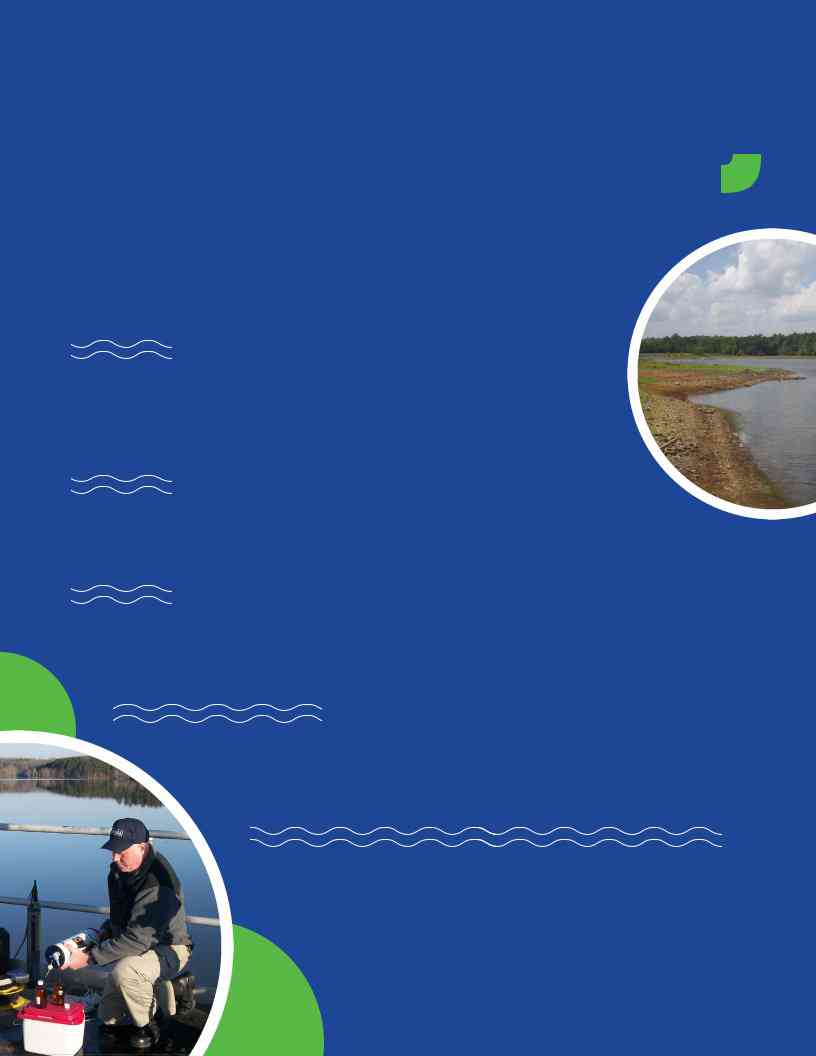
A DAY IN THE LIFE OF OWASA’S WATER TRE ATMENT PL ANT L ABOR ATORY TE AM
OWASA’s Water Treatment Plant Laboratory team plays a key role in making sure that the water being delivered to homes and businesses across the community is safe to drink and meets our customers’ expectations. That takes a lot of work along the way, including taking 95 samples every month from locations across the distribution system.
The Lab Team is made up of the Laboratory Supervisor Katie Harwell and Lab Analysts Robert Herring, Chris Gibbons, and Blake Morgan. While each member of the team has an area of focus, the
Some of the typical tasks at the lab include taking and testing samples at our reservoirs and throughout the service area. Recent investments in laboratory equipment have also allowed OWASA to more closely monitor small environmental changes that affect taste and odor of the drinking water so that we can continue providing customers with tasty drinking water. OWASA’s Lab Team performs many of the required tests themselves at our lab on Jones Ferry Road. However, some testing requires more specialized equipment and those samples are sent
to certified contract labs.
As with most jobs in 2020, the Water Lab Team had to make a lot of adjustments due to the pandemic. By working together as a team, they were able to pivot to ensure that the safety of your drinking water remained top
priority.
CARRBORO-CHAPEL HILL’S
CO M M U N IT Y WATER SYSTEM
WHERE DOES YOUR WATER COME FROM?
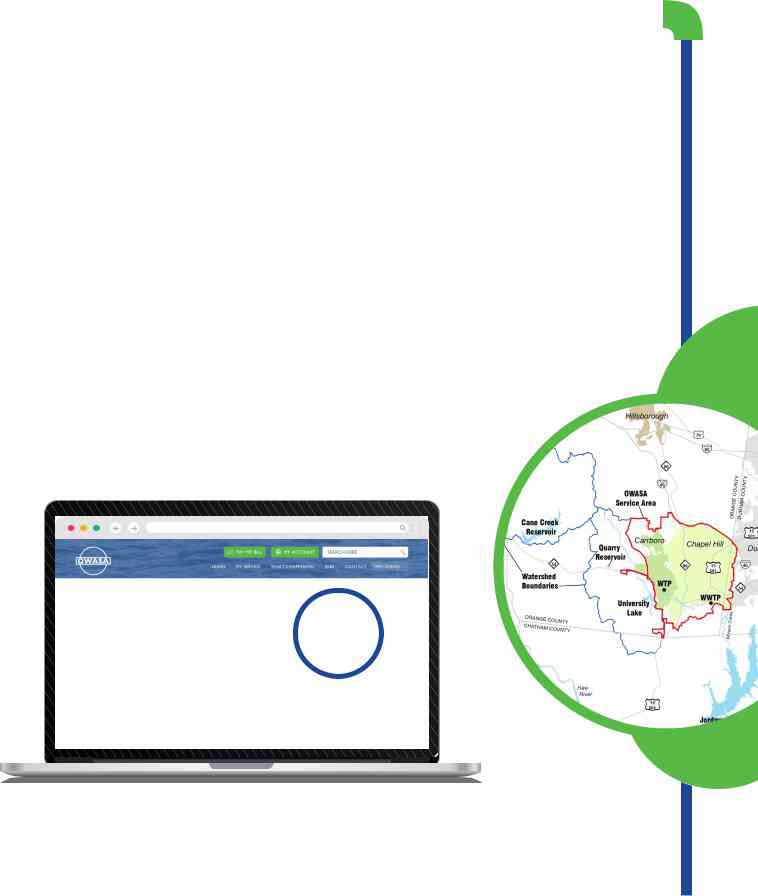
Tranquil University Lake at the edge of Carrboro is one of OWASA’s primary wa- ter sources; the other is Cane Creek Reservoir. The collective storage capacity of these sites is 3.45 billion gallons. OWASA’s engineers, operators, distribution and collections crews, scientists, administrative staff and more work
To ensure reliable access to water for customers long into the future, OWASA has secured two additional water sources: Quarry Reservoir, on the north side of NC Highway 54 (current capacity: 200 million gallons, by 2030: 2.2 billion). The other is Jordan Lake in Chatham County, where the NC Environmental Management Commission has allocated OWASA 5 million gallons of water per day (accessible via water transfers through neighboring utilities). All four surface water sources (University Lake, Cane Creek Reservoir, Quarry Reservoir,
and Jordan Lake) are part of the Cape Fear River watershed.
Water Supply
OWASA’s water supply is stored in Cane Creek Reservoir, University Lake and the Quarry Reservoir. OWASA also has a water supply allocation from Jordan Lake.
Our
Reservoirs Are
100%
Full
With no further rainfall, we have enough water to last:
709 DAYS
Did you know that you can log onto OWASA’s website every day to see information on yesterday’s rainfall, reservoir levels, and water demand? Visit
OWASA SERVICE MAP
2020 VISION:
THE L AST YE AR IN NUMBERS
Your water report card contains a lot of numbers from water sample results. Here are a few more important numbers regarding your water.
50 |
THE NUMBER OF YEARS THAT OWASA’S LONG- |
RANGE WATER SUPPLY PLAN IS FORECASTING |
|
OUR WATER DEMANDS AND WATER SUPPLY. |
|
|
OWASA is currently in the process of updating the community’s Long- |
|
Range Water Supply Plan to ensure that the community has an adequate |
|
supply of water for the next 50 years. |
45 |
THE NUMBER OF PFAS COMPOUNDS THAT |
|
OWASA TESTS FOR IN RAW AND DRINKING |
||
WATER ON A QUARTERLY BASIS. |
||
|
More information is available later in this report. |
|
15 |
THE NUMBER OF YEARS OWASA HAS BEEN AWARDED THE |
|
DIRECTOR’S AWARD FOR THE PARTNERSHIP FOR SAFE WATER . |
||
The Partnership for Safe Water is a national program focused on improving the quality of water |
||
|
delivered to customers by optimizing water system operations and improving performance above |
|
|
and beyond regulatory levels. |
|
9,900 |
THE NUMBER OF LEAK NOTIFICATIONS MADE |
|
BY OWASA’S AGUA VISTA WEB PORTAL . |
||
Water leaks can waste thousands of gallons of water and cost you |
||
money. The Agua Vista web portal provides you an alert when you have a leak, helping to avoid costly water bills and repair bills.
2,223,833,000
THE NUMBER OF GALLONS OF DRINKING WATER
DELIVERED TO THE COMMUNITY OVER THE COURSE OF
THE YEAR .
Due to the
7 days a week, 365 days a year.
CUSTOMER SERVICE:
THE FACE OF OWASA
When you call the OWASA Customer Service Team, it’s like- ly the person on the other end of the line has been serving
OWASA customers for decades.
This dedicated Team – Angie Smith, Denise Battle, Isobel Asare,
Kena Shrader, Miriam Crutchfield, Pamela Whitmore, Rosa Valdez,
Sherry Edwards, and Thomasina Farrow – is often referred to as the face of
OWASA, although it has been more the voice of OWASA over the last year due to
sure that the service quality for customers does not suffer.
To best serve OWASA’s diverse customer base, the Team has undergone training to meet different needs for customers, including being Certified Customer Service Professionals and undergoing training with the Orange County Department on Aging to be certified as a Dementia Friendly Business.
Diversity and Inclusion is a key factor in all of OWASA’s work, and the Customer Service Team takes that charge seriously, providing
OWASA’s Customer Service Team can be reached via email at customerinquiries@owasa.org or by calling (919)
OWASA AFFORDABILIT Y PROGR AM
Access to clean, affordable drinking water and wastewater services is one of the most important requirements for our community’s quality of life. OWASA takes very seriously our responsibility to maintain affordable rates while providing
Through OWASA’s Affordability Program, we work in partnership with social service agencies across our community to provide information and tools to help community members manage and reduce their water and sewer bill. One key partnership is with the
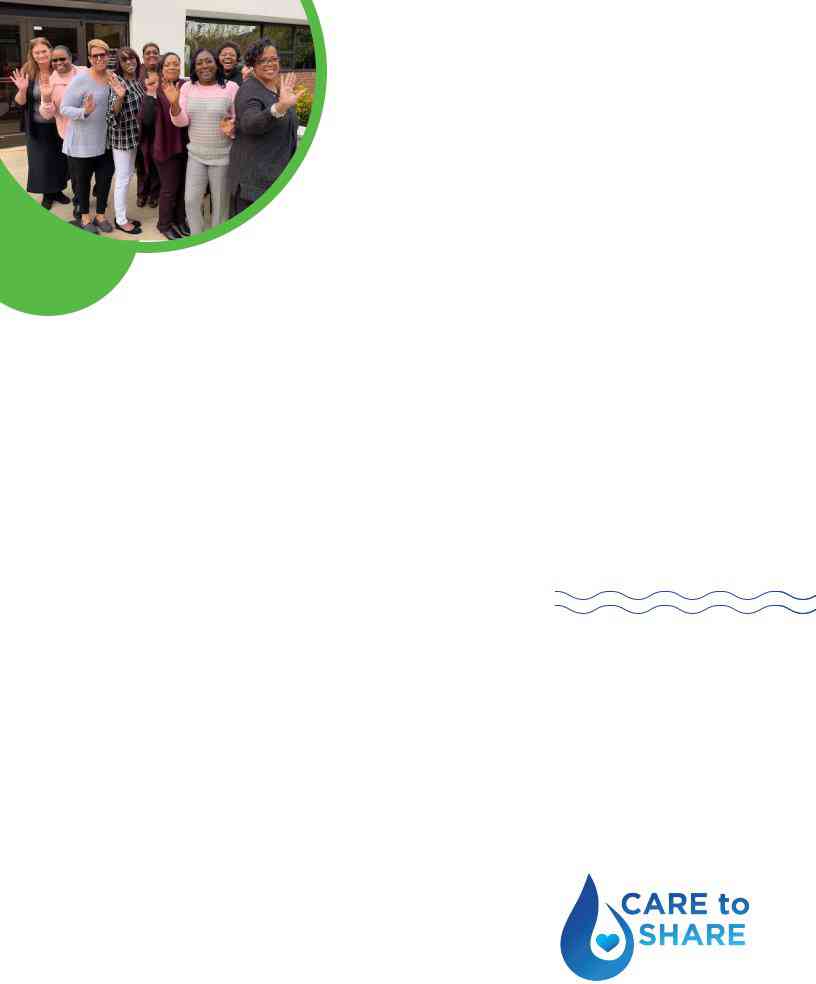
You can help too! Your donation to Care to Share helps to make sure that no one in our community will have to go without water - or scrimp on medications or food to pay their water bill. 100% of donations are used to provide water bill relief to members of our community.
Your gift of just $12.50 added to your water bill each month will help a family in Chapel Hill or Carrboro pay two monthly water bills.
Visit owasa.org to learn how you can donate to or apply for Care to
Share bill assistance.
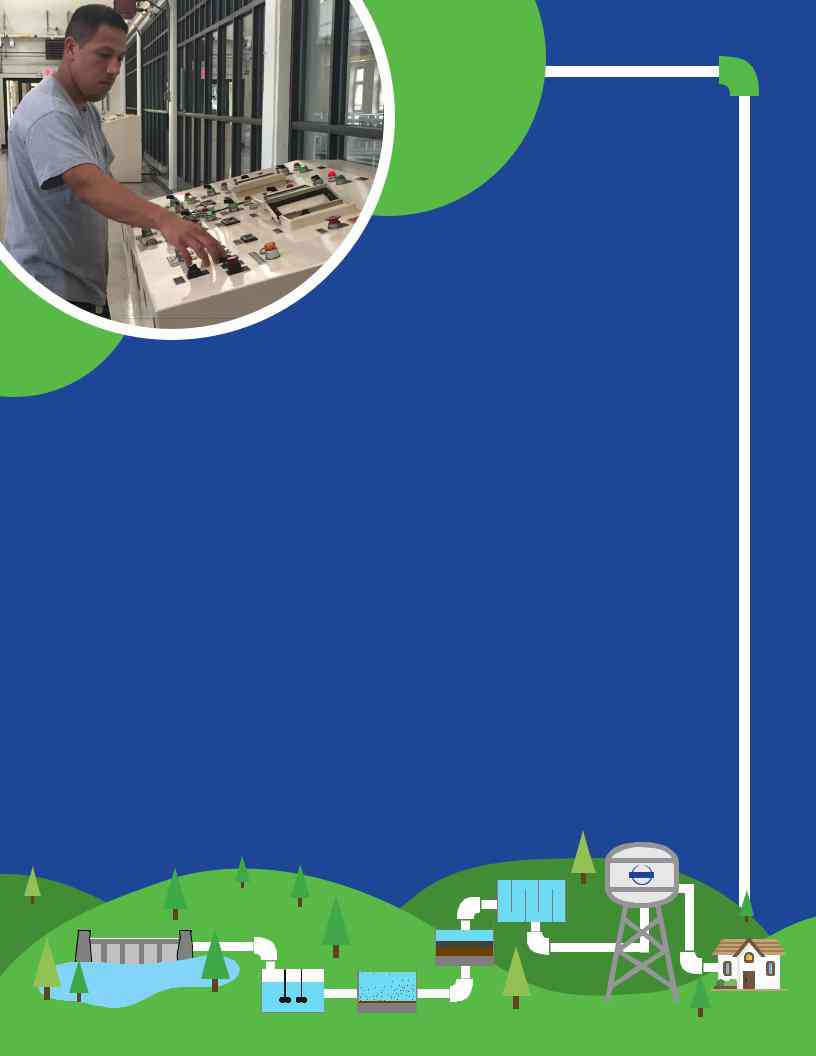
THE WATER
TRE ATMENT
PROCESS
AFTER RAW WATER IS PUMPED
from University Lake and Cane Creek Reservoir to OWASA’s water plant, it goes through a series of treatment processes to remove particles such as dirt, and add substances such as chlorine to mitigate for potentially harmful bacteria. These are some of the substances we monitor for to ensure your water is safe: turbidity,
total organic carbon, disinfectants and their byproducts, fluoride, sulfate, PFAS, and more. View results from all 150 substances that we monitor at owasa.org/ water-health. OWASA met or surpassed all Federal and State standards for drinking water quality in 2020.
WHAT’S IN OWASA’S WATER?
Most of the data presented below are from tests done January 1 through December 31, 2020. There are some exceptions: the EPA and State allow water utilities to monitor some contaminants less than once per year because their concentrations are not expected to vary significantly year-to-year. Where noted, some data is more than one year old. We know the science of water can be complex so we’ve also included a list of drinking water definitions.
Disinfection
Storage
Filtration
MixingClarification

PROTECT THE WATER
What you pour down the drain in your home or the storm drain in the street, what you flush down the toilet, how you fertilize your lawn – these all impact water quality. Waste- water treatment processes, regulated by the State and Federal governments, remove many of these contaminants. But traces of chemicals that get sprayed on the ground or pharmaceuticals flushed down the drain can end up in local waterways.
You can help protect your community’s water in so many ways. For example, by sweep- ing debris that collects in your walkway or driveway (instead of washing it), disposing of chemicals and pharmaceuticals responsibly (not down a drain or toilet), and properly
fertilizing your landscape – if you use too much, it can runoff into a local waterway. Learn more ways to protect, and conserve, water at owasa.org.
BACKFLOW PREVENTION
Protecting our water supply includes properly maintaining back- flow prevention devices that keep wastewater from entering the drinking water supply. These devices are required in locations with irrigation systems, swimming pools, and at many businesses.
Remember - backflow protection devices must be tested annually in order to keep everyone’s drinking water safe!
WHERE IS A BACKFLOW PREVENTION DEVICE
REQUIRED?*
Irrigation
Swimming Pool
Sprinkler System
Commercial Businesses
*Not intended to be an exhaustive list.
WITHOUT A BACKFLOW PREVENTION DEVICE, DANGEROUS
CONTAMINANTS COULD ENTER THE DRINKING WATER SUPPLY.

WHAT IS A CO NTA M I N A NT?
CARRBORO AND CHAPEL HILL’S PRIMARY WATER SOURCES are University Lake and Cane Creek Reservoir. As water travels over the land’s surface or through the ground, it dissolves naturally-occurring minerals (in
some cases, radioactive material) and can pick up substances, or contaminants, from the presence of animals or human activity.
THERE ARE FIVE TYPES OF CONTAMINANTS THAT MAY BE PRESENT IN R AW SOURCE WATER:
MICROBIAL CONTAMINANTS – such as viruses and bacteria
– may come from septic systems, wastewater treatment plants, agricultural livestock operations, and wildlife.
INORGANIC CONTAMINANTS – such as salts and metals – can occur naturally or result from urban stormwater runoff, industrial or domestic wastewater discharges, oil and gas production, mining, or farming.
PESTICIDES AND HERBICIDES may also come from urban stormwater runoff, residential uses, or agriculture.
ORGANIC CHEMICAL contaminants include synthetic and volatile organic chemicals. They are byproducts of industrial processes and petroleum production. They can also come from gas stations, septic systems, and urban stormwater runoff.
RADIOACTIVE CONTAMINANTS can occur naturally or be the result of oil and gas production and mining activities.
REGULATORY GUIDELINES
To ensure tap water is safe to drink, the Environmental Protection Agency (EPA) has regulations limiting the amount of contaminants that can be present in water provided by public systems. Drinking water may reasonably be expected to contain small amounts of some contaminants. In other words, the presence of contaminants does not necessarily indicate that water poses a health risk. More information about contaminants and potential health effects can be obtained by calling the EPA’s Safe Drinking Water Hotline (800-

WHAT’S IN YOUR WATER?
OWASA routinely monitors for over 150 contaminants, or substances, in the community’s drinking water, in accordance with Federal and State laws. The tables below list the
contaminants detected in our most recent round of sampling for each contaminant group. To access results from all 150 substances tested, please visit www.owasa.org/water- health. OWASA met or surpassed all Federal and State standards for drinking water quality in 2020.
TURBIDITY
Turbidity is a measure of the cloudiness of the water. We monitor it because it is a good indicator of the effectiveness of our filtration system. The turbidity rule requires that 95% or more of our monthly samples must be less than or equal to 0.3 NTU. OWASA meets this requirement.
Substance (units)
Turbidity (NTU) - Highest single
turbidity measurement
Turbidity (NTU) - Lowest monthly percentage (%) of samples meeting turbidity limits
Treatment Technique
- Violation Y/N No
No
Your
Water
0.245 NTU
100%
MCLG
N/A
N/A
Treatment Technique (TT)
Violation If:
Turbidity > 1 NTU
Less than 95% of monthly turbidity measurements are < 0.3 NTU
Likely
Source
Soil
runoff
RADIOLOGICAL SUBSTANCES
Radium is a naturally occurring radioactive metal. It occurs at trace levels in virtually all rock, soil, water, plants and animals.
Substance
(units)
Combined ra- dium (pCi/L)
Sample Date
6/14/17
MCL Viola-
tion Y/N
No
Your Water
0.33
Range
Detected
No Range
MCLG
0
MCL
5
Likely Source
Erosion of natural
deposits
TOTAL ORGANIC CARBON (DISINFECTION BYPRODUCT PRECURSOR)
Natural organic matter (usually measured as Total Organic Carbon (TOC)) and inorganic matter (bromide) are disinfection byproduct precursors. All commonly used chemical disinfectants (e.g. chlorine, chlorine dioxide, chloramines and ozone) react with organic matter and/or bromide to varying degrees to form different disinfection byproducts.
|
TT Viola- |
Your Water |
Range Monthly |
|
|
|
|
Substance (units) |
(RAA Removal |
Removal Ratio |
MCLG |
TT |
Likely Source |
||
tion Y/N |
|||||||
|
Ratio) |
Low - High |
|
|
|
||
|
|
|
|
|
|||
Total Organic Carbon |
|
|
|
|
|
Naturally present in |
|
(removal ratio) (TOC)- |
No |
1.86 |
1.64 – 1.96 |
N/A |
TT |
||
the environment |
|||||||
TREATED |
|
|
|
|
|
||
|
|
|
|
|
|
Note: The compliance method used to comply with the disinfectants and disinfection byproducts treatment technique requirements is classified by the State as Step 1 and based on

DISINFECTANTS AND DISINFECTION BYPRODUCTS
Drinking water is disinfected to reduce or eliminate illnesses potentially acquired through drinking water. Disinfection byproducts can form when disinfectants combine with naturally occurring materials found in source water. These regulations limit public exposure to such
byproducts.
DISINFECTANT RESIDUALS SU MMARY
Chloramine, a compound of chlorine and ammonia, is used to disinfect the water throughout the year except in the month of March when we switch to chlorine. This ensures a high level of disinfection. Chloramines and chlorine are both toxic to fish and amphibians such as frogs; if you have an aquarium, please contact a pet supply store for information on how to neutralize chloramines and chlorine. Please also use rubber materials in your plumbing that are
Substance (units) |
Year |
MRDL |
Your Water |
Range Detected |
MRDLG |
MRDL |
Likely Source |
|
Sampled |
Violation Y/N |
(highest RAA) |
Low - High |
|||||
|
|
|
|
|||||
|
|
|
|
|
|
|
|
|
Chlorine (ppm) |
2020 |
No |
1.33 |
0.03 – 2.90 |
4 |
4 |
Water additive used |
|
to control microbes |
||||||||
|
|
|
|
|
|
|
||
|
|
|
|
|
|
|
|
|
Chloramines |
2020 |
No |
2.81 |
0.10 – 3.80 |
4 |
4 |
Water additive used |
|
(ppm) |
to control microbes |
|||||||
|
|
|
|
|
|
|||
|
|
|
|
|
|
|
|
STAGE 2 DISINFECTION BYPRODUCT COMPLIANCE
(BASED UPON LOCATIONAL RUNNING ANNUAL AVER AGE)
|
Sample |
Year |
MCL |
Your Water |
Range Detected |
|
|
|
|
Substance (Units) |
Violation |
MCLG |
MCL |
Likely Source |
|||||
Locations |
Sampled |
(highest LRAA) |
Low - High |
||||||
|
Y/N |
|
|
|
|||||
|
|
|
|
|
|
|
|
||
|
B01 |
|
No |
|
13.3 – 27.2 |
|
|
|
|
|
|
|
|
|
|
|
|
|
|
|
B02 |
|
No |
|
14.1 – 35.3 |
|
|
|
|
|
|
|
|
|
|
|
|
|
|
|
B03 |
|
No |
|
13.6 – 28.6 |
|
|
Byproduct |
|
|
|
|
|
|
|
|
|
||
|
B04 |
|
No |
|
14.9 – 33.3 |
|
|
||
TTHM (ppb) |
2020 |
21.7 |
N/A |
80 |
of drinking |
||||
B05 |
No |
13.8 – 32.3 |
water disin- |
||||||
|
|
|
|
|
|||||
|
|
|
|
|
|
|
|
fection |
|
|
B06 |
|
No |
|
13.5 – 33.4 |
|
|
||
|
|
|
|
|
|
||||
|
|
|
|
|
|
|
|
|
|
|
B07 |
|
No |
|
14.9 – 31.6 |
|
|
|
|
|
|
|
|
|
|
|
|
|
|
|
B08 |
|
No |
|
14.4 – 28.6 |
|
|
|
|
|
|
|
|
|
|
|
|
|
|
|
B01 |
|
No |
|
9.0 – 18.5 |
|
|
|
|
|
|
|
|
|
|
|
|
|
|
|
B02 |
|
No |
|
9.4 – 19.7 |
|
|
|
|
|
|
|
|
|
|
|
|
|
|
|
B03 |
|
No |
|
9.3 – 15.3 |
|
|
Byproduct |
|
|
|
|
|
|
|
|
|
||
HAA5 (ppb) |
B04 |
2020 |
No |
13.1 |
9.2 – 12.4 |
N/A |
60 |
of drinking |
|
B05 |
No |
8.7 – 14.4 |
water disin- |
||||||
|
|
|
|
|
|||||
|
|
|
|
|
|
|
|
fection |
|
|
B06 |
|
No |
|
9.2 – 19.5 |
|
|
||
|
|
|
|
|
|
||||
|
|
|
|
|
|
|
|
|
|
|
B07 |
|
No |
|
8.5 – 20.0 |
|
|
|
|
|
|
|
|
|
|
|
|
|
|
|
B08 |
|
No |
|
9.0 – 16.3 |
|
|
|
|
|
|
|
|
|
|
|
|
|

FLUORIDE (INORGANIC SUBSTANCE)
Fluoride occurs naturally in water. It is also added to drinking water to reduce tooth decay. The fluoride level in our water in 2020 was well below the maximum amount allowed (4 parts per million). The US Public Health Service’s recommended fluoride level is 0.7 parts per million.
Substance |
Sample |
MCL |
Your |
Range |
|
|
|
|
Violation |
Detected |
MCLG |
MCL |
Likely Source |
||||
(units) |
Date |
Water |
||||||
Y/N |
Low - High |
|
|
|
||||
|
|
|
|
|
|
|||
|
|
|
|
|
|
|
|
|
Fluoride |
|
|
|
|
|
|
Erosion of natural deposits; water additive |
|
2020 |
No |
0.67 |
0.28 - 0.79 |
4 |
4 |
which promotes strong teeth; discharge |
||
(ppm) |
||||||||
|
|
|
|
|
|
from fertilizer and aluminum factories |
||
|
|
|
|
|
|
|
*In accordance with Federal requirements, our report card includes a statement that potential fluoride sources include discharge from fertilizer and aluminum factories; however, there are no fertilizer or aluminum factories in the watersheds of University Lake or Cane Creek Reservoir.
SULFATE (INORGANIC SUBSTANCE)
Sulfates occur naturally and are abundant in the environment, generally originating from mineral deposits, soil, and rocks, or the combustion of
Substance |
|
|
Range |
|
|
|
Sample Date |
Your Water |
Detected |
SMCL |
Likely Source |
||
(units) |
||||||
|
|
Low - High |
|
|
||
|
|
|
|
|
||
|
|
|
|
|
|
|
Sulfate (ppm) |
2/3/20 |
56 |
No range |
250 mg/L |
A mineral that occurs naturally in soils |
|
|
|
|
|
|
|
LEAD AND COPPER
The Environmental Protection Agency is in the process of updating the nation’s Lead and Copper Rule (LCR) to introduce new guidelines to reduce lead exposure in drinking water. The rule is still under consideration. OWASA staff are following the process closely, and we will communicate updates regarding the updated LCR.
Lead is not typically found in raw water sources, like OWASA’s main drinking water supplies Cane Creek Reservoir and University Lake. There is no detectable level of lead in the drinking water that we provide to your home. However, it can enter drinking water from corrosion of plumbing materials that contain lead.
OWASA treats our water to prevent lead and other plumbing materials from entering drinking water through corrosion. OWASA’s water mains are not made of lead. Lead can sometimes be found in the service lines that connect homes and businesses to water mains, but OWASA has no known lead service lines. Small sections of pipe called goosenecks were used to connect some lines to the
main; OWASA removed all known lead goosenecks in the 1990s.
Some plumbing components within homes and businesses can contain lead such as brass or

For over 20 years, samples of water leaving OWASA’s Water Treatment Plant have tested below the detectable level for lead of 3 parts per billion (ppb). One update in the new proposed LCR is a lower detection limit, which means samples must be analyzed using a method that can measure lower levels of lead than before. In anticipation of this change, OWASA tested our latest round of regulatory sampling carried out from June to September 2020 at the new threshold; all samples came back below this updated level of 1 ppb. In response to customer requests in 2020, we also tested tap water at seven local homes and businesses. Lead was not detected at any of these sites.
As we review this new update to the LCR, we will be in touch with customers as further updates are necessary. In the meantime, please reach out to our Water Treatment Plant staff (Katie Harwell, Water
Treatment Laboratory Supervisor) with any questions or concerns. If you have any concerns, OWASA offers free lead and copper testing of our water to customers in our service area.
Protecting our community from lead is a responsibility we share with you. Our Water and Health webpage has additional information for reducing your risk of exposure to lead through drinking water. OWASA will be in contact with customers for future updates regarding the LCR.
Substance |
Sample |
Your |
Number of sites |
MCLG |
AL |
|
Likely Source |
|
(units) |
Date |
Water |
found above the AL |
|
||||
|
|
|
|
|||||
Copper (ppm) |
June – Sept. |
0.029 |
0/30 |
1.3 |
AL=1.3 |
Corrosion of household plumbing |
||
(90th percentile) |
2020 |
systems; erosion of natural deposits |
||||||
|
|
|
|
|||||
|
|
|
|
|
|
|
||
Lead (ppb) |
June – Sept. |
0 |
0/30 |
0 |
AL=15 |
Corrosion of household plumbing |
||
(90th percentile) |
2020 |
systems; |
erosion of natural deposits |
|||||
|
|
|
|
|||||
Please note: if present, elevated levels of lead can cause serious health problems, especially for pregnant people and young children. Lead in drinking water is primarily from materials and components associated with service lines and home plumbing. OWASA is responsible for providing
CRYPTOSPORIDIUM
Cryptosporidium is a microbial pathogen found in surface water throughout the U.S. Although filtration removes Cryptosporidium, the most
Ingestion of Cryptosporidium may cause cryptosporidiosis, an abdominal infection. Symptoms of infection include nausea, diarrhea, and abdominal cramps. Cryptosporidium must be ingested to cause disease, and it may be spread through means other than drinking water. Most healthy individuals can overcome the disease within a few weeks. However,
precautions to take to avoid infection.

FOR PEOPLE WITH SPECIAL RISK OF INFECTION
Some people may be more vulnerable to contaminants in drinking water than the general population. Im-
PER- AND POLYFLUOROALKYL SUBSTANCES (PFAS)
Compounds that help prevent grease and stains on materials such as clothing or cookware contain PFAS. These compounds are very persistent in the environment, meaning they don’t break down, and they accumulate over time with exposure.
Protecting public health is our top priority and delivering safe water is our mission. On a quarterly basis, OWASA monitors for 45 PFAS compounds in our reservoir and drinking water. We publish these results on our website after each round of sampling. Low levels of PFOS and PFOA – two of the more- extensively produced and studied of these chemicals – have been detected in OWASA samples; drinking water samples remain well below the Environmental Protection Agency Health Advisory Level of 70 ppt for the combined total of the two compounds.
Research into the health effects of PFAS exposure is relatively recent and ongoing. OWASA is an active and contributing member of this research. You can view our monitoring results below and see the newest available information at owasa.org.
OWASA’s treated drinking water is safe and meets all Federal and State regulations and health advisory levels.
PFAS Substance (units) |
Year |
Your |
Range |
Likely Source |
|
Sampled |
Water |
Detected |
|||
|
|
||||
|
|
|
|
|
|
Perfluorobutanesulfonic acid (PFBS) (ppt) |
|
2.9 |
0 – 4.6 |
|
|
|
|
|
|
|
|
Perfluoroheptanoic acid (PFHpA) (ppt) |
|
5.7 |
2.2 – 8.4 |
|
|
|
|
|
|
|
|
Perfluorohexanesulfonic acid (PFHxS) (ppt) |
|
2.7 |
0 – 6.0 |
||
|
|
|
|
||
Perfluorohexanoic acid (PFHxA) (ppt) |
|
6.2 |
4.0 – 7.8 |
waterproof and stain proof |
|
|
2020 |
|
|
fabrics, nonstick cookware, some |
|
Perfluorooctanesulfonic acid (PFOS) (ppt) |
4.6 |
0 – 10.0 |
|||
|
food packaging materials, and |
||||
|
|
|
|
||
|
|
|
|
||
Perfluorooctanoic acid (PFOA) (ppt) |
|
14.0 |
4.2 – 24.0 |
some fire suppression foams |
|
|
|
|
|
|
|
Perfluoropentanoic acid (PFPeA) (ppt) |
|
5.2 |
4.5 – 5.6 |
|
|
|
|
|
|
|
|
Perfluoropentanesulfonic acid (PFPeS) (ppt) |
|
1.2 |
0 – 2.4 |
|
|
|
|
|
|
|
UCMR TESTING
We are dedicated to protecting your water quality and are committed to advancing science and regulations to ensure that your water is safe. As part of that commitment, OWASA participates in a national testing program for unregulated compounds. These tests are performed by utilities across the country every few years and help inform potential future regulations by the Environmental Protection Agency as part of their Unreg- ulated Contaminant Monitoring Rule (UCMR).

Federal regulators monitor the results of these tests to determine if and how a variety of substances should be regulated. The compounds change with each cycle of testing. The results from previous testing by OWASA as part of this recurring program (UCMR 1, 2, 3, and 4) are available at owasa.org. Testing for the fourth cycle
(UCMR 4) was carried out over four consecutive quarters, which included two sampling events in 2020. Those results are available in the table below:
Substance |
Year |
Your |
Range |
Likely Source |
|
(units) |
Sampled |
Water |
Detected |
||
|
|||||
|
|
|
|
||
Manganese |
2020 |
0.351 |
0 – 0.701 |
tion with other elements and minerals; used in steel production, |
|
(ppb) |
fertilizer, batteries and fireworks; drinking water and wastewater |
||||
|
|
|
|||
|
|
|
|
treatment chemical; essential nutrient |
|
HAA6Br (ppb) |
2020 |
3.77 |
3.04 – 4.28 |
Byproduct of drinking water disinfection |
|
|
|
|
|
|
|
HAA9 (ppb) |
2020 |
14.83 |
12.32 – 18.28 |
Byproduct of drinking water disinfection |
|
|
|
|
|
|
We also tested for the following unregulated compounds as part of UCMR4 and they were not detected:
SOURCE WATER ASSESSMENT PROGRAM (SWAP) RESULTS
The NC Department of Environment Quality’s Source Water Assessment Program (SWAP) conducts assessments for all drinking water sources in the State to determine their susceptibility to Potential Contaminant Sources (PCSs). SWAP assessment reports include background information and a relative susceptibility rating of Higher, Moderate or Lower.
The rating of each raw water source for OWASA (University Lake and Cane Creek Reservoir) was determined by combining the contaminant rating (number and location of PCSs within the assessment area) and the inherent vulnerability rating (characteristics or existing conditions of the watershed and its delineated assessment area). Susceptibility ratings are not indicative of poor water quality, rather, they indicate a system’s potential to become contaminated by PCSs in the assessment area.
Source Name |
Susceptibility Rating |
SWAP Report Date |
|
|
|
Cane Creek Reservoir |
Moderate |
September 2020 |
|
|
|
University Lake |
Moderate |
September 2020 |
|
|
|
The complete SWAP Assessment report for OWASA can be accessed at www.ncwater.org/?page=600 (enter OWASA’s system ID number, 0368010, in the search function). Because SWAP reports are peri- odically updated, the results available online may differ from the results that were available at the time this report card was prepared. If you have questions about SWAP, please contact the SWAP team at
DRINKING WATER
DE F I N ITI O N S
Parts per million (ppm) or Milligrams per liter (mg/L) – One part per million corresponds to one minute in two years or a single penny in $10,000.
Parts per billion (ppb) or Micrograms per liter (µg/L) – One part per billion corresponds to one minute in 2,000 years, or a single penny in $10,000,000.
Parts per trillion (ppt) or Nanograms per liter (nanograms/L) – One part per trillion corresponds to one minute in 2,000,000 years, or a single penny in $10,000,000,000.
Parts per quadrillion (ppq) or Pico- grams per liter (picograms/L) – One part per quadrillion corresponds to one min- ute in 2,000,000,000 years or one penny in $10,000,000,000,000.
Picocuries per liter (pCi/L) – Picocuries per liter is a measure of the radioactivity in water.
Nephelometric Turbidity Unit (NTU) – Nephelometric turbidity unit is a measure of the clarity of water. Turbidity in excess of 5 NTU is just noticeable to the average person.
Action Level (AL) – The concentration of a contaminant which, if exceeded, triggers treatment or other requirements which a water system must follow.
Treatment Technique (TT) – A required process intended to reduce the level of a contami- nant in drinking water.
Maximum Residual Disinfection Lev- el (MRDL) – The highest level of a disinfectant allowed in drinking water. There is convincing evidence that addition of a disinfectant is necessary for control of microbial contaminants.
Maximum Residual Disinfection Level Goal (MRDLG) – The level of a drinking wa- ter disinfectant below which there is no known or expected risk to health. MRDLGs do not reflect the benefits of the use of disinfectants to control microbial contaminants.
Locational Running Annual Average (LRAA) – The average of sample analytical re- sults for samples taken at a particular monitor- ing location during the previous four calendar quarters under the Stage 2 Disinfectants and Disinfection Byproducts Rule.
Maximum Contaminant Level (MCL)
- The highest level of a contaminant that is allowed in drinking water. MCLs are set as close to the MCLGs as feasible using the best available treatment technology.
Maximum Contaminant Level Goal (MCLG) – The level of a contaminant in drinking water below which there is no known or expected risk to health. MCLGs allow for a margin of safety.
Running Annual Average (RAA) Re- moval Ratio – A removal ratio greater than
1.00 indicates the utility has exceeded State requirements for Total Organic
Carbon (TOC) removal.
THIRSTY
FOR WATE R
K N OW LE DG E?
RECREATION
OWASA’s Cane Creek Reservoir and University Lake are great places to come enjoy the environment and get a
WATER GOV E R N A N C E
Be part of the community’s important conversations on water. Everyone is invited to attend OWASA’s Board of Directors meetings where we convene to discuss and decide on plans, policies, fees, standards for water quality and watershed protection, and more. Board meetings are held the second and fourth Thursday of most months. Check owasa.org for the latest information.
FOR MORE INFORMATION AB O U T YOUR WATER
If you have any questions or comments about our drinking water, we invite you to contact our Water Treatment Plant Laboratory Supervisor at
CONTACT OWASA ANY TIME
Orange Water and Sewer Authority Public Water Supply No.: 0368010 400 Jones Ferry Road
Carrboro, NC 27510
twitter @OWASA1
facebook Orange Water and Sewer Authority
EPA SAFE DRINKING
WATER HOTLINE
Call
Contaminants
Orange Water & Sewer Authority
EWG's drinking water quality report shows results of tests conducted by the water utility and provided to the Environmental Working Group by the North Carolina Department of Environment and Natural Resources, as well as information from the U.S. EPA Enforcement and Compliance History database (ECHO). For the latest quarter assessed by the U.S. EPA (January 2019 - March 2019), tap water provided by this water utility was in compliance with federal health-based drinking water standards.
Utility details
- Serves: 83300
- Data available: 2012-2017
- Data Source: Surface water
- Total: 13
Contaminants That Exceed Guidelines
- Bromodichloromethane
- Chlorate
- Chloroform
- Dibromochloromethane
- Dichloroacetic acid
- Perfluorooctanoic acid (PFOA)
- Total trihalomethanes (TTHMs)
- Trichloroacetic acid
Other Detected Contaminants
- Benzo[a]pyrene
- Chromium (hexavalent)
- Fluoride
- Haloacetic acids (HAA5)
- Strontium
Reminder
Always take extra precautions, the water may be safe to drink when it leaves the sewage treatment plant but it may pick up pollutants during its way to your tap. We advise that you ask locals or hotel staff about the water quality. Also, note that different cities have different water mineral contents.