Table of Contents
Can You Drink Tap Water in Lewisville?
Yes, Lewisville's tap water is generally considered safe to drink as Lewisville has no active health based violations of the Safe Drinking Water Act (SDWA) that we are aware of. Other factors such as lead piping in a home, or low levels of pollutants on immunocompromised individuals, should also be considered, however. To find more recent info we might have, you can check out our boil water notice page or the city's water provider website.
According the EPA’s ECHO database, from April 30, 2019 to June 30, 2022, Lewisville's water utility, City of Lewisville, had 0 violations of the Safe Drinking Water Act. For more details on the violations, please see our violation history section below. This assessment is based on the City of Lewisville water system, other water systems in the city may have different results.
While tap water that meets the EPA health guidelines generally won’t make you sick to your stomach, it can still contain regulated and unregulated contaminants present in trace amounts that could potentially cause health issues over the long-run. These trace contaminants may also impact immunocompromised and vulnerable individuals.
The EPA is reviewing if it’s current regulations around pollutant levels in tap water are strict enough, and the health dangers posed by unregulated pollutants, like PFAS.
Water Quality Report for Lewisville Tap Water
The most recent publicly available numbers for measured contaminant levels in Lewisville tap water are in its 2020 Water Quality Report. As you can see, there are levels which the EPA considers to be acceptable, but being below the maximum allowable level doesn’t necessarily mean the water is healthy.
Lead in tap water, for example, is currently allowed at up to 15ppb by the EPA, but it has set the ideal goal for lead at zero. This highlights how meeting EPA standards doesn’t necessarily mean local tap water is healthy.
EPA regulations continue to change as it evaluates the long term impacts of chemicals and updates drinking water acceptable levels. The rules around arsenic, as well as, lead and copper are currently being re-evaluated.
There are also a number of "emerging" contaminants that are not currently. For example, PFAS (Per- and polyfluoroalkyl substances), for which the EPA has issued a health advisory. PFAS are called "forever chemicals" since they tend not to break down in the environment or the human body and can accumulate over time.
We recommend looking at the contaminants present in Lewisville's water quality reports, or getting your home's tap water tested to see if you should be filtering your water.
Lewisville Tap Water Safe Drinking Water Act Violation History - Prior 10 Years
Below is a ten year history of violations for the water system named City of Lewisville for Lewisville in Texas. For more details please see the "What do these Violations Mean?" section below.
Is there Lead in Lewisville Water?
Based on the EPA’s ECHO Database, 90% of the samples taken from the Lewisville water system, City of Lewisville, between sample start date and sample end date, were at or below, 0.002 mg/L of lead in Lewisville water. This is 13.3% of the 0.015 mg/L action level. This means 10% of the samples taken from Lewisville contained more lead.
While Lewisville water testing may have found 0.002 mg/L of lead in its water, that does not mean your water source has the same amount. The amount of lead in water in a city can vary greatly from neighborhood to neighborhood, or even building to building. Many buildings, particularly older ones, have lead pipes or service lines which can be a source of contamination. To find out if your home has lead, we recommend getting you water tested.
No amount of lead in water is healthy, only less dangerous. As lead accumulates in our bodies over time, even exposure to relatively small amounts can have negative health effects. For more information, please check out our Lead FAQ page.
Are there PFAS in Lewisville Tap Water?
Currently, testing tap water for PFAS isn’t mandated on a national level. We do have a list of military bases where there have been suspected or confirmed leaks. There appears to be at least one military base - Dallas NAS - near Lewisville with suspected leaks.
With many potential sources of PFAS in tap water across the US, the best information we currently have about which cities have PFAS in their water is this ewg map, which you can check to see if Lewisville has been evaluated for yet.
Our stance is better safe than sorry, and that it makes sense to try to purify the tap water just in case.
What do these Violations Mean?
Safe Drinking Water Act Violations categories split into two groups, health based, and non-health based. Generally, health based violations are more serious, though non-health based violations can also be cause for concern.
Health Based Violations
- Maximum contaminant levels (MCLs) - maximum allowed contaminant level was exceeded.
- Maximum residual disinfectant levels (MRDLs) - maximum allowed disinfectant level was exceeded.
- Other violations (Other) - the exact required process to reduce the amounts of contaminants in drinking water was not followed.
Non-Health Based Violations
- Monitoring and reporting violations (MR, MON) - failure to conduct the required regular monitoring of drinking water quality, and/or to submit monitoring results on time.
- Public notice violations (Other) - failure to immediately alert consumers if there is a serious problem with their drinking water that may pose a risk to public health.
- Other violations (Other) - miscellaneous violations, such as failure to issue annual consumer confidence reports or maintain required records.
SDWA Table Key
| Field | Description |
|---|---|
| Compliance Period | Dates of the compliance period. |
| Status |
Current status of the violation.
|
| Health-Based? | Whether the violation is health based. |
| Category Code |
The category of violation that is reported.
|
| Code | A full description of violation codes can be accessed in the SDWA_REF_CODE_VALUES (CSV) table. |
| Contaminant Code | A code value that represents a contaminant for which a public water system has incurred a violation of a primary drinking water regulation. |
| Rule Code |
Code for a National Drinking Water rule.
|
| Rule Group Code |
Code that uniquely identifies a rule group.
|
| Rule Family Code |
Code for rule family.
|
For more clarification please visit the EPA's data dictionary.
Lewisville Water - Frequently Asked Questions
| By Mail: | PO BOX 299002 LEWISVILLE, TX, 75029-9002 |
Existing customers can login to their City of Lewisville account to pay their Lewisville water bill by clicking here.
If you want to pay your City of Lewisville bill online and haven't made an account yet, you can create an account online. Please click here to create your account to pay your Lewisville water bill.
If you don't want to make an account, or can't remember your account, you can make a one-time payment towards your Lewisville water bill without creating an account using a one time payment portal with your account number and credit or debit card. Click here to make a one time payment.
Moving to a new house or apartment in Lewisville means you will often need to put the water in your name with City of Lewisville. In order to put the water in your name, please click the link to the start service form below. Start service requests for water bills typically take two business days.
Leaving your house or apartment in Lewisville means you will likely need to take your name off of the water bill with City of Lewisville. In order to take your name off the water bill, please click the link to the stop service form below. Stop service for water bills requests typically take two business days.
USER SUBMITTED RATINGS
- Drinking Water Pollution and Inaccessibility
- Water Pollution
- Drinking Water Quality and Accessibility
- Water Quality
The above data is comprised of subjective, user submitted opinions about the water quality and pollution in Lewisville, measured on a scale from 0% (lowest) to 100% (highest).
Related FAQS
Lewisville Water Quality Report (Consumer Confidence Report)
The EPA mandates that towns and cities consistently monitor and test their tap water. They must report their findings in an annual Consumer Confidence Report. Below is the most recent water quality report from Lewisville's Water. If you would like to see the original version of the report, please click here.
ANNUAL
WATER QUALITY REPORT
Reporting Year 2020
Why You Have Received This Report
This report is a summary of the quality of water that the City of Lewisville provides to our customers. The report contains information and data compiled throughout 2020 from the most recent U.S. Environmental Protection Agency (EPA) required tests. This report also includes information about what our drinking water contained, where it came from, how it was treated, and general sources of contamination. Lewisville’s water system is a “Superior” rated water system, which is the highest rating of the Texas Commission on Environmental Quality.
All Drinking Water May Contain Contaminants
In order to ensure that tap water is safe to drink, the EPA prescribes regulations which limit the amount of certain contaminants in water provided by public water
systems. FDA regulations establish limits for contaminants in bottled water, which must provide the same protection for public health. When drinking water meets federal standards, there may not be any health- based benefits to purchasing bottled water or point of service devices. Drinking water, including bottled water, may reasonably be expected to contain at least small amounts of some contaminants. The presence of contaminants does not necessarily indicate that water poses a health risk. More information about contaminants and potential health effects can be obtained by calling the EPA’s Safe Drinking Water Hotline at 800.426.4791.
Special notice for the elderly,
infants, cancer patients, and people with HIV/AIDS or other immune problems
Certain populations may be more vulnerable to microbial contaminants in drinking water and should seek advice from their physician or health care provider. Infants, some elderly or immunocompromised persons, such as those undergoing chemotherapy for cancer, those who have undergone organ transplants, those who are undergoing treatment with steroids, and those with HIV/AIDS or other immune system disorders can be particularly at risk from infections. Since 1998, the City of
Lewisville has monitored for Cryptosporidium, a microbial parasite that may be commonly found in surface water and may come from animal and human feces in the watershed. Cryptosporidium has never been detected in either untreated or treated drinking water in Lewisville. Additional guidelines on appropriate means to lessen the risk of infection by Cryptosporidium are available from the Safe Drinking Water Hotline at 800.426.4791.
If you have questions about the quality of your water, would like information on source water protection and how you can become involved in the public participation process, please contact the Department of Public Services at 972.219.3504 or visit our website at cityoflewisville.com.
Este informe incluye información importante acerca de su agua portable. Si usted tiene preguntas sobre la calidad de agua, o quisiera más información sobre la protección del origen del agua, y quiere usted participar in el proceso público, porfavo hable al Departamento de Servicios Públicos al 972.219.3504 o vaya a cityoflewisville.com.
Water Quality Report 2020 – page 2
Where Do We Get Our Water?
Our drinking water is pumped from Lewisville Lake, our surface water source, to our Water Treatment Plant for
treatment prior to distibution to consumers. Treated drinking water is also purchased from Dallas Water Utilities.
Sources of drinking water, both tap water and bottled water, include
rivers, lakes, streams, ponds, reservoirs, springs, and wells. As water
travels over the surface of the land or through the ground, it dissolves
naturally occuring minerals and, in some cases, radioactive material,
and can pick up substances resulting from the presence of animals or
from human activity. Contaminants that may be present in source
water before treatment include:
- Microbial contaminants, such as viruses and bacteria, which may come from sewage treatment plants, septic systems, agricultural livestock operations, and wildlife;
- Inorganic contaminants, such as salts and metals, which can be naturally occurring or result from urban stormwater runoff, industrial or domestic wastewater discharges, oil and gas production, mining, or farming;
- Pesticides and herbicides, which may come from a variety of sources such as agriculture, urban stormwater runoff, and residential uses;
-
Organic chemical contaminants, including synthetic and volatile organic chemicals, which are
by-products of industrial processes and petroleum production, and can also come from gas stations, urban stormwater runoff, and septic systems; and - Radioactive contaminants, which can be naturally occurring or the result of oil and gas production and mining activities.
Contaminants may be found in drinking water that may cause taste, color, or odor problems. These types of
problems are not necessarily causes for health concerns. For more information on taste, odor, or color of drinking
water, please contact the Department of Public Services, Utilities Section at 972.219.3504 or visit our website at
cityoflewisville.com.
A Source Water Susceptibility Assessment for our drinking water source is currently being updated by the Texas
Commission on Environmental Quality. This information describes the susceptibility and types of constituents
that may come into contact with your drinking water source based on human activities and natural conditions.
The information contained in the assessment allows us to focus our source water protection strategies. Further
details about sources and source water assessments are available in Drinking Water Watch at
https://dww2.tceq.texas.gov/DWW/ or for more information about your water sources, refer to the Source Water
Assessment Viewer at https://www.tceq.texas.gov/gis/swaview.
Water Quality Report 2020 – page 3

I m p o r t a n t I n f o r m a t i o n f o r U n d e r s t a n d i n g t h e W a t e r Q u a l i t y T a b l e
ACTION LEVEL: The concentration of a contaminant which, if exceeded, triggers treatment or other requirements that a water system must follow.
MCL: The Maximum Contaminant Level is the highest level of contaminant that is allowed in drinking water.
MCLG: The Maximum Contaminant Level Goal is the level of a contaminant in drinking water below which there is no known or expected risk to health. MCLG’s allow for a margin of safety.
MRDL: The Maximum Residual Disinfectant Level is the highest level of a disinfectant allowed in drinking water. There is convincing evidence that the addition of a disinfectant is necessary for control of microbial contaminants.
MRDLG: The Maximum Residual Disinfectant Level Goal is the level of a drinking water disinfectant below which there is no known or expected risk to health. MRDLG’s do not reflect the benefits of the use of disinfectants to control microbial contaminants.
Secondary Constituents
Many constituents such as calcium, sodium, or iron which are often found in drinking water, can cause taste, color, and odor problems. The taste and odor constituents are known as Secondary Constituents because they are not causes for health concerns. Secondary Constituents are regulated by the State of Texas, not the EPA. These constituents are reported in the table to the right to provide further information on your drinking water.
TTHM: Total Trihalomethanes
THAA: Total Haloacetic Acids
MIN: Minimum
MAX: Maximum
AVG: Average
Level 1 Assessment: A study of the water system to identify potential problems and determine, if possible, why total coliform bacteria were found.
Level 2 Assessment: A very detailed study of the water system to identify potential problems and determine, if possible, why an Escherichia coli (E. coli) MCL violation has occurred and/or why total coliform bacteria were found on multiple occasions.
pCi/L:
PPB: Parts per billion or micrograms per liter.
PPM: Parts per million or milligrams per liter.
Constituent |
Average Level |
|
|
Aluminum |
0.011 ppm |
|
|
Bicarbonate |
87.3 ppm |
|
|
Chloride |
23.5 ppm |
|
|
Hardness |
148.0 ppm |
|
|
Manganese |
2.8 ppb |
|
|
Sodium |
22.1 ppm |
|
|
Sulfate |
68.7 ppm |
|
|
Total Alkalinity |
89.1 ppm |
|
|
Lead and Copper Reporting
If present, elevated levels of lead can cause serious health problems, especially for pregnant women and young children. Lead in drinking water is primarily from materials and components associated with service lines and home plumbing. This water supply is responsible for providing high quality drinking water but cannot control the variety of materials used in plumbing components. When your water has been sitting for several hours, you can minimize the potential for lead exposure by flushing your tap for 30 seconds to 2 minutes before using water for drinking or cooking. If you are concerned about lead in your water, you may have your water tested. Information on lead in drinking water, testing methods, and steps you can take to minimize exposure is available from the Safe Drinking Water Hotline, or at epa.gov/safewater/lead.
Water Quality Report 2020 – page 4

Water Quality Table
Inorganic Contaminants
|
Year |
|
|
Contaminant |
|
|
|
Unit |
|
|
|
MCL |
|
|
MCLG |
|
|
Avg. |
|
|
|
Min. |
|
|
Max. |
|
|
Major Sources |
|
|
Violation |
|
||
|
|
|
|
|
|
|
|
|
|
|
|
|
Level |
|
|
|
Level |
|
|
Level |
|
|
|
|
|
|||||||||
|
|
|
|
|
|
|
|
|
|
|
|
|
|
|
|
|
|
|
|
|
|
|
|
|
|
|
|
|
|
|
|
|||
|
|
|
|
|
|
|
|
|
|
|
|
|
|
|
|
|
|
|
|
|
|
|
|
|
|
|
|
|
|
Discharge of drilling wastes; |
|
|
|
|
|
2020 |
|
|
Barium |
|
|
ppm |
|
|
2 |
|
|
|
2 |
|
|
0.032 |
|
|
|
0.025 |
|
|
0.038 |
|
|
discharge from metal refineries; |
|
|
No |
|
|||
|
|
|
|
|
|
|
|
|
|
|
|
|
|
|
|
|
|
|
|
|
|
|
|
|
|
|
|
|
|
erosion of natural deposits. |
|
|
|
|
2020 |
|
|
Bromate* |
|
ppb |
10^ |
|
|
0 |
|
5.0 |
|
<1 |
|
9.0 |
|
|
|
No |
|||||||||||||||
|
|
|
|
|
|
|
|
|
|
disinfection. |
|
|||||||||||||||||||||||
|
|
|
|
|
|
|
|
|
|
|
|
|
|
|
|
|
|
|
|
|
|
|
|
|
|
|
|
|
|
|
|
|
||
|
|
|
|
|
|
|
|
|
|
|
|
|
|
|
|
|
|
|
|
|
|
|
|
|
|
|
|
|
|
|
|
|
|
|
|
|
|
|
|
|
|
|
|
|
|
|
|
|
|
|
|
|
|
|
|
|
|
|
|
|
|
|
|
|
Discharge from steel and pulp |
|
|
|
|
|
2020 |
|
|
Chromium |
|
|
ppm |
|
|
0.1 |
|
|
|
0.1 |
|
|
0.0013 |
|
|
|
<0.001 |
|
|
0.0018 |
|
|
mills; Erosion of natural |
|
|
No |
|
|||
|
|
|
|
|
|
|
|
|
|
|
|
|
|
|
|
|
|
|
|
|
|
|
|
|
|
|
|
|
|
deposits. |
|
|
|
|
|
|
|
|
|
|
|
|
|
|
|
|
|
|
|
|
|
|
|
|
|
|
|
|
|
|
|
|
|
|
Water additive which promotes |
|
|
|
|
|
|
|
|
|
|
|
|
|
|
|
|
|
|
|
|
|
|
|
|
|
|
|
|
|
|
|
|
|
|
strong teeth; erosion of natural |
|
|
|
|
2020 |
|
|
Fluoride |
|
ppm |
4 |
|
|
4 |
|
0.51 |
|
0.20 |
|
0.67 |
|
|
deposits; discharge from |
|
No |
||||||||||||||
|
|
|
|
|
|
|
|
|
|
|
|
|
|
|
|
|
|
|
|
|
|
|
|
|
|
|
|
|
|
fertilizer and aluminum |
|
|
|
|
|
|
|
|
|
|
|
|
|
|
|
|
|
|
|
|
|
|
|
|
|
|
|
|
|
|
|
|
|
|
factories. |
|
|
|
|
|
|
|
|
|
|
|
|
|
|
|
|
|
|
|
|
|
|
|
|
|
|
|
|
|
|
|
|
|
|
Runoff from fertilizer use; |
|
|
|
|
|
2020 |
|
|
Nitrate |
|
|
ppm |
|
|
10 |
|
|
|
10 |
|
|
0.60 |
|
|
|
0.46 |
|
|
0.69 |
|
|
leaking from septic tanks, |
|
|
No |
|
|||
|
|
|
|
|
|
|
|
|
|
|
|
|
|
|
|
|
|
|
sewage; erosion of natural |
|
|
|
||||||||||||
|
|
|
|
|
|
|
|
|
|
|
|
|
|
|
|
|
|
|
|
|
|
|
|
|
|
|
|
|
|
|
|
|
|
|
|
|
|
|
|
|
|
|
|
|
|
|
|
|
|
|
|
|
|
|
|
|
|
|
|
|
|
|
|
|
deposits. |
|
|
|
|
|
|
|
|
|
|
|
|
|
|
|
|
|
|
|
|
|
|
|
|
|
|
|
|
|
|
|
|
|
|
Runoff from fertilizer use; |
|
|
|
|
2020 |
|
|
Nitrite |
|
ppm |
1 |
|
|
1 |
|
<0.01 |
|
<0.01 |
|
<0.01 |
|
|
leaking from septic tanks, |
|
No |
||||||||||||||
|
|
|
|
|
|
|
|
|
|
sewage; erosion of natural |
|
|||||||||||||||||||||||
|
|
|
|
|
|
|
|
|
|
|
|
|
|
|
|
|
|
|
|
|
|
|
|
|
|
|
|
|
|
|
|
|
||
|
|
|
|
|
|
|
|
|
|
|
|
|
|
|
|
|
|
|
|
|
|
|
|
|
|
|
|
|
|
deposits. |
|
|
|
|
|
|
|
|
|
|
|
|
|
|
|
|
|
|
|
|
|
|
|
|
|
|
|
|
|
|
|
|
|
|
Discharge from plastic and |
|
|
|
|
|
2020 |
|
|
Cyanide |
|
|
ppb |
|
|
200 |
|
|
|
200 |
|
|
0.091 |
|
|
|
<0.02 |
|
|
0.149 |
|
|
fertilizer factories; discharge |
|
|
No |
|
|||
|
|
|
|
|
|
|
|
|
|
|
|
|
|
|
|
|
|
|
|
|
|
|
|
|
|
|
|
|
|
from steel/metal factories. |
|
|
|
|
|
|
|
|
|
|
|
|
|
|
|
|
|
|
|
|
|
*Results from Dallas Water Utility’s Annual Report. Not a required test for City of Lewisville. |
|
||||||||||||||||
|
|
|
|
|
|
|
|
^The MCL Bromate is the running annual average of monthly averages, computed quarterly (30 TAC 290.114(b)(5)(C). |
|
|||||||||||||||||||||||||
|
Radioactive Contaminants |
|
|
|
|
|
|
|
|
|
|
|
|
|
|
|
|
|
|
|
|
|
|
|
|
|
|
|
|
|||||
|
2020 |
|
|
Beta Emitters |
|
|
pCi/L* |
|
|
|
50 |
|
|
0 |
|
|
4.0 |
|
|
|
4.0 |
|
|
4.0 |
|
|
Decay of natural and |
|
|
No |
|
|||
|
|
|
|
|
|
|
|
|
|
|
|
|
|
|
|
|
|
|
deposits. |
|
|
|
||||||||||||
|
|
|
|
|
|
|
|
|
|
|
|
|
|
|
|
|
|
|
|
|
|
|
|
|
|
|
|
|
|
|
|
|
|
|
2020 |
|
|
Radon** |
|
pCi/L |
|
|
|
None |
|
|
None |
< 3 |
|
|
< 3 |
|
< 3 |
|
|
Breakdown of naturally |
|
No |
|||||||||||
|
|
|
|
|
|
|
|
|
|
|
|
|
occurring radioactive elements |
|
||||||||||||||||||||
|
|
|
|
|
|
|
|
|
|
|
|
|
|
|
|
|
|
|
|
|
|
|
|
|
|
|
|
|
|
|
|
|
||
|
|
|
|
|
|
|
|
|
|
|
|
|
|
|
|
|
|
|
|
|
|
|
|
|
|
|
|
|
|
* 5 0 p C i / L = 4 m r e m / y r |
|
|||
* * A c c o r d i n g t o t h e E P A , “ R a d o n i s a n a t u r a l l y - o c c u r i n g r a d i o a c t i v e g a s t h a t m a y c a u s e c a n c e r a n d m a y b e f o u n d i n d r i n k i n g w a t e r a n d i n d o o r a i r . S o m e p e o p l e w h o a r e e x p o s e d t o r a d o n i n d r i n k i n g w a t e r m a y h a v e i n c r e a s e d r i s k o f g e t t i n g c a n c e r
o v e r t h e c o u r s e o f t h e i r l i f e t i m e , e s p e c i a l l y l u n g c a n c e r . ” R a d o n h a s n e v e r b e e n d e t e c t e d i n L e w i s v i l l e ’ s d r i n k i n g w a t e r .
Organic Contaminants
|
2020 |
|
|
Atrazine |
|
|
ppb |
|
|
3 |
|
|
3 |
|
|
0.16 |
|
|
0.1 |
|
|
0.2 |
|
|
Runoff from herbicide on row |
|
|
No |
|
|
|
|
|
|
|
|
|
|
|
|
|
|
|
|
|
|
crops. |
|
|
|
|||||||||
|
|
|
|
|
|
|
|
|
|
|
|
|
|
|
|
|
|
|
|
|
|
|
|
|
|
|
|
|
|
|
2020 |
|
|
Simazine |
|
|
ppb |
|
|
4 |
|
|
4 |
|
|
0.09 |
|
|
0.06 |
|
|
0.17 |
|
|
Herbicide runoff. |
|
|
No |
|
|
|
|
|
|
|
|
|
|
|
|
|
|
|
|
|
|
|
|
|
|
|
|
|
|
|
|
|
|
|
|
|
|
|
|
|
|
|
|
|
|
|
|
|
|
|
|
|
|
|
|
|
|
|
|
|
|
|
|
|
Disinfection Byproducts
|
2020 |
|
|
|
|
TTHM’s |
|
|
ppb |
|
|
80 |
|
|
|
No Goal |
|
|
25.5** |
|
|
9.79 |
|
|
39 |
|
|
|
|
|
|
|
No |
|
||||||
|
|
|
|
|
|
|
|
|
|
|
|
|
|
|
|
|
|
|
|
|
|
|
chlorination. |
|
|
|
||||||||||||||
|
|
|
|
|
|
|
|
|
|
|
|
|
|
|
|
|
|
|
|
|
|
|
|
|
|
|
|
|
|
|
|
|
|
|
|
|
|
|
|
|
2020 |
|
|
|
|
THAA5’s |
|
ppb |
60 |
|
|
|
No Goal |
|
20.8** |
|
4.1 |
|
|
29.4 |
|
|
|
|
|
No |
|||||||||||||||
|
|
|
|
|
|
|
|
|
|
|
|
|
|
|
|
chlorination. |
|
|||||||||||||||||||||||
|
|
|
|
|
|
|
|
|
|
|
|
|
|
|
|
|
|
|
|
|
|
|
|
|
|
|
|
|
|
|
|
|
|
|
|
|
|
|
||
|
|
|
|
|
|
|
|
|
|
|
|
|
|
|
|
|
|
|
|
|
|
|
|
|
|
|
|
|
|
|
|
|
|
**LRAA - Locational Running Annual Average |
|
|||||
|
Microbiological Contaminants |
|
|
|
|
|
|
|
|
|
|
|
|
|
|
|
|
|
|
|
|
|
|
|
|
|
|
|
|
|
||||||||||
|
Year |
|
|
|
|
Contaminant |
|
|
|
Unit |
|
|
Highest Monthly % of |
|
|
MCLG |
|
|
Action |
|
|
|
Major Sources |
|
|
Violation |
|
|||||||||||||
|
|
|
|
|
|
|
|
|
|
Positive Samples |
|
|
|
|
|
|
|
Level |
|
|
|
|
|
|
||||||||||||||||
|
|
|
|
|
|
|
|
|
|
|
|
|
|
|
|
|
|
|
|
|
|
|
|
|
|
|
|
|
|
|
||||||||||
|
|
|
|
|
|
|
|
|
|
Found/ |
|
|
|
|
|
|
|
|
|
|
|
|
|
|
|
|
|
|
|
≥5% of |
|
|
|
Naturally present in the |
|
|
|
|
||
|
2020 |
|
|
|
Total Coliform |
|
|
|
|
|
|
|
1.89% |
|
|
|
|
|
|
|
0 |
|
|
monthly |
|
|
|
|
No |
|
||||||||||
|
|
|
|
|
|
|
Not Found |
|
|
|
|
|
|
|
|
|
|
|
|
|
|
|
environment. |
|
|
|
||||||||||||||
|
|
|
|
|
|
|
|
|
|
|
|
|
|
|
|
|
|
|
|
|
|
|
|
|
|
|
|
|
samples |
|
|
|
|
|
|
|||||
|
|
|
|
|
|
|
|
|
|
|
|
|
|
|
|
|
|
|
|
|
|
|
|
|
|
|
|
|
|
|
|
|
|
|
|
|
||||
|
Lead and Copper |
|
|
|
|
|
|
|
|
|
|
|
|
|
|
|
|
|
|
|
|
|
|
|
|
|
|
|
|
|
|
|
|
|||||||
|
Year |
|
|
|
Contaminant |
|
|
|
Unit |
|
|
90th % |
|
|
MCLG |
|
|
Action |
|
|
Sites Exceeding |
|
|
|
|
|
Major Sources |
|
|
Violation |
|
|||||||||
|
|
|
|
|
|
|
|
|
|
|
|
|
Level |
|
|
Action Level |
|
|
|
|
|
|
|
|
||||||||||||||||
|
|
|
|
|
|
|
|
|
|
|
|
|
|
|
|
|
|
|
|
|
|
|
|
|
|
|
|
|
|
|
|
|
||||||||
2018 |
|
|
|
|
Lead |
|
ppb |
2 |
|
|
0 |
|
|
15 |
|
|
0 |
|
|
|
Corrosion of household plumbing |
|
No |
|||||||||||||||||
|
|
|
|
|
|
|
|
|
|
|
|
|
|
systems; erosion of natural deposits |
|
|||||||||||||||||||||||||
|
|
|
|
|
|
|
|
|
|
|
|
|
|
|
|
|
|
|
|
|
|
|
|
|
|
|
|
|
|
|
|
|
|
|
|
|||||
|
|
|
|
|
|
|
|
|
|
|
|
|
|
|
|
|
|
|
|
|
|
|
|
|
|
|
|
|
|
|
|
|
|
|
|
|
||||
2018 |
|
|
|
|
Copper |
|
ppm |
0.54 |
|
|
1.3 |
|
|
1.3 |
|
|
0 |
|
|
|
Corrosion of household plumbing |
|
No |
|||||||||||||||||
|
|
|
|
|
|
|
|
|
|
|
|
|
|
systems; erosion of natural deposits; |
|
|||||||||||||||||||||||||
|
|
|
|
|
|
|
|
|
|
|
|
|
|
|
|
|
|
|
|
|
|
|
|
|
|
|
|
|
|
|
|
|
leaching from wood preservatives. |
|
|
|
||||
|
|
|
|
|
|
|
|
|
|
|
|
|
|
|
|
|
|
|
|
|
|
|
|
|
|
|
|
|
|
|
|
|
|
|
|
|
|
|
|
|
Water Quality Report 2020 – page 5
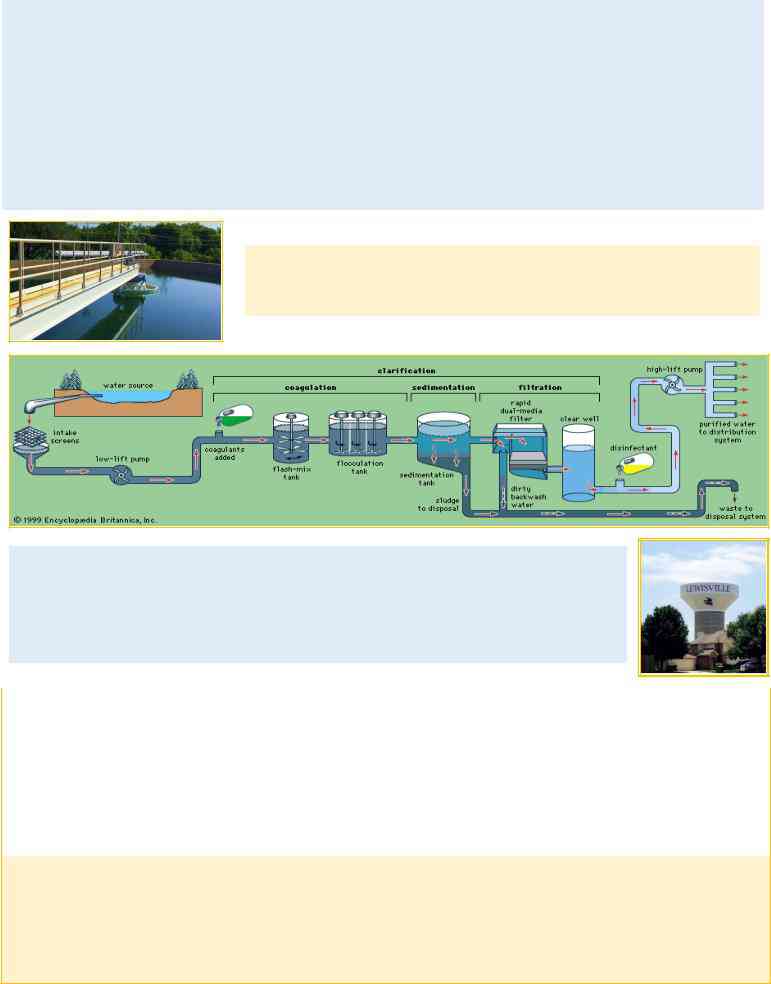
Drinking Water Treatment Process
Drinking water purification is the process of removing contaminants from untreated water through a number of treatment steps to produce drinking water. Substances removed during the process may include particles of sand, minerals such as sulfur and iron, suspended particles of organic matter, microorganisms and viruses, and manmade chemical pollutants.
Untreated water is treated through a series of purification steps. As the untreated water enters the treatment plant, chemicals such as chlorine and ammonia are added to the water. Seasonally, carbon may be added to assist in the control of taste and odor.
Coagulation and flocculation are the processes which remove turbidity or color from the water with the use of chemical coagulants, ferric sulfate and polymer. Lime is added to correct the pH of the water and particles in the water begin to form a floc that settles to the bottom of the clarifier tank and is removed.
Clarified water is separated from fine sediments in the water by filters that remove any remaining suspended particles in the water. Then, treated water is disinfected and stored in water storage tanks that allow time for the chemicals to mix throughout the water.
Drinking water is pumped into the distribution system through a series of pipe networks which distribute water to customers throughout the City. Elevated storage tanks provide additional storage and supply pressure to the distribution system. The City of Lewisville’s Water Production Plant is capable of producing twenty (20) million gallons of treated water daily. Both State and Federal regulations dictate the standards for drinking water quality. These standards require minimum and maximum set points for contaminants and the inclusion of control elements that ensure the production of safe drinking water.
Treatment Requirements
|
Year |
|
|
Contaminant |
|
|
Units |
|
|
MRDL |
|
|
MRDLG |
|
|
Avg |
|
|
Min |
|
|
Max |
|
|
Major Sources |
|
|
Violation |
|
|
|
|
|
|
|
|
|
|
|
|
Level |
|
|
Level |
|
|
Level |
|
|
|
|
|
|||||||
|
|
|
|
|
|
|
|
|
|
|
|
|
|
|
|
|
|
|
|
|
|
|
|
|
|
|
|||
|
2020 |
|
|
Chloramines |
|
|
ppm |
|
|
4 |
|
|
4 |
|
|
3.02 |
|
|
2.74 |
|
|
3.22 |
|
|
Water additive used to control microbes |
|
|
No |
|
|
|
|
|
|
|
|
|
|
|
|
|
|
|
|
|
|
|
|
|
|
|
|
|
|
|
|
|
|
|
|
Year |
|
|
Contaminant |
|
|
Units |
|
|
Action Level |
|
|
Highest Single |
|
|
Lowest Monthly % |
|
|
Major Sources |
|
|
Violation |
|
||||||
|
|
|
|
|
|
|
|
|
Measure |
|
|
Samples Meeting Limits |
|
|
|
|
|
||||||||||||
|
|
|
|
|
|
|
|
|
|
|
|
|
|
|
|
|
|
|
|
|
|
||||||||
|
2020 |
|
|
Turbidity |
|
|
NTU |
|
|
0.3 |
|
|
0.14 |
|
|
|
100.0% |
|
|
|
|
Soil runoff |
|
|
No |
|
|||
|
|
|
|
|
|
|
|
|
|
|
|
|
|
|
|
|
|
|
|
|
|
|
|
|
|
|
|
|
|
|
Year |
|
|
Contaminant |
|
|
Units |
|
|
MCL |
|
|
Avg |
|
|
|
|
Range |
|
|
|
Major Sources |
|
|
Violation |
|
|||
|
|
|
|
|
|
|
|
|
|
|
|
|
|
|
|
|
|
|
|
|
|
|
|
|
|
|
|
|
|
|
2020 |
|
|
TOC Removal |
|
|
|
|
≤2% |
|
|
2.01 |
|
|
|
0.69 – 2.41 |
|
|
|
Total Organic Carbon is naturally present |
|
|
No |
|
|||||
|
|
|
|
|
|
|
Avg. SUVA |
|
|
|
|
|
|
|
|
in the environment |
|
|
|
||||||||||
|
|
|
|
|
|
|
|
|
|
|
|
|
|
|
|
|
|
|
|
|
|
|
|
|
|
|
|
||
NTU: Nephelometric Turbidity Units. Turbidity has no health effects; however, it can interfere with disinfection and provide a medium for microbial growth. Turbidity is a measurement of the cloudiness of the water caused by suspended particles. It is monitored because it is a good indicator of water quality and the effectiveness of our filtration, and the presence of
TOC: Total Organic Carbon has no health effects; however, TOC provides a medium for the formation of disinfection
Water Quality Report 2020 – page 6
Unregulated Contaminants
Unregulated contaminants are those for which the EPA has not established drinking water standards. The purpose of unregulated contaminant monitoring is to assist the EPA in determining the occurrence of unregulated contaminants in drinking water and whether future regulation is warranted. Any unregulated contaminants detected are reported in the following table. For additional information, call the Safe Drinking Water Hotline at 800.426.4791.
|
Year or |
|
|
Contaminant |
|
|
Avg |
|
|
Min |
|
|
Max |
|
|
MCLG |
|
|
Units |
|
|
Source of Contamination |
|
|
Range |
|
|
|
|
Level |
|
|
Level |
|
|
Level |
|
|
|
|
|
|
|
||||
|
|
|
|
|
|
|
|
|
|
|
|
|
|
|
|
|
|
|
|
||||
|
|
|
|
|
|
|
|
|
|
|
|
|
|
|
|
|
|
|
|
|
|
|
|
|
2020 |
|
|
Chloroform |
|
|
11.9 |
|
|
4.0 |
|
|
22.5 |
|
|
70 |
|
|
ppb |
|
|
|
|
|
|
|
|
|
|
|
|
|
|
|
|
|
|
|
|
|
|
|
|
|
|
|
|
|
2020 |
|
|
Bromoform |
|
|
<1 |
|
|
<1 |
|
|
<1 |
|
|
0 |
|
|
ppb |
|
|
|
|
|
|
|
|
|
|
|
|
|
|
|
|
|
|
|
|
|
|
|
|
|
|
|
|
|
2020 |
|
|
|
|
5.6 |
|
|
3.3 |
|
|
11.7 |
|
|
0 |
|
|
ppb |
|
|
|
||
|
|
|
|
|
|
|
|
|
|
|
|
|
|
|
|
|
|
|
|
|
|
|
|
|
2020 |
|
|
|
|
1.8 |
|
|
<1 |
|
|
4.7 |
|
|
60 |
|
|
ppb |
|
|
|
||
|
|
|
|
|
|
|
|
|
|
|
|
|
|
|
|
|
|
|
|
|
|
|
|
UCMR4 Unregulated Contaminants Monitoring Rule 4
The UCMR program was developed in coordination with the Contaminant Candidate List (CCL). The CCL is a list of contaminants that are not regulated by the National Primary Drinking Water Regulations, are known or anticipated to occur at public water systems and may warrant regulation under the Safe Drinking Water Act. Data collected through UCMR is stored in the National Contaminant Occurrence Database (NCOD) to support analysis and review of contaminant occurrence, to guide the CCL selection process and to support the Administrator’s determination of whether to regulate a contaminant in the interest of protecting public health.
|
Year |
|
|
Contaminant |
|
|
Avg |
|
|
Min |
|
|
Max |
|
|
MCL |
|
|
MCLG |
|
|
Units |
|
|
Source of Contamination |
|
|
|
|
|
|
Level |
|
|
Level |
|
|
Level |
|
|
|
|
|
|
|
|
|
||||||
|
|
|
|
|
|
|
|
|
|
|
|
|
|
|
|
|
|
|
|
|
|
|
|
|||
|
|
|
|
|
|
|
|
|
|
|
|
|
|
|
|
|
|
|
|
|
|
|
|
|
|
|
|
2019 |
|
|
HAA5 |
|
|
24.27 |
|
|
0.35 |
|
|
41.79 |
|
|
60.00 |
|
|
N/A |
|
|
ppb |
|
|
|
|
|
|
|
|
|
|
|
|
|
|
|
|
|
|
|
|
|
|
|
|
|
|
|
|
|
|
|
|
2019 |
|
|
HAA6Br |
|
|
7.34 |
|
|
0.00 |
|
|
10.25 |
|
|
N/A |
|
|
N/A |
|
|
ppb |
|
|
|
|
|
|
|
|
|
|
|
|
|
|
|
|
|
|
|
|
|
|
|
|
|
|
|
|
|
|
|
|
2019 |
|
|
HAA9 |
|
|
30.49 |
|
|
0.35 |
|
|
48.55 |
|
|
N/A |
|
|
N/A |
|
|
ppb |
|
|
|
|
|
|
|
|
|
|
|
|
|
|
|
|
|
|
|
|
|
|
|
|
|
|
|
|
|
|
|
|
|
|
|
|
|
|
|
|
|
|
|
|
|
|
|
|
|
|
|
|
|
|
|
|
Naturally occurring element; commercially available in combination with other |
|
|
2019 |
|
|
Manganese |
|
|
0.84 |
|
|
0.40 |
|
|
1.90 |
|
|
50.00 |
|
|
N/A |
|
|
ppb |
|
|
elements and minerals; used in steel production, fertilizer, batteries, and |
|
|
|
|
|
|
|
|
|
|
|
|
|
|
|
|
|
|
|
|
|
|
|
|
|
|
fireworks; drinking water and wastewater treatment chemical; essential nutrient. |
|
|
|
|
|
|
|
|
|
|
|
|
|
|
|
|
|
|
|
|
|
|
|
|
|
|
|
|
The City of Lewisville is also working to conserve and save water. Our total water loss for 2020 was 12%, or 685,068,752 gallons, based on required system evaluation conducted for calendar year 2020. The City's Conservation Plan Target of 140 Gallons per Capita Day (GPCD) was exceeded this past year with a Total GPCD of 142.
Bacteriological Sample Collection and Analysis
The City of Lewisville collects and analyzes a minimum of 100 samples each month throughout the City’s water system. The samples are collected and analyzed following the Texas Commission on Environmental Quality guidelines and methods. These samples are analyzed for total Coliform, an indicator of contamination in the drinking water, as well as many other contaminants. The City of Lewisville has not had any violations of drinking water standards.
Water Quality Report 2020 – page 7
Water Quality Report 2020 – page 8
Water Quality Report 2016 – page 8
Contaminants
City of Lewisville
EWG's drinking water quality report shows results of tests conducted by the water utility and provided to the Environmental Working Group by the Texas Commission on Environmental Quality, as well as information from the U.S. EPA Enforcement and Compliance History database (ECHO). For the latest quarter assessed by the U.S. EPA (January 2019 - March 2019), tap water provided by this water utility was in compliance with federal health-based drinking water standards.
Utility details
- Serves: 99480
- Data available: 2012-2017
- Data Source: Surface water
- Total: 33
Contaminants That Exceed Guidelines
Other Detected Contaminants
Reminder
Always take extra precautions, the water may be safe to drink when it leaves the sewage treatment plant but it may pick up pollutants during its way to your tap. We advise that you ask locals or hotel staff about the water quality. Also, note that different cities have different water mineral contents.