Table of Contents
Can You Drink Tap Water in New Bedford?
Yes, New Bedford's tap water is generally considered safe to drink as New Bedford has no active health based violations of the Safe Drinking Water Act (SDWA) that we are aware of. Other factors such as lead piping in a home, or low levels of pollutants on immunocompromised individuals, should also be considered, however. To find more recent info we might have, you can check out our boil water notice page or the city's water provider website.
According the EPA’s ECHO database, from April 30, 2019 to June 30, 2022, New Bedford's water utility, City of New Bedford Dpi, had 0 violations of the Safe Drinking Water Act. For more details on the violations, please see our violation history section below. This assessment is based on the City of New Bedford Dpi water system, other water systems in the city may have different results.
While tap water that meets the EPA health guidelines generally won’t make you sick to your stomach, it can still contain regulated and unregulated contaminants present in trace amounts that could potentially cause health issues over the long-run. These trace contaminants may also impact immunocompromised and vulnerable individuals.
The EPA is reviewing if it’s current regulations around pollutant levels in tap water are strict enough, and the health dangers posed by unregulated pollutants, like PFAS.
Water Quality Report for New Bedford Tap Water
The most recent publicly available numbers for measured contaminant levels in New Bedford tap water are in its 2020 Water Quality Report. As you can see, there are levels which the EPA considers to be acceptable, but being below the maximum allowable level doesn’t necessarily mean the water is healthy.
Lead in tap water, for example, is currently allowed at up to 15ppb by the EPA, but it has set the ideal goal for lead at zero. This highlights how meeting EPA standards doesn’t necessarily mean local tap water is healthy.
EPA regulations continue to change as it evaluates the long term impacts of chemicals and updates drinking water acceptable levels. The rules around arsenic, as well as, lead and copper are currently being re-evaluated.
There are also a number of "emerging" contaminants that are not currently. For example, PFAS (Per- and polyfluoroalkyl substances), for which the EPA has issued a health advisory. PFAS are called "forever chemicals" since they tend not to break down in the environment or the human body and can accumulate over time.
We recommend looking at the contaminants present in New Bedford's water quality reports, or getting your home's tap water tested to see if you should be filtering your water.
New Bedford Tap Water Safe Drinking Water Act Violation History - Prior 10 Years
Below is a ten year history of violations for the water system named City of New Bedford Dpi for New Bedford in Massachusetts. For more details please see the "What do these Violations Mean?" section below.
Is there Lead in New Bedford Water?
Based on the EPA’s ECHO Database, 90% of the samples taken from the New Bedford water system, City of New Bedford Dpi, between sample start date and sample end date, were at or below, 0.002 mg/L of lead in New Bedford water. This is 13.3% of the 0.015 mg/L action level. This means 10% of the samples taken from New Bedford contained more lead.
While New Bedford water testing may have found 0.002 mg/L of lead in its water, that does not mean your water source has the same amount. The amount of lead in water in a city can vary greatly from neighborhood to neighborhood, or even building to building. Many buildings, particularly older ones, have lead pipes or service lines which can be a source of contamination. To find out if your home has lead, we recommend getting you water tested.
No amount of lead in water is healthy, only less dangerous. As lead accumulates in our bodies over time, even exposure to relatively small amounts can have negative health effects. For more information, please check out our Lead FAQ page.
Are there PFAS in New Bedford Tap Water?
Currently, testing tap water for PFAS isn’t mandated on a national level. We do have a list of military bases where there have been suspected or confirmed leaks. There appears to be at least one military base - Joint Base Cape Cod - near New Bedford with suspected leaks.
With many potential sources of PFAS in tap water across the US, the best information we currently have about which cities have PFAS in their water is this ewg map, which you can check to see if New Bedford has been evaluated for yet.
Our stance is better safe than sorry, and that it makes sense to try to purify the tap water just in case.
What do these Violations Mean?
Safe Drinking Water Act Violations categories split into two groups, health based, and non-health based. Generally, health based violations are more serious, though non-health based violations can also be cause for concern.
Health Based Violations
- Maximum contaminant levels (MCLs) - maximum allowed contaminant level was exceeded.
- Maximum residual disinfectant levels (MRDLs) - maximum allowed disinfectant level was exceeded.
- Other violations (Other) - the exact required process to reduce the amounts of contaminants in drinking water was not followed.
Non-Health Based Violations
- Monitoring and reporting violations (MR, MON) - failure to conduct the required regular monitoring of drinking water quality, and/or to submit monitoring results on time.
- Public notice violations (Other) - failure to immediately alert consumers if there is a serious problem with their drinking water that may pose a risk to public health.
- Other violations (Other) - miscellaneous violations, such as failure to issue annual consumer confidence reports or maintain required records.
SDWA Table Key
| Field | Description |
|---|---|
| Compliance Period | Dates of the compliance period. |
| Status |
Current status of the violation.
|
| Health-Based? | Whether the violation is health based. |
| Category Code |
The category of violation that is reported.
|
| Code | A full description of violation codes can be accessed in the SDWA_REF_CODE_VALUES (CSV) table. |
| Contaminant Code | A code value that represents a contaminant for which a public water system has incurred a violation of a primary drinking water regulation. |
| Rule Code |
Code for a National Drinking Water rule.
|
| Rule Group Code |
Code that uniquely identifies a rule group.
|
| Rule Family Code |
Code for rule family.
|
For more clarification please visit the EPA's data dictionary.
New Bedford Water - Frequently Asked Questions
| By Mail: | 1105 SHAWMUT AVE NEW BEDFORD, MA, 02746 |
Existing customers can login to their City of New Bedford Dpi account to pay their New Bedford water bill by clicking here.
If you want to pay your City of New Bedford Dpi bill online and haven't made an account yet, you can create an account online. Please click here to create your account to pay your New Bedford water bill.
If you don't want to make an account, or can't remember your account, you can make a one-time payment towards your New Bedford water bill without creating an account using a one time payment portal with your account number and credit or debit card. Click here to make a one time payment.
Moving to a new house or apartment in New Bedford means you will often need to put the water in your name with City of New Bedford Dpi. In order to put the water in your name, please click the link to the start service form below. Start service requests for water bills typically take two business days.
Leaving your house or apartment in New Bedford means you will likely need to take your name off of the water bill with City of New Bedford Dpi. In order to take your name off the water bill, please click the link to the stop service form below. Stop service for water bills requests typically take two business days.
The estimated price of bottled water
$1.10 in USD (1.5-liter)
USER SUBMITTED RATINGS
- Drinking Water Pollution and Inaccessibility
- Water Pollution
- Drinking Water Quality and Accessibility
- Water Quality
The above data is comprised of subjective, user submitted opinions about the water quality and pollution in New Bedford, measured on a scale from 0% (lowest) to 100% (highest).
Related FAQS
New Bedford Water Quality Report (Consumer Confidence Report)
The EPA mandates that towns and cities consistently monitor and test their tap water. They must report their findings in an annual Consumer Confidence Report. Below is the most recent water quality report from New Bedford's Water. If you would like to see the original version of the report, please click here.
L E A D A W A R E N E S S :
If present, elevated levels of lead can cause serious health problems, especially for pregnant women and young children. Lead in drinking water is primarily from materials and components associated with service lines and home plumbing. New Bedford DPI is responsible for providing high quality drinking water, but cannot control the variety of materials used in plumbing components. When your water has been sitting for several hours, you can minimize the potential for lead exposure by flushing your tap for 30 seconds to 2 minutes before using cold water for drinking or cooking. If you are concerned about lead in your water, you may wish to have your water tested. Lead testing kits can be purchased at DPI. Information on lead in drinking water, testing methods, and steps you can take to minimize exposure is available from the Safe Drinking Water Hotline
Infants and children who consume water containing lead in excess of the action level could experience delays in their physical or mental development. Children could show slight defects in attention span and learning abilities. Adults who drink this water over many years could develop kidney problems or high blood pressure.
The New Bedford DPI has a lead information website for residents to verify if they have a lead service and obtain information on replacing it. You can verify if you have a lead service and find out more information on reducing your risk of exposure to lead on the City of New Bedford website at http://www.newbedford-
The DPI is now more aggressively replacing lead service lines in house and with the assistance of subcontractors as part of the lead service line replacement program. At the Water Treatment Plant, corrosion control treatment has been optimized to minimize leaching of lead from the piping into the water. Continued sampling and testing for lead is ongoing to monitor the levels in the drinking water. If you are interested in replacing your lead service line, contact the New Bedford DPI at (508)
T H E S O U R C E O F Y O U R W A T E R :
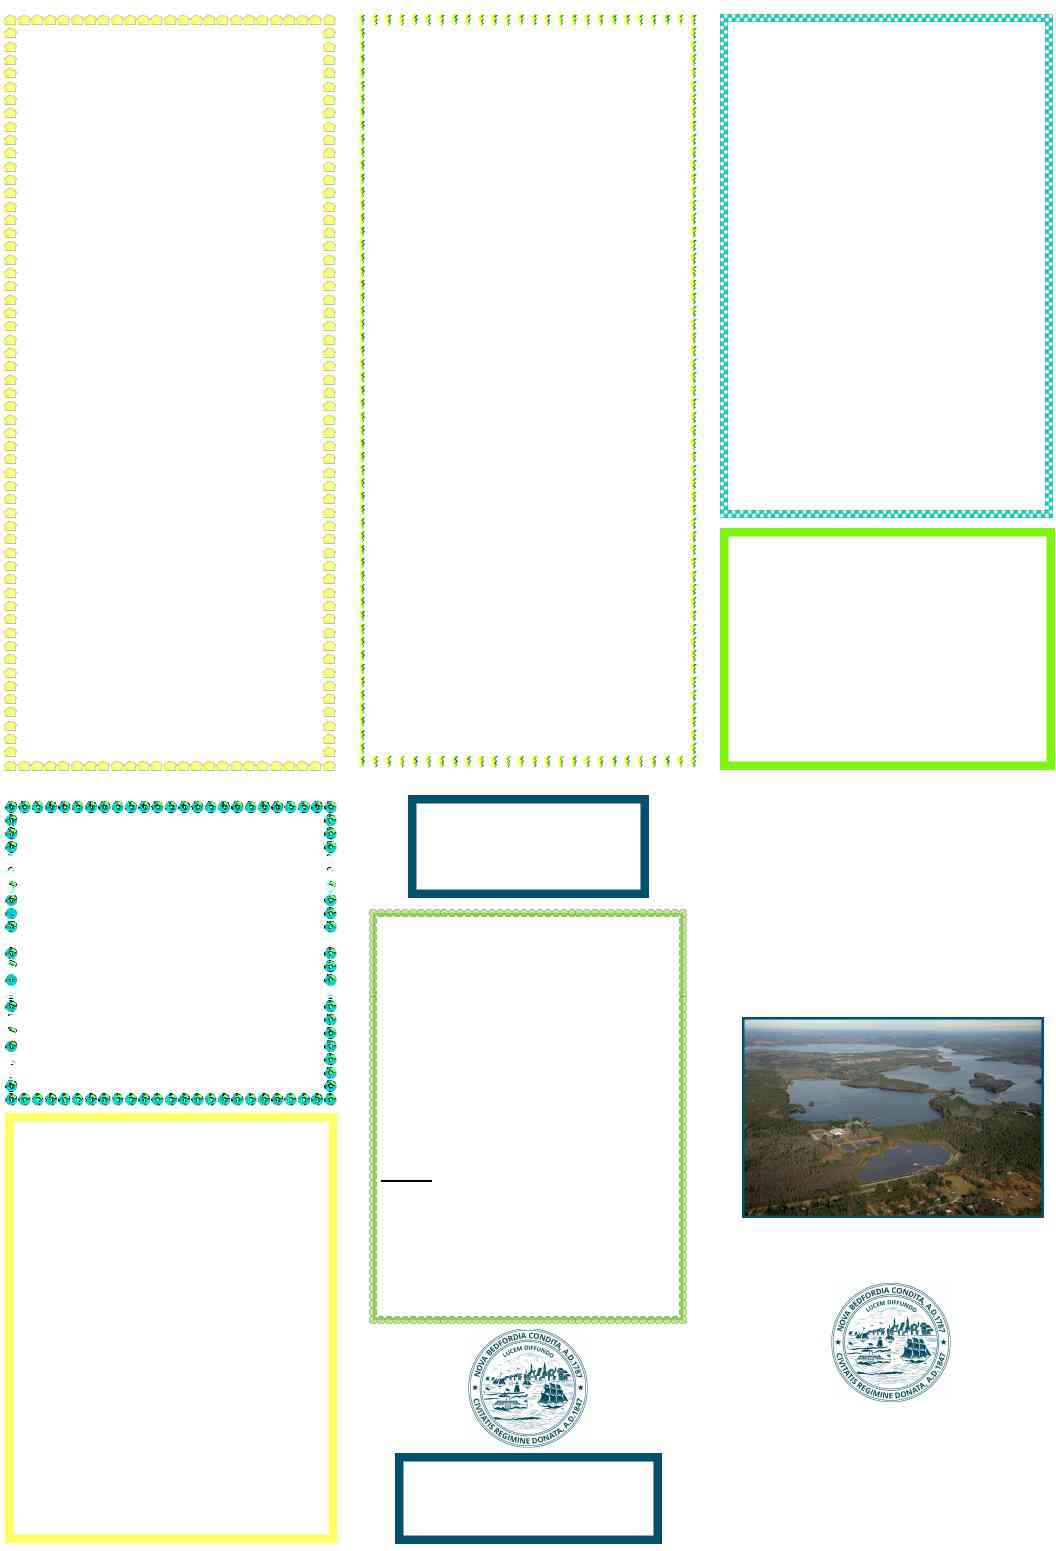
Your water comes from the Assawompsett Pond Complex comprised of Long Pond, Assawompsett, Pocksha, Great Quittacas, and Little Quittacas Ponds located in the towns of Freetown, Lakeville, Rochester and Middleboro. The Quittacas Water Treatment Plant draws from the Little Quittacas Pond to treat water for the City of New Bedford. Treatment consists of conventional filtration, disinfection, corrosion control, and fluoridation (as of January 2007). In addition to the 95,072 (2010 Census) residents, the City of New Bedford also supplies water to parts of Freetown and Acushnet along with Dartmouth on a seasonal basis and Fairhaven on an emergency basis.
The Massachusetts Department of Environmental Protection (MassDEP), through its Source Water Assessment and Protection (SWAP) Program, assesses the susceptibility of public water supplies. The SWAP report notes some issues situated in New Bedford’s public water supply protection area. The issues are active cranberry bogs and small farms, roadways, a utility right of way, and residential land uses. As a result, the report designates a high susceptibility ranking to the water supply protection area. New Bedford DPI has been proactive in protecting
the water supply protection area. The City owns over 3,000 acres of land in this area; including all shoreline property around the Little and Great Quittacas Ponds (with miles of walkable trails!). This land is kept in pristine condition, providing a protective barrier from potential pollutants. Forest management, overseen by a State certified forester, is ongoing. The land is routinely patrolled by watershed staff and reports are submitted to a watershed advisory committee. Regular testing of the water supply is performed and treatment is provided by the State certified operations staff at the Quittacas Water Treatment Plant, producing safe, clean drinking water for the residents of the City of New Bedford. The complete SWAP report is available at the New Bedford DPI office at 1105 Shawmut Avenue, New Bedford, MA. 02746, or online at: http:// www.mass.gov/eea/agencies/massdep/water/drinking/
For more information, contact ymane galotti, Superintendent of Water, at the New Bedford DPI
W O R K I N G F O R Y O U :
New Bedford has had the fortune of our predecessors allocating a pristine source of water and building exceptional infrastructure. We aim to continually improve and strengthen our system with each year so we can provide our customers with dependable, high quality drinking water. Some of the activities DPI completed in
2018 include:
- 109 lead services replaced by DPI.
- 782 lead services replaced by Phase I of lead service replacement program.
- 68 linear feet of replaced water mains.
- 287 valves inspected & exercised.
- 44 hydrants repaired/replaced/installed.
- 42 water main breaks and leaks repaired.
- 16 gate valves replaced.
- 3,115 hydrants flushed.
- Completed leak detection survey for 300 miles of water main.
- Began Large Water Meter Replacement and Meter Upgrade project.
- Began High Hill 75 MG Reservoir Rehabilitation project.
- Continued Upgrades to Quittacas Water Treatment Plant. Completed new gas powered generator installation and upgraded electric feed system.
- Cleared 30 miles of fire lane paths around watershed.
I N T R O D U C T I O N :
The New Bedford Department of Public Infrastructure (DPI), (Public Water Supply I.D. #4201000), is committed to providing you with safe, clean drinking water. We are pleased to present a summary of the water quality provided to you during the past year. Regular monitoring and testing ensures that the water supplied by the New Bedford DPI meets, or exceeds all state and federal requirements. This report summarizes the laboratory results for all samples collected and tested. Responsibility for maintaining water quality resides with our staff of certified water treatment plant operators, licensed by the Massachusetts Division of Professional Licensure.
! W A T E R I S P R E C I O U S !
! C O N S E R V E !
Water Conservation measures ensure adequate water
reserves for the most critical residential and emergency uses and can also cut the cost of water treatment.
• Fix leaks! Leaks can add up to hundreds of
gallons of water lost per week.
• Water your lawns in early mornings or evenings,
to reduce evaporation.
• Choose native plants that need less water.
• Sweep outdoor areas with a broom rather than
hosing them off.
• Use
• Wash only full loads of laundry and dishes.
• Choose
• Reuse clean household water for plants.
W H A T ’ S A C R O S S - C O N N E C T I O N ?
Garden hoses left lying on the ground (near fertilizers, cesspools, or garden chemicals), connected to chemical sprayers or submerged in pools are a common source of
We have surveyed industrial, commercial and institutional facilities in the service area to make sure that potential
C I T Y O F N E W B E D F O R D D E P A R T M E N T O F P U B L I C I N F R A S T R U C T U R E
1 1 0 5 S H A W M U T A V E N U E N E W B E D F O R D , M A 0 2 7 4 6
( 5 0 8 ) 9 7 9 - 1 5 5 0
Q U E S T I O N S O R C O M M E N T S :
Do you have questions about information in this report? If you do, please contact ymane galotti, Superintendent of Water, at
Spanish – Este informe contiene informacion muy importante sobre su agua beber. Traduzálo o hable con alguien que lo entienda bien.
French – Ce rapport contient des informations concernant la qualité de l’eau de votre communauté.
Portuguese – A informação neste documento é extremamente importante. Para uma tradução em português faça favor de telefonar
W A T E R |
I S |
T H E |
D R I V I N G |
F O R C E |
O F |
A L L |
N A T U R E . |
L E O N A R D O D A V I N C I
2 0 1 8
A N N U A L
W A T E R
Q U A L I T Y R E P O R T
J O N A T H A N F . M I T C H E L L
M A Y O R
C I T Y O F N E W B E D F O R D D E P A R T M E N T O F P U B L I C I N F R A S T R U C T U R E
J A M I E P O N T E
C O M M I S S I O N E R
H O W T O R E A D T H E F O L L O W I N G T A B L E :
This table shows the results of our water quality analysis. Every regulated contaminant that we detected in the New Bedford Water Supply, even in the most insignificant traces is listed here. The table contains the name of each substance, the highest level allowed by regulation (MCL), the ideal goals for public health (MCLG), the amount detected, the usual sources of such contaminant, footnotes explaining our findings, and a key to units of measurement. Definitions of MCL and MCLG are important. The data present in this report is from testing performed in 2018 or otherwise indicated. All testing was done in accordance with drinking water regulations.
R E G U L A T E D C O N T A M I N A N T S
CONTAMINANT |
MEETS |
RANGE |
AVERAGE |
MCLG |
|
MCL |
SAMPLE |
TYPICAL SOURCE |
|||
MCL |
DETECTED |
|
DATE |
||||||||
|
|
|
|
|
|
||||||
Total Trihalomethanes 1, 2 (ppb) |
Yes |
26 |
- |
65 |
44 |
N/A |
|
80 |
2018 |
||
Haloacetic Acids 1, 2 (ppb) |
Yes |
27 |
- |
61 |
47 |
N/A |
|
60 |
2018 |
||
Total Chlorine Residual 2, 3 (ppm) |
Yes |
1.07 |
- |
2.32 |
1.72 |
MRDLG |
|
MRDLG |
2018 |
Product of chloramination. Water additive |
|
4 |
|
4 |
used to control microbes. |
||||||||
|
|
|
|
|
|
|
|
||||
Total Organic Carbon (ppm) |
Yes |
2.48 |
- |
3.04 |
2.73 |
N/A |
|
TT |
2018 |
Naturally present in the environment. |
|
Turbidity (NTU) |
Yes |
0.09 |
- |
0.19 |
0.11 |
N/A |
|
TT 4 |
2018 |
Soil runoff |
|
Sodium (ppm) |
N/A |
|
25.9 |
N/A |
N/A |
|
N/A5 |
2018 |
Natural sources; runoff from use as salt on |
||
|
|
roadways; |
|||||||||
|
|
|
|
|
|
|
|
|
|
||
Total Coliform 6 |
Yes |
|
0 |
|
0 |
0 |
|
5 |
2018 |
Naturally present in the environment. |
|
(% of monthly positive samples) |
|
|
|
||||||||
|
|
|
|
|
|
|
|
|
|
||
Barium (ppm) |
Yes |
0.0086 |
N/A |
2 |
|
2 |
2018 |
Discharge of drilling wastes; discharge from |
|||
|
metal refineries; erosion of natural deposits |
||||||||||
|
|
|
|
|
|
|
|
|
|
||
|
|
|
|
|
|
|
|
|
|
Erosion of natural deposits; water additive |
|
Fluoride (ppm) |
Yes |
0.5 |
- |
0.9 |
0.7 |
4 |
|
4 |
2018 |
which promotes strong teeth; discharge from |
|
|
|
|
|
|
|
|
|
|
|
fertilizer and aluminum factories |
|
Combined Radium (pCi/L) |
Yes |
|
1.2 |
N/A |
0 |
|
5 |
2015 |
Erosion of natural deposits. |
||
|
|
|
|
|
|
|
|
|
|
||
Nitrate (ppm) |
Yes |
<0.0500 |
N/A |
10 |
|
10 |
2018 |
septic tanks, sewage. Erosion of natural de- |
|||
|
|
|
|
|
|
|
|
|
|
posits. |
|
Addition of Fluoride: As directed |
by the New |
Bedford Health |
Department, Fluoride has been added to the New Bedford Drinking Water supply since 2007 |
||||||||
with an optimum dosage of 0.7 parts per million (ppm). Fluoride also has a secondary maximum contaminant level (SMCL) of 2 ppm. |
|||||||||||
|
MEETS |
90TH |
ACTION |
# SITES |
SAMPLE |
|
|||||
CONTAMINANT |
ACTION |
TYPICAL SOURCE |
|||||||||
PERCENTILE |
LEVEL |
ABOVE AL |
YEAR |
||||||||
|
LEVEL |
|
|||||||||
|
|
|
|
|
|
|
|
|
|
||
Lead 7 (ppb) |
Yes |
|
7.8 |
15 |
|
0 |
2018 |
Corrosion of household plumbing systems; |
|||
|
|
Erosion of natural deposits |
|||||||||
|
|
|
|
|
|
|
|
|
|
||
|
|
|
|
|
|
|
|
|
|
Corrosion of household plumbing systems; |
|
Copper (ppm) |
Yes |
0.0273 |
1.3 |
|
0 |
2018 |
Erosion of natural deposits; Leaching from |
||||
|
|
|
|
|
|
|
|
|
|
wood preservatives |
|
S E C O N D A R Y C O N T A M I N A N T S
CONTAMINANT |
AVERAGE |
RANGE |
SMCL (PPB) |
HEALTH |
SAMPLE |
TYPICAL SOURCE |
|
DETECTED |
ADVISORY |
YEAR |
|||||
|
|
|
|
||||
Manganese 8 (ppb) |
N/A |
39 |
50 |
300 |
2018 |
Erosion of natural deposits. |
|
Aluminum (ppb) |
N/A |
332 |
200 |
N/A |
2018 |
Residue from water treatment process; ero- |
|
sion of natural deposits |
|||||||
|
|
|
|
|
|
U N R E G U L A T E D C O N T A M I N A N T S 9
CONTAMINANT |
AVERAGE |
RANGE DETECTED |
SAMPLE |
TYPICAL SOURCE |
|||
YEAR |
|||||||
|
|
|
|
|
|
||
Chlorate (ppb) |
110 |
71 |
- |
150 |
2016 |
||
Total Chromium (ppb) |
0.29 |
N.D. |
- |
0.42 |
2014 |
Naturally occurring element. |
|
0.034 |
N.D. |
- |
0.057 |
2014 |
Naturally occurring element. |
||
Strontium (ppb) |
28 |
26 |
- |
31 |
2014 |
Naturally occurring element. |
|
Vanadium (ppb) |
0.26 |
N.D. |
- |
0.35 |
2014 |
Naturally occurring element. |
|
Chloroform (ppb) |
N/A |
|
23.9 |
|
2018 |
||
Bromodichloromethane (ppb) |
N/A |
|
4.99 |
|
2018 |
||
Monochloroacetic Acid (ppb) |
2.16 |
N.D. |
- |
4.95 |
2018 |
||
Monobromoacetic Acid (ppb) |
1.08 |
N.D. |
- |
1.89 |
2018 |
||
Dichloroacetic Acid (ppb) |
29.36 |
19.4 |
- |
38.4 |
2018 |
||
Trichloroacetic Acid (ppb) |
12.81 |
10.6 |
- |
15 |
2018 |
||
Bromochloroacetic Acid (ppb) |
3.55 |
2.66 |
- |
4.42 |
2018 |
||
Dibromoacetic Acid (ppb) |
0.18 |
N.D. |
- |
0.405 |
2018 |
||
Bromodichloroacetic Acid (ppb) |
2.41 |
1.19 |
- |
2.87 |
2018 |
||
Manganese (ppb) |
N/A |
|
43.8 |
|
2018 |
Erosion of natural sources. |
|
T E R M S A N D
A B B R E V I A T I O N S U S E D I N D A T A T A B L E S :
MCLG (Maximum Contamination Level Goal): The level of a
contaminant in drinking water below which there is no known or expected risk to health. MCLGs allow for a margin of safety.
MCL (Maximum Contaminant
Level): The highest level of a contaminant that is allowed in drinking water. MCL’s are set as close to the MCLGs as feasible using the best available treatment
MRDLG (Maximum Residual Disinfectant Level Goal): The level of a drinking water disinfectant, below which, there is no known expected risk to health. MRDLG’s do not reflect the benefits of the use of disinfectants to control microbial contaminants.
M RD L ( M a x i m u m R e si d ua l Disinfectant Level): The highest level
of disinfectant allowed in drinking water. There is convincing evidence that addition of a disinfectant is necessary for the control of microbial contaminants.
AL (Action Level): The concentration of a contaminant which, if exceeded, triggers treatment or other requirements which a water system must follow.
90th Percentile; Ninety percent of the samples is below this level. (nine of ten sites samples were at or below this level). This number is compared to the Action Level to determine lead and copper compliance.
N/A: Not applicable
NTU (Nephelometric Turbidity
Units): Measurement of the clarity, or turbidity, of water. Turbidity in excess of 5 NTU is just noticeable to the average person.
ppm (parts per million): One part substance per million parts water or milligrams per liter (mg/l).
ppb (parts per billion): One part substance per billion parts water or micrograms per liter (ug/I).
pCi/L (picocuries per liter): A measure of radioactivity.
RAA (Running Annual Average): The average of the last four consecutive quarters of data.
SMCL (Secondary Maximum Contaminant Level): SMCLs are
established to regulate the aesthetics of drinking water like appearance, taste and odor.
- (Treatment Technique): A process aimed to reduce the level of a contaminant in drinking water.
A D D I T I O N A L H E A L T H I N F O R M A T I O N :
To ensure that tap water is safe to drink, MassDEP and EPA prescribes limits on the amount of certain contaminants in water provided by public water systems. Food and Drug Administration and the Massachusetts Department of Public Health regulations establish limits for contaminants in bottled water that must provide the same protection for public health. Drinking water, including bottled water, may reasonably be expected to contain at least small amounts of some contaminants. The presence of contaminants does not necessarily indicate that water poses a health risk. More information about contaminants and potential health effects can be obtained by calling the EPA’s Safe Drinking Water Hotline
The sources of drinking water (both tap & bottled) include rivers, lakes, streams, ponds, reservoirs, springs and wells. As water travels over the surface of the land or through the ground, it dissolves naturally occurring minerals and radioactive material, and can pick up substances resulting from the presence of animals or from human activity. Contaminants that may be present in source water include:
Microbial; such as viruses & bacteria, this may come from sewage treatment plants, septic systems, agricultural livestock operations and wildlife.
Inorganic; such as salts & metals, this can be naturally occurring or result from urban storm water runoff, industrial or domestic wastewater discharges, oil and gas production, mining, or farming. Pesticides and herbicides; which may come from a variety of sources such as agriculture, storm water runofff and residential uses.
Organic chemicals; which include synthetic and volatile organics that are
Radioactivity; which can be naturally occurring or be the result of oil and gas production and mining activities.
Some people may be more vulnerable to contaminants in drinking water than is the general population.
Water Hotline
Contaminants
New Bedford Department of Public Infrastructure
EWG's drinking water quality report shows results of tests conducted by the water utility and provided to the Environmental Working Group by the Massachusetts Department of Environmental Protection, as well as information from the U.S. EPA Enforcement and Compliance History database (ECHO). For the latest quarter assessed by the U.S. EPA (January 2019 - March 2019), tap water provided by this water utility was in compliance with federal health-based drinking water standards.
Utility details
- Serves: 95072
- Data available: 2012-2017
- Data Source: Surface water
- Total: 12
Contaminants That Exceed Guidelines
- Bromodichloromethane
- Chloroform
- Radium%2C combined (-226 & -228)
- Total trihalomethanes (TTHMs)
Other Detected Contaminants
- Barium
- Chlorate
- Chromium (hexavalent)
- Fluoride
- Haloacetic acids (HAA5)
- Manganese
- Strontium
- Vanadium
Reminder
Always take extra precautions, the water may be safe to drink when it leaves the sewage treatment plant but it may pick up pollutants during its way to your tap. We advise that you ask locals or hotel staff about the water quality. Also, note that different cities have different water mineral contents.
Sources and Resources
Sources Cited
Additional Resources
The New Bedford Department of Public Infrastructure (DPI) (Public Water Supply I.D. #4201000) is committed to giving you with safe, clean drinking water. We are pleased to give a summary of the water quality presented to you through the past year. Constant monitoring and testing guarantee that the water provided by the New Bedford DPI adheres or exceeds all state and federal qualifications. This report sums the laboratory results for all samples obtained and tested. Responsibility for keeping water quality resides with our staff of certified water treatment plant engineers, licensed by the Massachusetts Division of Professional Licensure.
Where does New Bedford get its water from?
The City of New Bedford’s Water Supply is acquired from five ponds found in Lakeville and Rochester, MA. The ponds are Assawampsett Pond, Great Quittacas Pond, Long Pond, Pocksha Pond and Little Quittacas Pond. There are 12,352 acres of watersheds owned by the City of New Bedford throughout the ponds.
In 2003 the City funded an additional $600,000 to buy a parcel of land near Betty’s Neck, adding numerous acres it currently owns. The treatment plant, found on Little Quittacas Pond, can treat 45,000,000 gallons of water everyday. The water is drawn, treated and dispersed into the 283.4 miles of distribution pipes. The storage volume at the High Hill Reservoir is 67,000,000 gallons. The total at the Hathaway Road elevated tank is 300,000 gallons.