Table of Contents
Can You Drink Tap Water in Mount Vernon?
Yes, Mount Vernon's tap water is generally considered safe to drink as Mount Vernon has no active health based violations of the Safe Drinking Water Act (SDWA) that we are aware of. Other factors such as lead piping in a home, or low levels of pollutants on immunocompromised individuals, should also be considered, however. To find more recent info we might have, you can check out our boil water notice page, the city's water provider website, or Mount Vernon's local Twitter account.
According the EPA’s ECHO database, from April 30, 2019 to June 30, 2022, Mount Vernon's water utility, Skagit County Pud 1 Judy Res, had 0 violations of the Safe Drinking Water Act. For more details on the violations, please see our violation history section below. This assessment is based on the Skagit County Pud 1 Judy Res water system, other water systems in the city may have different results.
While tap water that meets the EPA health guidelines generally won’t make you sick to your stomach, it can still contain regulated and unregulated contaminants present in trace amounts that could potentially cause health issues over the long-run. These trace contaminants may also impact immunocompromised and vulnerable individuals.
The EPA is reviewing if it’s current regulations around pollutant levels in tap water are strict enough, and the health dangers posed by unregulated pollutants, like PFAS.
Water Quality Report for Mount Vernon Tap Water
The most recent publicly available numbers for measured contaminant levels in Mount Vernon tap water are in its 2020 Water Quality Report. As you can see, there are levels which the EPA considers to be acceptable, but being below the maximum allowable level doesn’t necessarily mean the water is healthy.
Lead in tap water, for example, is currently allowed at up to 15ppb by the EPA, but it has set the ideal goal for lead at zero. This highlights how meeting EPA standards doesn’t necessarily mean local tap water is healthy.
EPA regulations continue to change as it evaluates the long term impacts of chemicals and updates drinking water acceptable levels. The rules around arsenic, as well as, lead and copper are currently being re-evaluated.
There are also a number of "emerging" contaminants that are not currently. For example, PFAS (Per- and polyfluoroalkyl substances), for which the EPA has issued a health advisory. PFAS are called "forever chemicals" since they tend not to break down in the environment or the human body and can accumulate over time.
We recommend looking at the contaminants present in Mount Vernon's water quality reports, or getting your home's tap water tested to see if you should be filtering your water.
Mount Vernon Tap Water Safe Drinking Water Act Violation History - Prior 10 Years
Below is a ten year history of violations for the water system named Skagit County Pud 1 Judy Res for Mount Vernon in Washington. For more details please see the "What do these Violations Mean?" section below.
For the compliance period beginning July 1, 2014, Mount Vernon had 1 non-health based Safe Drinking Water Act violation with the violation category being Other Violation, more specifically, the violation code was Consumer Confidence Report Complete Failure to Report which falls into the Other rule code group, and the Consumer Confidence Rule rule code family for the following contaminant code: Consumer Confidence Rule.
Is there Lead in Mount Vernon Water?
Based on the EPA’s ECHO Database, 90% of the samples taken from the Mount Vernon water system, Skagit County Pud 1 Judy Res, between sample start date and sample end date, were at or below, 0.002 mg/L of lead in Mount Vernon water. This is 13.3% of the 0.015 mg/L action level. This means 10% of the samples taken from Mount Vernon contained more lead.
While Mount Vernon water testing may have found 0.002 mg/L of lead in its water, that does not mean your water source has the same amount. The amount of lead in water in a city can vary greatly from neighborhood to neighborhood, or even building to building. Many buildings, particularly older ones, have lead pipes or service lines which can be a source of contamination. To find out if your home has lead, we recommend getting you water tested.
No amount of lead in water is healthy, only less dangerous. As lead accumulates in our bodies over time, even exposure to relatively small amounts can have negative health effects. For more information, please check out our Lead FAQ page.
Are there PFAS in Mount Vernon Tap Water?
Currently, testing tap water for PFAS isn’t mandated on a national level. We do have a list of military bases where there have been suspected or confirmed leaks. There appears to be no military bases near Mount Vernon with suspected leaks.
With many potential sources of PFAS in tap water across the US, the best information we currently have about which cities have PFAS in their water is this ewg map, which you can check to see if Mount Vernon has been evaluated for yet.
Our stance is better safe than sorry, and that it makes sense to try to purify the tap water just in case.
Mount Vernon SDWA Violation History Table - Prior 10 Years
| Compliance Period | Status | Health-Based? | Category Code | Code | Rule Code | Contaminant Code | Rule Group Code | Rule Family Code |
|---|---|---|---|---|---|---|---|---|
| 07/01/2014 - | Resolved | No | Other Violation (Other) | Consumer Confidence Report Complete Failure to Report (71) | Consumer Confidence Rule (420) | Consumer Confidence Rule (7000) | Other (400) | Consumer Confidence Rule (420) |
What do these Violations Mean?
Safe Drinking Water Act Violations categories split into two groups, health based, and non-health based. Generally, health based violations are more serious, though non-health based violations can also be cause for concern.
Health Based Violations
- Maximum contaminant levels (MCLs) - maximum allowed contaminant level was exceeded.
- Maximum residual disinfectant levels (MRDLs) - maximum allowed disinfectant level was exceeded.
- Other violations (Other) - the exact required process to reduce the amounts of contaminants in drinking water was not followed.
Non-Health Based Violations
- Monitoring and reporting violations (MR, MON) - failure to conduct the required regular monitoring of drinking water quality, and/or to submit monitoring results on time.
- Public notice violations (Other) - failure to immediately alert consumers if there is a serious problem with their drinking water that may pose a risk to public health.
- Other violations (Other) - miscellaneous violations, such as failure to issue annual consumer confidence reports or maintain required records.
SDWA Table Key
| Field | Description |
|---|---|
| Compliance Period | Dates of the compliance period. |
| Status |
Current status of the violation.
|
| Health-Based? | Whether the violation is health based. |
| Category Code |
The category of violation that is reported.
|
| Code | A full description of violation codes can be accessed in the SDWA_REF_CODE_VALUES (CSV) table. |
| Contaminant Code | A code value that represents a contaminant for which a public water system has incurred a violation of a primary drinking water regulation. |
| Rule Code |
Code for a National Drinking Water rule.
|
| Rule Group Code |
Code that uniquely identifies a rule group.
|
| Rule Family Code |
Code for rule family.
|
For more clarification please visit the EPA's data dictionary.
Mount Vernon Water - Frequently Asked Questions
| By Mail: | PO Box 1436 Mt Vernon, WA, 98273-1436 |
Existing customers can login to their Skagit County Pud 1 Judy Res account to pay their Mount Vernon water bill by clicking here.
If you want to pay your Skagit County Pud 1 Judy Res bill online and haven't made an account yet, you can create an account online. Please click here to create your account to pay your Mount Vernon water bill.
If you don't want to make an account, or can't remember your account, you can make a one-time payment towards your Mount Vernon water bill without creating an account using a one time payment portal with your account number and credit or debit card. Click here to make a one time payment.
Moving to a new house or apartment in Mount Vernon means you will often need to put the water in your name with Skagit County Pud 1 Judy Res. In order to put the water in your name, please click the link to the start service form below. Start service requests for water bills typically take two business days.
Leaving your house or apartment in Mount Vernon means you will likely need to take your name off of the water bill with Skagit County Pud 1 Judy Res. In order to take your name off the water bill, please click the link to the stop service form below. Stop service for water bills requests typically take two business days.
USER SUBMITTED RATINGS
- Drinking Water Pollution and Inaccessibility
- Water Pollution
- Drinking Water Quality and Accessibility
- Water Quality
The above data is comprised of subjective, user submitted opinions about the water quality and pollution in Mount Vernon, measured on a scale from 0% (lowest) to 100% (highest).
Related FAQS
Mount Vernon Water Quality Report (Consumer Confidence Report)
The EPA mandates that towns and cities consistently monitor and test their tap water. They must report their findings in an annual Consumer Confidence Report. Below is the most recent water quality report from Mount Vernon's Water. If you would like to see the original version of the report, please click here.

SKAGIT PUBLIC UTILITY DISTRICT
WATER QUALITY REPORT 2020
& WATER USE EFFICIENCY UPDATE
Este informe contiene información importante acerca de su agua potable. Haga que alguien lo traduzca para usted, o hable con alguien que lo entienda.
COMMITMENT
WHO WE ARE
YEARS DELIVERING |
REGIONAL LEADER |
WATER TO SKAGIT |
& INNOVATIVE |
81PUD CUSTOMERS |
UTILITY PROVIDER |
PEOPLE WE SERVE
83UNION &
WORKERS
UTILITY & STAFF
As your
are mindful that water utilities are the only utilities that produce a product that people ingest, which directly impacts life. Our people commit themselves to deliver water and service that exceeds our customers’ expectations. Customers trust that we carefully process each drop of water their families consume. This report is a snapshot of the quality of water that we provided in 2020. Included are details about where your water comes from, what it contains, and how it compares to Environmental Protection Agency and state standards.
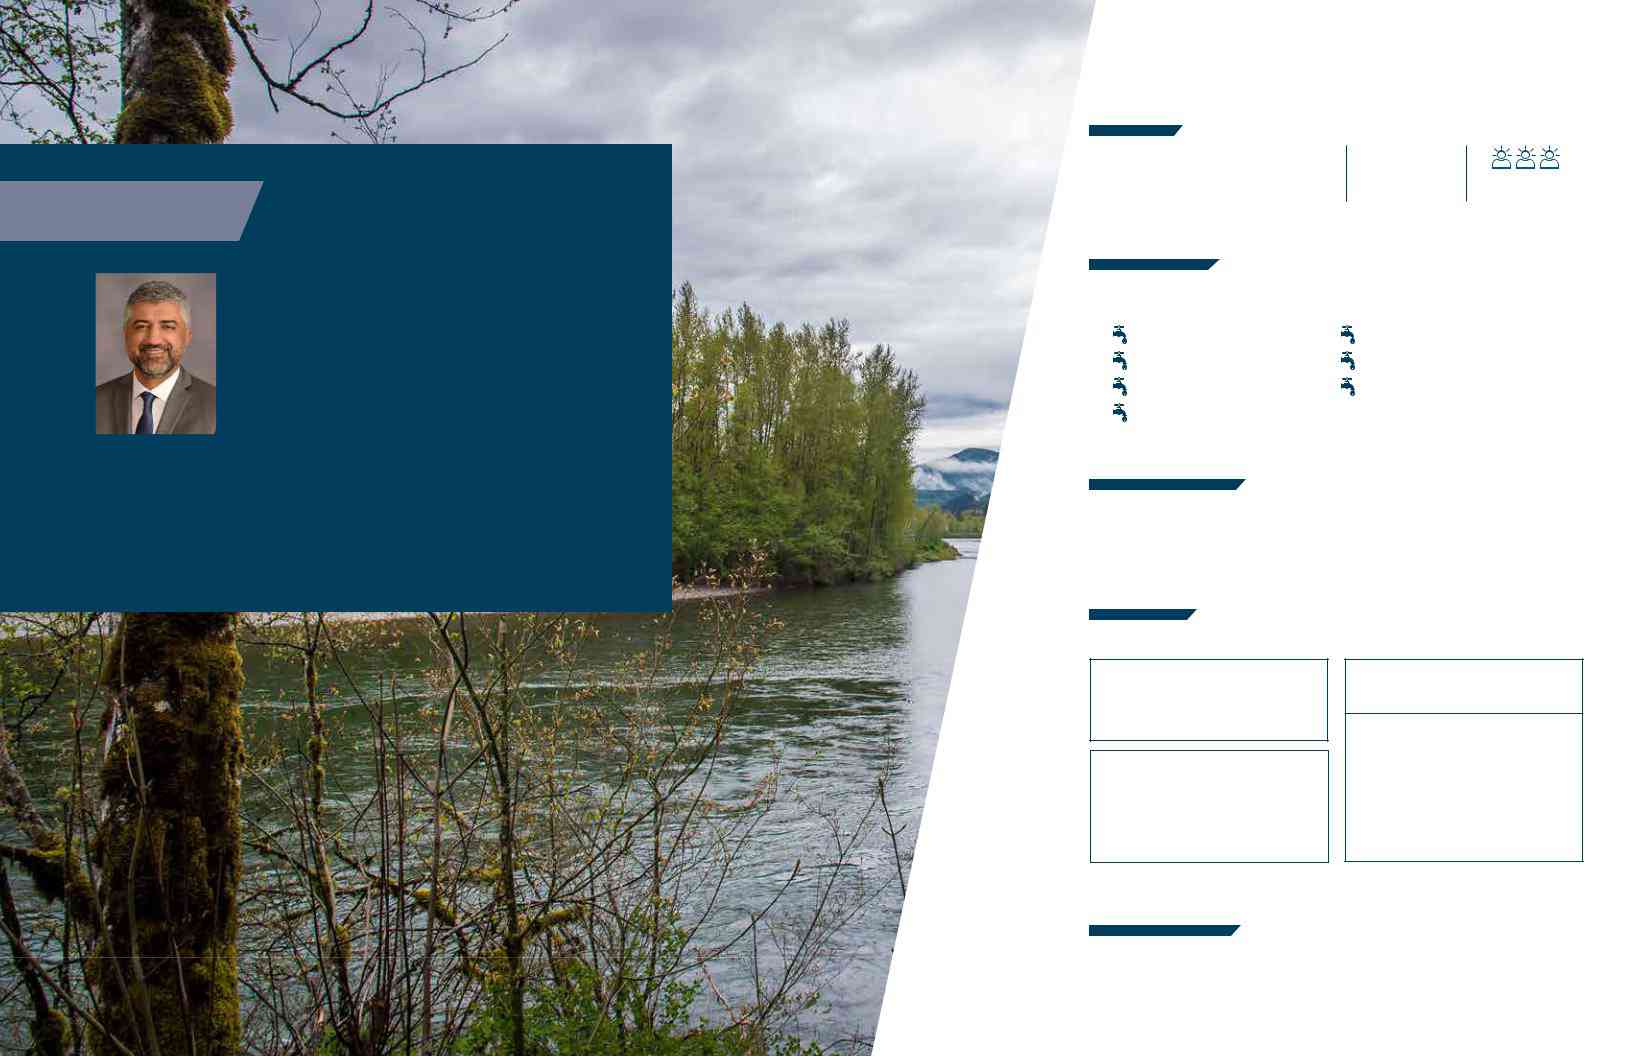
GEORGE SIDHU, P.E.
GENERAL MANAGER | SKAGIT PUBLIC UTILITY DISTRICT
-
82,000 people in Burlington, Mount Vernon and
Sedro-Woolley areas - Plus seven satellite systems from Guemes Island to Marblemount.
Alger Water System |
Cedargrove Water System |
Fidalgo Island Water System |
Marblemount Water System |
Potlatch Water System |
Rockport Water System |
Skagit View Village Water System |
|
EXCEPTIONAL QUALITY
Skagit PUD earned the Washington Department of Health’s Office of Drinking Water Platinum Award for 15 or more consecutive years of optimal performance of the Judy Reservoir water supply system.
WHAT WE DO
SYSTEM
55% DUCTILE IRON
650 27% PLASTIC / PVC
13% ASBESTOS
MILES OF PIPELINE
22 Number of reservoirs in distribution system
3 Number of clearwells at Judy Reservoir
WHO TO CONTACT
ACCOUNTS
26K+ WATER SERVICES
86% Residential
7% Commercial
5%
1% Farms / Government
If you have questions regarding your water quality or the information presented in this annual report, please contact Emilia Blake, Water Quality Coordinator, at (360)
2 | WATER QUALITY REPORT 2020 |
WATER QUALITY REPORT 2020 | 3 |

DRINKING WATER—EPA STANDARDS FOR PROTECTING PUBLIC HEALTH
Drinking water, including bottled water, may reasonably contain at least small amounts of some contaminants. The presence of contaminants does not necessarily indicate that water poses a health risk. More information about contaminants and potential health effects can be obtained by calling the EPA’s Safe Drinking Water Hotline
To ensure that tap water is safe to drink, the Department of Health and EPA prescribe regulations limiting specific contaminants in water provided by public water systems.
The Food and Drug Administration and the Washington Department of Agriculture regulations establish limits for contaminants in bottled water that must provide the same protections for public health.
YOUR HEALTH
ASSESSING YOUR HEALTH RISK
Some people may be more vulnerable to contaminants in drinking water than the general population. Immunocompromised persons such as persons with cancer undergoing chemotherapy, persons who have undergone organ transplants, people with HIV/AIDS or other immune system disorders, some elderly, and infants can be particularly vulnerable to infections. These people should seek advice about drinking water from their health care providers. The Environmental Protection Agency and Centers for Disease Control and Prevention guidelines on appropriate means to lessen the risk of infection by cryptosporidium and other microbial contaminants are available from the Safe Drinking Water Hotline
CONTAMINANT SOURCES
The drinking water
Microbial contaminants, such as viruses and bacteria, which may come from sewage treatment plants, septic systems, agricultural livestock operations, and wildlife.
Inorganic contaminants, such as salts and metals, which can be naturally occurring or result from urban storm water runoff, industrial or domestic wastewater discharges, oil and gas production, mining, or farming.
Pesticides and herbicides, Pesticides and herbicides may come from various sources such as agriculture, urban stormwater runoff, and residential uses.
Organic chemical contaminants, including synthetic and volatile organic chemicals, are
Radioactive contaminants, which can be naturally occurring or be the result of oil and gas production, and mining activities.
To ensure that tap water is safe to drink, the EPA prescribes regulations that limit the number of specific contaminants in water provided
by public water systems. Food and Drug Administration regulations establish limits for contaminants in bottled water which must provide the same protections for public health.
4 | WATER QUALITY REPORT 2020 |
WATER QUALITY REPORT 2020 | 5 |
SAFE & PROTECTED
PER- AND POLYFLUOROALKYL
SUBSTANCES (PFAS)
Skagit PUD’s drinking water remains safe and protected from contaminants, including the group of manufactured chemicals labeled PFAS (per- and polyfluoroalkyl substances). PFAS are manufactured for a variety of industrial purposes. If detected in drinking water, PFAS have the potential to raise health concerns.
WHAT ARE PFAS?
PFAS are chemicals used in industrial and consumer products, such as carpeting, clothing, upholstery, food paper wrappings,
-
Some epidemiological studies suggest that exposure to PFAS increases cholesterol levels, reduces birth weight, and may increase rates of some types of cancers (kidney and testicular cancer).
The 2019 film “Dark Waters,” based on a true story, focuses on the use of PFAS in the United States and how these “forever chemicals” are found in everything from clothing to drinking water and, subsequently, the human bloodstream. The chemicals do not biodegrade, can accumulate in water bodies, and have potentially serious health consequences.
MONITORING EFFORTS
Currently, the PFAS are not regulated contaminants, and routine monitoring is not required. Still, Skagit PUD monitored for six types of PFAS in
- Detailed information regarding PFAS can be found on the EPA website at www.epa.gov/pfas.
- Skagit PUD is committed to protecting the Judy Reservoir watershed and prohibits any activities that can introduce PFAS compounds or any other contaminants in the source water.
PFAS SOURCES
Research has suggested that exposure to PFAS from today’s consumer products is usually low, especially when compared to exposures to contaminated drinking water. Some products that may contain PFAS include:
-
Some
grease-resistant paper, fast food containers/wrappers, microwave popcorn bags, pizza boxes, and candy wrappers - Nonstick cookware
-
Stain-resistant coatings used on carpets, upholstery, and other fabrics -
Water-resistant clothing - Cleaning products
- Personal care products (shampoo, dental floss) and cosmetics (nail polish, eye makeup)
- Paints, varnishes, and sealants
6 | WATER QUALITY REPORT 2020 |
WATER QUALITY REPORT 2020 | 7 |

POTENTIAL HEALTH EFFECTS OF LEAD
The greatest risk of lead exposure is to infants, young children, and pregnant women. Lead can cause serious health problems if too much enters the body. Lead is stored in the bones and can be released later in life. Lead can cause damage to the brain and kidneys, interfere with production of red blood cells that carry oxygen, and may result in lowered IQ in children. During pregnancy, the child receives lead from the mother’s bones, which may affect brain development. Low levels of lead can affect adults with high blood pressure or kidney problems.
8 | WATER QUALITY REPORT 2020
HOW YOU CAN REDUCE LEAD EXPOSURE
If present, elevated levels of lead can cause serious health problems, especially for pregnant women and young children. Lead in drinking water is primarily from materials and components associated with service lines and home plumbing.
-
Skagit PUD is responsible for providing
high-quality drinking water but cannot control the variety of materials used in plumbing components. When your water has been sitting for several hours, you can minimize the potential for lead exposure by flushing your tap for 30 seconds to 2 minutes before using water for drinking or cooking. - If you are concerned about lead in your water, you may wish to have your water tested. Information on lead in drinking water, testing methods, and steps you can take to minimize exposure is available from the Safe Drinking Water Hotline or at www.epa.gov/safewater/lead.
SAFETY TIP
Clean your aerator.
Regularly clean your faucet’s screen (also known as an aerator). Sediment, debris, and lead particles can collect in your aerator. If lead particles are caught in the aerator, lead can get into your water.
WATER QUALITY REPORT 2020 | 9
SOURCE WATER PROTECTION
To achieve improved protection of public water supply sources and the health of Washington’s citizens, the Washington State Department of Health has developed the Source Water Assessment Program.
The program evaluates potential threats to the safety of our water supplies by assessing sources of contamination. The SWAP is designed to give you and your community more information about your drinking water source and any threats to its
-
To learn more about the SWAP, contact the Department of Health at (360)
236-3149 or visit www.doh.wa.gov/ehp/dw.
STEWARDSHIP
CULTUS MOUNTAIN WATERSHED PURCHASE
In 2017, Skagit PUD purchased a
The property is located around Gilligan Creek, which provides 45% of the PUD’s source water for the Judy Reservoir water system. Until recently, timber companies and the Department of Natural Resources owned all the property around Gilligan Creek.
In 2012, the PUD went through a comprehensive updating of its watershed control program. It determined that finding a way to protect the water quality of this stream was critical to the success of the Judy system. Recent increases in the rates of logging and road construction led to the concept that buying land near the area where water is withdrawn for the water system would work wonders to protect the
A
10 | WATER QUALITY REPORT 2020 |
WATER QUALITY REPORT 2020 | 11 |

DEFINITIONS
Action Level (AL). The concentration of a contaminant, which when exceeded, triggers treatment or other requirements that a water system must follow.
Haloacetic Acids. A disinfection
Maximum Contaminant Level (MCL). The highest level of a contaminant that is allowed in drinking water. MCLs are set as close to the MCLG as feasible using the best available treatment technology.
Maximum Contaminant Level Goal (MCLG). The level of a contaminant in drinking water below which there is no known or expected health risk. MCLGs allow for a margin of safety.
Maximum Residual Disinfectant Level (MRDL). The highest level of disinfectant allowed in drinking water. There is convincing evidence that the addition of
a disinfectant is necessary for the control of microbial contaminants.
Maximum Residual Disinfectant Level Goal (MRDLG). The level of a drinking water disinfectant below which there is no known or expected health risk. MRDLGs do not reflect the health benefits of the use of disinfectants to control microbial contaminants.
Not Applicable (NA). Does not apply.
Not Detected (ND). Indicates that the parameter was not detected above the Specified Reporting Limit.
Nephelometric Turbidity Units (NTU). A unit of measure for turbidity based on the amount of light that is reflected from the water.
Part per million (ppm). One part per million is equivalent to half of an aspirin tablet dissolved in a full bathtub of water (50 gallons).
Part per billion (ppb). One part per billion is equivalent to half of an aspirin tablet dissolved in 1,000 bathtubs of water (50,000 gallons).
Total Coliforms. A group of
in more samples than allowed, it would be a warning of potential problems.
Trihalomethanes. A disinfection
Treatment Technique (TT). A required process intended to reduce the level of a contaminant in drinking water.
Turbidity. A measure of the cloudiness of water. We monitor it because it’s a good indicator of the effectiveness of our filtration system.
Water Quality Data
The drinking water results tables included in this report list all the drinking water contaminants we detected during the 2020 calendar year. These contaminants in the water do not necessarily indicate that the water poses a health risk. Unless otherwise noted, the data presented in the tables are from testing done January 1 to December 31, 2020. The state requires us to monitor for specific contaminants less than once per year because the concentrations of these contaminants are not expected to vary significantly from year to year. Some of the data, though representative of the water quality, is more than one year old.
12 | WATER QUALITY REPORT 2020 |
WATER QUALITY REPORT 2020 | 13 |
JUDY RESERVOIR
PUBLIC WATER SYSTEM: ID# 79500E
ABOUT JUDY
Since construction in 1947, Judy Reservoir has seen its capacity increased by raising the surrounding dams in 1965 and 2001. The current capacity of the reservoir is
SOURCE & TREATMENT
The Judy Reservoir system is located in Skagit County and serves around 70,000 people, with the majority being in Mount Vernon, Burlington, and
-
The treatment is a
multi-step direct filtration process that meets water quality standards and provides 99.99% removal. The raw water from Judy Reservoir is disinfected with chlorine dioxide then pumped to the water treatment plant, where carbon dioxide and coagulant aids are added. This step is intended to provide initial oxidation (beneficial in reducing taste and odor caused by algae) and help coagulate small particles in the flocculation basin, where bigger particles are then formed. Filtration is the next step, where the treated water passes through charcoal media and sand. The finished water is then disinfected and flows by gravity into three clear wells. -
Before the water reaches the clear wells, caustic soda and ammonia are added to adjust pH and form chloramines for residual disinfection. Chloramines are used because it provides effective and
long-lasting disinfection
in the distribution system at low dosages. Chloramines are measured as both total chlorine and monochloramine. Their optimal formation and stability are at pH 8.5 and above. The water leaving the treatment plant has a target pH of 8.8 and can be slightly higher in the distribution system. Alkaline (higher) pH and alkalinity adjustment help with corrosion control because Judy Reservoir water is soft by nature.
- Total chlorine residual is maintained throughout the distribution system to provide sufficient disinfection.
- In 2020, 80 routine samples per month from the distribution system were required to be tested for total coliforms and E. coli. The total chlorine residual levels leaving the water treatment plant were between 1.3 to 1.8 mg/l and a pH of 8.8. Monthly the water is tested for total organic carbon and chlorite.
-
Quarterly, the treated water is tested for disinfection
by-products from eight locations throughout the distribution system. Results show that disinfectionby-products are below the established Maximum Contaminant Level. Once a year, water is tested for nitrate, which is usually very low (< 1 mg/l). Every three years, lead and copper samples are collected from customers with older homes to establish the corrosive properties of the water. Thus far, the system has complied with the established action levels for lead and copper. - The Judy system is on a testing schedule
of every six years for radionuclides. The DOH has granted a reduced monitoring waiver for pesticides, soil fumigants, volatile organics, and complete inorganics tested every three, six, or nine years.
approximately 1.45 billion gallons. The reservoir is formed by two
- The District’s water treatment plant is located on the north side of Judy Reservoir. Water is pumped from the reservoir, processed at the treatment plant in compliance with DOH regulations, and flows through gravity pipelines to the distribution system.
WATER QUALITY
Currently, the drinking water quality meets all primary and secondary drinking water standards. Judy Reservoir water is considered soft with a hardness of 21 mg/l (calcium carbonate).
Throughout the day, the raw (untreated) water quality is monitored by online analyzers and lab tests to evaluate and provide sufficient treatment technique. Some of these daily tests include pH, temperature, color, turbidity, alkalinity, chlorite, and weekly tests for fecal coliforms, algae count, and identification. Less frequent tests are conducted for cryptosporidium, Giardia, and other parasites.
14 | WATER QUALITY REPORT 2020
WATER QUALITY REPORT 2020 | 15
JUDY RESERVOIR PUBLIC WATER SYSTEM: ID# 79500E
2020 DRINKING WATER RESULTS
The water quality information presented in the table(s) is from the most recent round of testing done according to the regulations. All data shown were collected during the last calendar year unless otherwise noted in the table(s).
Contaminants |
MCLG |
MCL |
Judy |
Range of Detection |
Sample Date |
Violation |
Typical Source of Contaminant |
||
Reservoir |
Lowest |
Highest |
|||||||
|
|
|
|
|
|
||||
RAW WATER |
|
|
|
|
|
|
|
|
|
Total Organic |
N/A |
TT |
2 |
1.4 |
2.5 |
2020 |
NO |
Naturally present in the environment |
|
Carbon (ppm) |
|||||||||
|
|
|
|
|
|
|
|
||
Cryptosporidium |
N/A |
N/A |
ND |
ND |
ND |
2020 |
NO |
Naturally present in the environment |
|
(oocyst/L)* |
|||||||||
|
|
|
|
|
|
|
|
||
*Total of 12 samples were collected and none had presence of Cryptosporidium or Giardia. |
|
|
|||||||
|
|
|
|
|
|
|
|
||
FINISHED WATER |
|
|
|
|
|
|
|
||
Turbidity (NTU) |
N/A |
TT |
0.02 |
0.01 |
0.09 |
2020 |
NO |
Soil erosion |
|
Turbidity measures the cloudiness of the water and is a good indicator of the effectiveness of our filtration system at removing particulates from the water. Skagit PUD measures turbidity continuously throughout the treatment process. In 2020, no filter water turbidity results were above the EPA 0.3 NTU limit. For compliance purposes, combined filter effluent turbidity should be <0.3 NTU in 95% of the monthly samples.
DISINFECTANT RESIDUAL
Total Chlorine |
4 |
4 |
1.2 |
0.1 |
1.9 |
2020 |
NO |
Measure of disinfectant |
|
Residual (ppm) |
added to water |
||||||||
|
|
|
|
|
|
|
Skagit PUD uses chloramines for disinfection. To ensure disinfectant residual in the distribution system, total and free chlorine residual measurements are taken with each coliform sample. Additionally, monochloramine measurements are taken to establish chloramine formation.
MICROBIOLOGICAL CONTAMINANTS
MONITORING WAIVERS*
Contaminants |
Frequency |
Last Sampled |
Violation |
Volatile Organic Chemicals (VOC) |
Every 6 years. |
2017 |
NO |
Inorganic Chemicals (IOC) |
Every 9 years. |
2011 |
NO |
Synthetic Organic Chemicals (SOC) |
Every 3 or 9 years.** |
2015 |
NO |
*The Washington State Department of Health reduced the monitoring requirements for IOCs (28 contaminants), SOCs (40 contaminants) and VOCs (25 contaminants), because the source is not at risk of contamination. **Pesticides are monitored every three years and herbicides every nine years, none of the two groups have been detected in our finished water.
Currently, per- and polyfluoroalkyl substances (PFAS) are not regulated contaminants and routine monitoring is not required, but Skagit PUD monitored for six types of PFAS in
LEAD & COPPER
Contaminants |
MGLG |
AL |
Judy Reservoir |
Sample Date |
# Samples |
Violation |
Typical Sources |
|
|
|
|
(90th %) |
|
Exceeding AL |
|
|
|
Lead – lead at |
0 |
15 |
2* |
2018 |
0 of 30 |
NO |
Corrosion of household plumbing |
|
consumer’s tap (ppb) |
systems; erosion of natural deposits |
|||||||
|
|
|
|
|
|
|||
|
|
|
|
|
|
|
|
|
Copper – copper at |
1.3 |
1.3 |
0.02* |
2018 |
0 of 30 |
NO |
Corrosion of household plumbing |
|
consumer’s tap (ppm) |
systems; erosion of natural deposits |
|||||||
|
|
|
|
|
|
- The 90th percentile level is the highest result obtained in 90% of the samples collected when ranked from lowest to highest. Judy Reservoir is required to collect 30 samples for lead and copper from household taps every three years. The Washington State Department of Health requires Judy Reservoir to provide corrosion control treatment by adjusting the pH and alkalinity with caustic soda. The target pH leaving the treatment plant is 8.8 and is constantly monitored with online analyzers and lab tests every two hours. pH measurements are taken with every coliform sample throughout the distribution system.
Total Coliform |
0 |
5% per |
0 |
0 |
0 |
2020 |
NO |
Naturally present in the environment |
|
Bacteria |
month |
||||||||
|
|
|
|
|
|
|
Skagit PUD collects 80 compliance samples per month for total coliforms and E. coli from our distribution system. No total coliforms or E. coli were detected in 2020.
DISINFECTION
Chlorite (ppm) |
0.8 |
1 |
0.55 |
0.43 |
0.74 |
2020 |
NO |
||
Total |
|
|
|
|
|
|
|
||
Trihalomethanes |
N/A |
80 |
10.0* |
6.2** |
14.9** |
2020 |
NO |
||
water chlorination |
|||||||||
(ppb) |
|
|
|
|
|
|
|
||
|
|
|
|
|
|
|
|
||
Haloacetic Acids |
N/A |
60 |
13.9* |
7.1** |
21.2** |
2020 |
NO |
||
(5) (ppb) |
water chlorination |
||||||||
|
|
|
|
|
|
|
Chlorite samples are collected monthly from three locations. The TTHMs and HAA5 results are from the eight locations in Skagit County, which are monitored quarterly to comply with current regulations. *Highest locational running average of the eight sites. **Lowest and highest actual value from all eight locations measured.
AESTHETIC AND SECONDARY STANDARDS
Parameter |
Units |
MCL |
2019 Results |
Calcium |
mg/l |
N/A |
5.6 |
Magnesium |
mg/l |
N/A |
1.2 |
|
|
|
|
Potassium |
mg/l |
N/A |
0.5 |
|
|
|
|
Sodium |
mg/l |
N/A |
6.6 |
|
|
|
|
Hardness |
mg/l |
N/A |
18.9 |
Iron |
mg/l |
0.3 |
ND |
|
|
|
|
Chloride |
mg/l |
250 |
3.1 |
|
|
|
|
Sulfate |
mg/l |
250 |
3.5 |
|
|
|
|
The fourth Unregulated Contaminant Monitoring Rule monitoring started in 2019 and continued in 2020. The Judy Reservoir system was monitored for 30 chemical contaminants using analytical methods developed by the EPA, which provides the basis for future regulatory actions. For more information about the program, visit EPA’s website at
Susceptibility rating of potential threats to the safety of our water supply: High
See Source Water Assessment Program data on the Department of Health
INORGANIC CONTAMINANTS
Nitrate (ppm) |
|
10 |
10 |
ND |
N/A |
N/A |
2020 |
NO |
Erosion of natural deposits |
RADIONUCLIDES |
|
|
|
|
|
|
|
|
|
Gross Alpha (pCi/L) |
|
0 |
15 |
ND |
N/A |
N/A |
2015 |
NO |
Erosion of natural deposits |
Gross Beta (pCi/L) |
|
0 |
50 |
ND |
N/A |
N/A |
2015 |
NO |
Erosion of natural deposits |
Radium 228 (pCi/L) |
|
0 |
5 |
ND |
N/A |
N/A |
2015 |
NO |
Erosion of natural deposits |
DETECTED UNREGULATED CONTAMINANTS* |
|
|
|
|
|||||
Manganese (ppb) |
|
N/A |
N/A |
0.9 |
0.41 |
1.3 |
2020 |
N/A |
Naturally present in the environment |
Bromochloroacetic |
|
N/A |
N/A |
0.6 |
ND |
0.8 |
2020 |
N/A |
Disinfection |
Acid (ppb) |
|
||||||||
|
|
|
|
|
|
|
|
|
|
Dichloroacetic Acid |
|
N/A |
N/A |
12.4 |
7.4 |
16 |
2020 |
N/A |
Disinfection |
(ppb) |
|
||||||||
|
|
|
|
|
|
|
|
|
|
Trichloroacetic Acid |
|
N/A |
N/A |
3.4 |
2.4 |
4.4 |
2020 |
N/A |
Disinfection |
(ppb) |
|
||||||||
|
|
|
|
|
|
|
|
|
|
*Unregulated contaminants are those for which EPA has not established drinking water standards. The purpose of unregulated contaminant monitoring is to help EPA determine their occurrence in drinking water and potential need for future regulation.
How to Read the Water Quality Data Table
EPA establishes the safe drinking water regulations that limit the amount of contaminants allowed in drinking water. The tables show the concentrations of detected substances in comparison to regulatory limits. Substances not detected are not included in the table.
Maximum Contaminant Level (MCL): The highest level of a contaminant that is allowed in drinking water. MCLs are set as close to the MCLGs as feasible using the best available treatment technology.
Maximum Contaminant Level Goal (MCLG): The level of a contaminant in drinking water below which there is no know or expected risk to health. MCLGs allow for a margin of safety.
Action Level (AL): The concentration of a contaminant which, if exceeded, triggers treatment or other requirements which a system must follow.
Units in the Table: ppm is parts per million (or 1 drop in 1 million gallons), ppb is parts per billion (or 1 drop in 1 billion gallons)
16 | WATER QUALITY REPORT 2020 |
WATER QUALITY REPORT 2020 | 17 |
ALGER PUBLIC WATER SYSTEM: ID# 01400K
Contaminants MCLG MCL |
Alger |
Range of Detection |
Sample Date Violation Typical Source of Contaminant |
||
Lowest |
Highest |
||||
|
|
|
|||
SOURCE & TREATMENT
The Alger water system is located 15 miles north of Mount Vernon and serves approximately 110 residential connections and 12
WATER QUALITY
Currently, the drinking water quality meets all primary and secondary drinking water standards. The hardness of the water is 82.0 mg/l (as calcium carbonate).
A monthly routine distribution sample is tested for total coliform and E. coli. Total chlorine residual levels are around
These parameters are below the established MCLs. Radionuclides are on a
The Washington State Department of Health has granted the Alger water system waivers for asbestos, complete inorganics, herbicides, pesticides, and soil fumigants. These parameters are tested every three or nine years.
RADIONUCLIDES |
|
|
|
|
|
|
|
|
|
|
|
|
|
|
|
|
|
Gross Alpha |
|
0 |
15 |
|
|
ND |
|
N/A |
|
N/A |
|
2015 |
|
NO |
|
Erosion of natural deposits |
|
(pCi/L) |
|
|
|
|
|
|
|
|
|
||||||||
|
|
|
|
|
|
|
|
|
|
|
|
|
|
|
|
|
|
Gross Beta |
|
0 |
50 |
|
|
ND |
|
N/A |
|
N/A |
|
2015 |
|
NO |
|
Erosion of natural deposits |
|
(pCi/L) |
|
|
|
|
|
|
|
|
|
||||||||
|
|
|
|
|
|
|
|
|
|
|
|
|
|
|
|
|
|
Radium 228 |
|
0 |
5 |
|
|
ND |
|
N/A |
|
N/A |
|
2015 |
|
NO |
|
Erosion of natural deposits |
|
(pCi/L) |
|
|
|
|
|
|
|
|
|
||||||||
|
|
|
|
|
|
|
|
|
|
|
|
|
|
|
|
|
|
VOLATILE ORGANIC CONTAMINANTS (VOC) |
|
|
|
|
|
|
|
|
|||||||||
VOCs (ppb)* |
|
0 |
0 |
|
|
ND |
|
N/A |
|
N/A |
|
2019 |
|
NO |
|
Discharge from factories |
|
*VOCs include list of 25 contaminants. |
|
|
|
|
|
|
|
|
|
|
|
|
|||||
|
|
|
|
|
|
|
|
|
|
|
|
|
|
|
|
|
|
MONITORING WAIVERS* |
|
|
|
|
|
|
|
|
|
|
|
|
|||||
Contaminants |
|
|
|
|
Frequency |
|
|
Last Sampled |
|
|
Violation |
|
|||||
|
|
|
|
|
|
|
|
|
|
|
|
|
|
|
|
|
|
Inorganic Chemicals (IOC) |
|
|
|
|
Every 9 years. |
|
2017 |
|
|
|
NO |
|
|||||
|
|
|
|
|
|
|
|
|
|
|
|
|
|
|
|
||
Synthetic Organic Chemicals (SOC) |
|
|
Every 3 or 9 years.** |
|
2017 |
|
|
|
NO |
|
|||||||
|
|
|
|
|
|
|
|
|
|
|
|
|
|
|
|
|
|
*The Washington State Department of Health reduced the monitoring requirements for IOCs and SOCs, because the source is not at risk of contamination. **Pesticides are tested once every three years and herbicides once every nine years.
LEAD & COPPER
2020 Drinking Water Results
The water quality information presented in the table(s) is from the most recent round of testing done according to the regulations. All data shown were collected during the last calendar year unless otherwise noted in the table(s).
Contaminants |
MCLG |
MCL |
Alger |
Range of Detection |
Sample Date |
Violation |
Typical Source of Contaminant |
||
Lowest |
Highest |
||||||||
|
|
|
|
|
|
|
|||
DISINFECTANT RESIDUAL |
|
|
|
|
|
|
|||
Total Chlorine |
4 |
4 |
0.43 |
0.11 |
0.93 |
2020 |
NO |
Measure of disinfectant |
|
Residual (ppm) |
added to water |
||||||||
|
|
|
|
|
|
|
|||
Alger’s water contains ammonia and when chlorine is added for disinfection, chloramines are formed. Total chlorine is measured with each coliform sample.
MICROBIOLOGICAL CONTAMINANTS
Total Coliform |
0 |
1 |
0 |
0 |
0 |
2020 |
NO |
Naturally present in the environment |
|
Bacteria |
Positive |
||||||||
|
|
|
|
|
|
|
Skagit PUD collects one compliance sample per month for total coliforms and E. coli from the distribution system. No total coliforms or E. coli were detected in 2020.
DISINFECTION
Total |
|
|
|
|
|
|
|
||
Trihalomethanes |
N/A |
80 |
15.5 |
N/A |
N/A |
2020 |
NO |
||
water chlorination |
|||||||||
(ppb) |
|
|
|
|
|
|
|
||
|
|
|
|
|
|
|
|
||
Haloacetic Acids |
N/A |
60 |
4.3 |
N/A |
N/A |
2020 |
NO |
||
(5) (ppb) |
water chlorination |
||||||||
|
|
|
|
|
|
|
Disinfection
INORGANIC CONTAMINANTS
Arsenic (ppb)* |
0 |
10 |
6 |
N/A |
N/A |
2017 |
NO |
Erosion of natural deposits |
|
|
|
|
|
|
|
|
|
|
|
Nitrate (ppm) |
10 |
10 |
ND |
N/A |
N/A |
2020 |
NO |
Erosion of natural deposits |
|
Total Dissolved |
500 |
500 |
122 |
N/A |
N/A |
2017 |
NO |
Erosion of natural deposits |
|
Solids (ppm) |
|||||||||
|
|
|
|
|
|
|
|
*Your drinking water currently meets EPA's standards for arsenic. However, it does contain low levels of arsenic. There is a slight chance that some people who drink water containing low levels of arsenic for many years could develop circulatory diseases, cancer, or other health problems. Most types of cancer and circulatory diseases are due to factors other than exposure to arsenic. EPA's standard balances the current understanding of arsenic's health effects against the cost of removing arsenic from drinking water.
Contaminants |
MGLG |
AL |
Alger |
Sample Date |
# Samples |
Violation |
Typical Sources |
|
(90th %) |
Exceeding AL |
|||||||
|
|
|
|
|
|
|||
|
|
|
|
|
|
|
|
|
Lead – lead at |
0 |
15 |
1* |
2018 |
0 of 5 |
NO |
Corrosion of household plumbing |
|
consumer’s tap (ppb) |
systems; erosion of natural deposits |
|||||||
|
|
|
|
|
|
|||
Copper – copper at |
1.3 |
1.3 |
0.06* |
2018 |
0 of 5 |
NO |
Corrosion of household plumbing |
|
consumer’s tap (ppm) |
systems; erosion of natural deposits |
|||||||
|
|
|
|
|
|
|||
|
|
|
|
|
|
|
|
*The 90th percentile level is the highest result obtained in 90% of the samples collected when ranked lowest to highest. Skagit PUD is required to collect five samples for lead and copper from household taps every three years.
Susceptibility rating of potential threats to the safety of our water supply: High
See Source Water Assessment Program data on the Department of Health
How to Read the Water Quality Data Table
EPA establishes the safe drinking water regulations that limit the amount of contaminants allowed in drinking water. The tables show the concentrations of detected substances in comparison to regulatory limits. Substances not detected are not included in the table.
Maximum Contaminant Level (MCL): The highest level of a contaminant that is allowed in drinking water. MCLs are set as close to the MCLGs as feasible using the best available treatment technology.
Maximum Contaminant Level Goal (MCLG): The level of a contaminant in drinking water below which there is no know or expected risk to health. MCLGs allow for a margin of safety.
Action Level (AL): The concentration of a contaminant which, if exceeded, triggers treatment or other requirements which a system must follow.
Units in the Table: ppm is parts per million (or 1 drop in 1 million gallons), ppb is parts per billion (or 1 drop in 1 billion gallons)
18 | WATER QUALITY REPORT 2020 |
WATER QUALITY REPORT 2020 | 19 |
CEDARGROVE PUBLIC WATER SYSTEM: ID# 119174
Contaminants MCLG MCL |
Cedargrove |
Range of Detection |
Sample Date Violation Typical Source of Contaminant |
||
Lowest |
Highest |
||||
|
|
|
|||
SOURCE & TREATMENT
Cedargrove water system is located on the south side of Skagit River near Concrete, serving nearly 200 residential connections. The source water is drawn from a
of 270,000 gallons for fire protection and system storage. Chlorine residual is maintained throughout the distribution system to sustain disinfection.
WATER QUALITY
Currently, the drinking water quality meets all primary and secondary drinking water standards. Overall, the water is considered moderately hard with hardness at 86.9 mg/l (as calcium carbonate). Once a month, a routine distribution sample is tested for total coliform and E. coli. The chlorine
residual levels are
The Washington State Department of Health has granted the Cedargrove system waivers for asbestos, complete inorganics, volatile organics, herbicides, pesticides, and soil fumigants. It’s tested for these every three, six, or nine years. Most of these contaminants are
Radium 228 |
0 |
|
5 |
|
ND |
|
N/A |
N/A |
2015 |
|
NO |
Erosion of natural deposits |
|
|||
(pCi/L) |
|
|
|
|
|
|||||||||||
|
|
|
|
|
|
|
|
|
|
|
|
|
|
|
|
|
SYNTHETIC ORGANIC CONTAMINANTS (SOC) |
|
|
|
|
|
|
|
|
||||||||
Herbicides (ppb)* |
0 |
|
0 |
|
ND |
|
N/A |
|
N/A |
|
2016 |
|
NO |
|
Run off from herbicides |
|
*SOCs include list of 11 contaminants. |
|
|
|
|
|
|
|
|
|
|
|
|
||||
|
|
|
|
|
|
|
|
|
|
|
|
|
|
|
|
|
MONITORING WAIVERS* |
|
|
|
|
|
|
|
|
|
|
|
|
|
|
||
Contaminants |
|
|
|
Frequency |
|
|
Last Sampled |
|
|
Violation |
|
|||||
Volatile Organic Chemicals (VOC) |
|
|
Every 6 years |
|
2019 |
|
|
|
NO |
|
||||||
Inorganic Chemicals (IOC) |
|
|
|
Every 9 years. |
|
2019 |
|
|
|
NO |
|
|||||
Synthetic Organic Chemicals (SOC) |
|
Every 3 or 9 years.** |
|
2016 |
|
|
|
NO |
|
|||||||
|
|
|
|
|
|
|
|
|
|
|
|
|
|
|
|
|
*The Washington State Department of Health reduced the monitoring requirements for IOCs and SOCs, because the source is not at risk of contamination. **Pesticides are tested once every three years and herbicides once every nine years.
LEAD & COPPER
Contaminants |
MGLG |
AL |
Cedargrove |
Sample Date |
# Samples |
Violation |
Typical Sources |
|
(90th %) |
Exceeding AL |
|||||||
|
|
|
|
|
|
|||
Lead – lead at |
0 |
15 |
0.95* |
2020 |
0 of 5 |
NO |
Corrosion of household plumbing |
|
consumer’s tap (ppb) |
systems; erosion of natural deposits |
|||||||
|
|
|
|
|
|
|||
|
|
|
|
|
|
|
|
|
Copper – copper at |
1.3 |
1.3 |
0.097* |
2020 |
0 of 5 |
NO |
Corrosion of household plumbing |
|
|
|
2020 DRINKING WATER RESULTS
The water quality information presented in the table(s) is from the most recent round of testing done according to the regulations. All data shown were collected during the last calendar year unless otherwise noted in the table(s).
Contaminants |
MCLG |
MCL |
Cedargrove |
Range of Detection |
Sample Date |
Violation |
Typical Source of Contaminant |
||
Lowest |
Highest |
||||||||
|
|
|
|
|
|
|
|||
DISINFECTANT RESIDUAL |
|
|
|
|
|
|
|||
Free Chlorine |
4 |
4 |
0.55 |
0.3 |
1.0 |
2020 |
NO |
Measure of disinfectant |
|
Residual (ppm) |
added to water |
||||||||
|
|
|
|
|
|
|
|||
MICROBIOLOGICAL CONTAMINANTS |
|
|
|
|
|
||||
Total Coliform |
0 |
1 |
0 |
0 |
0 |
2020 |
NO |
Naturally present in the environment |
|
Bacteria |
Positive |
||||||||
|
|
|
|
|
|
|
|||
Skagit PUD collects one compliance sample per month for total coliforms and E. coli from the distribution system. No total coliforms or E. coli were detected in 2020.
DISINFECTION
Total |
|
|
|
|
|
|
|
||
Trihalomethanes |
N/A |
80 |
20.3 |
N/A |
N/A |
2020 |
NO |
||
water chlorination |
|||||||||
(ppb) |
|
|
|
|
|
|
|
||
|
|
|
|
|
|
|
|
||
Haloacetic Acids |
N/A |
60 |
8.4 |
N/A |
N/A |
2020 |
NO |
||
(5) (ppb) |
water chlorination |
||||||||
|
|
|
|
|
|
|
Disinfection
INORGANIC CONTAMINANTS
Manganese (ppm)* |
|
0 |
0.05 |
0.04 |
N/A |
N/A |
2020 |
|
NO |
Erosion of natural deposits |
Nitrate (ppm) |
|
10 |
10 |
0.3 |
N/A |
N/A |
2020 |
|
NO |
Erosion of natural deposits |
*Manganese sample is collected once every three years to establish removal from finished water. |
|
|
||||||||
RADIONUCLIDES |
|
|
|
|
|
|
|
|
|
|
Gross Alpha |
|
0 |
15 |
ND |
N/A |
N/A |
2015 |
|
NO |
Erosion of natural deposits |
(pCi/L) |
|
|
||||||||
|
|
|
|
|
|
|
|
|
|
|
Gross Beta |
|
0 |
50 |
ND |
N/A |
N/A |
2015 |
|
NO |
Erosion of natural deposits |
(pCi/L) |
|
|
||||||||
|
|
|
|
|
|
|
|
|
|
|
consumer’s tap (ppm) |
systems; erosion of natural deposits |
*The 90th percentile level is the highest result obtained in 90% of the samples collected when ranked lowest to highest. Skagit PUD is required to collect five samples for lead and copper from household taps every three years.
Susceptibility rating of potential threats to the safety of our water supply: Low
See Source Water Assessment Program data on the Department of Health
How to Read the Water Quality Data Table
EPA establishes the safe drinking water regulations that limit the amount of contaminants allowed in drinking water. The tables show the concentrations of detected substances in comparison to regulatory limits. Substances not detected are not included in the table.
Maximum Contaminant Level (MCL): The highest level of a contaminant that is allowed in drinking water. MCLs are set as close to the MCLGs as feasible using the best available treatment technology.
Maximum Contaminant Level Goal (MCLG): The level of a contaminant in drinking water below which there is no know or expected risk to health. MCLGs allow for a margin of safety.
Action Level (AL): The concentration of a contaminant which, if exceeded, triggers treatment or other requirements which a system must follow.
Units in the Table: ppm is parts per million (or 1 drop in 1 million gallons), ppb is parts per billion (or 1 drop in 1 billion gallons)
20 | WATER QUALITY REPORT 2020 |
WATER QUALITY REPORT 2020 | 21 |
FIDALGO ISLAND PUBLIC WATER SYSTEM: ID# 00932Y
SOURCE & TREATMENT
The Fidalgo water system is located on Fidalgo Island in western Skagit County and serves 717 residential and commercial connections. Water is purchased through an intertie with Anacortes, with their source being the Skagit River in Mount Vernon. Their water is filtered and chlorinated at the Anacortes water treatment plant on Riverbend Road. Free chlorine residual is maintained throughout our distribution system to provide sufficient disinfection.
WATER QUALITY
Currently, the drinking water quality meets all primary and secondary drinking water standards.
Fidalgo water is considered soft with a hardness of 23 mg/l (as calcium carbonate).
Two routine samples a month are tested for total coliform and E. coli. Chlorine residual levels are between
2020 DRINKING WATER RESULTS
The water quality information presented in the table(s) is from the most recent round of testing done according to the regulations. All data shown were collected during the last calendar year unless otherwise noted in the table(s).
Water is produced by the city of Anacortes water treatment plant. A more detailed water quality report can be found on their website at
Contaminants |
MCLG |
MCL |
Fidalgo |
Range of Detection |
Sample Date |
Violation |
Typical Source of Contaminant |
||
Island |
Lowest |
Highest |
|||||||
|
|
|
|
|
|
||||
DISINFECTANT RESIDUAL |
|
|
|
|
|
|
|||
Free Chlorine |
4 |
4 |
0.87 |
0.53 |
1.15 |
2020 |
NO |
Measure of disinfectant |
|
Residual (ppm) |
added to water |
||||||||
|
|
|
|
|
|
|
|||
MICROBIOLOGICAL CONTAMINANTS |
|
|
|
|
|
||||
Total Coliform |
0 |
1 |
0 |
0 |
0 |
2020 |
NO |
Naturally present in the environment |
|
Bacteria |
Positive |
||||||||
|
|
|
|
|
|
|
|||
Skagit PUD collects two compliance samples per month for total coliforms and E. coli from the distribution system. No total coliforms or E. coli were detected in 2020.
DISINFECTION
Total |
|
|
|
|
|
|
|
|
|
|
|
|
|
|
Trihalomethanes |
|
N/A |
|
80 |
|
|
23.4 |
|
N/A |
|
N/A |
2020 |
NO |
|
|
|
|
|
|
|
water chlorination |
||||||||
(ppb) |
|
|
|
|
|
|
|
|
|
|
|
|
|
|
|
|
|
|
|
|
|
|
|
|
|
|
|
|
|
Haloacetic Acids |
|
N/A |
|
60 |
|
|
11.2 |
|
N/A |
|
N/A |
2020 |
NO |
|
(5) (ppb) |
|
|
|
|
|
|
water chlorination |
|||||||
|
|
|
|
|
|
|
|
|
|
|
|
|
||
|
|
|
|
|
|
|
|
|
|
|
|
|
|
|
LEAD & COPPER |
|
|
|
|
|
|
|
|
|
|
|
|
|
|
Contaminants |
|
MGLG |
|
AL |
Fidalgo Island |
Sample Date |
# Samples |
Violation |
Typical Sources |
|||||
|
|
|
|
|
|
|
(90th %) |
|
|
|
Exceeding AL |
|
|
|
Lead – lead at |
|
0 |
|
15 |
1* |
|
|
2018 |
0 of 10 |
NO |
Corrosion of household plumbing |
|||
consumer’s tap (ppb) |
|
|
|
|
systems; erosion of natural deposits |
|||||||||
|
|
|
|
|
|
|
|
|
|
|
|
|||
|
|
|
|
|
|
|
|
|
|
|
|
|
|
|
Copper – copper at |
|
1.3 |
|
1.3 |
0.13* |
|
2018 |
0 of 10 |
NO |
Corrosion of household plumbing |
||||
consumer’s tap (ppm) |
|
|
|
systems; erosion of natural deposits |
||||||||||
|
|
|
|
|
|
|
|
|
|
|
|
|||
|
|
|
|
|
|
|
|
|
|
|
|
|
|
|
*The 90th percentile level is the highest result obtained in 90% of the samples collected when ranked lowest to highest. Skagit PUD is required to collect five samples for lead and copper from household taps every three years.
How to Read the Water Quality Data Table
EPA establishes the safe drinking water regulations that limit the amount of contaminants allowed in drinking water. The tables show the concentrations of detected substances in comparison to regulatory limits. Substances not detected are not included in the table.
Maximum Contaminant Level (MCL): The highest level of a contaminant that is allowed in drinking water. MCLs are set as close to the MCLGs as feasible using the best available treatment technology.
Maximum Contaminant Level Goal (MCLG): The level of a contaminant in drinking water below which there is no know or expected risk to health. MCLGs allow for a margin of safety.
Action Level (AL): The concentration of a contaminant which, if exceeded, triggers treatment or other requirements which a system must follow.
Units in the Table: ppm is parts per million (or 1 drop in 1 million gallons), ppb is parts per billion (or 1 drop in 1 billion gallons)
22 | WATER QUALITY REPORT 2020 |
WATER QUALITY REPORT 2020 | 23 |
MARBLEMOUNT PUBLIC WATER SYSTEM: ID# AA642
LEAD & COPPER
SOURCE & TREATMENT
The Marblemount water system is located on the North Cascades Highway, serving 18 residential and 14
WATER QUALITY
Currently, the drinking water quality meets all primary and secondary drinking water standards. Marblemount water is considered soft with a hardness of 50.7 mg/l (calcium carbonate) and a pH level of
Once a month, a routine distribution sample is tested for total coliform and E. coli. Once a year, nitrate levels are measured and found to be very low (below
0.5 mg/l). The system is on a
The Washington State Department of Health has granted the Marblemount water system waivers for asbestos, complete inorganics, volatile organics, herbicides, pesticides, and soil fumigants. These components are tested for every three, six, or nine years. Most of these contaminants are
Contaminants |
MGLG |
AL |
Marblemount |
Sample Date |
# Samples |
Violation |
Typical Sources |
|
(90th %) |
Exceeding AL |
|||||||
|
|
|
|
|
|
|||
|
|
|
|
|
|
|
|
|
Lead – lead at |
0 |
15 |
0.6* |
2020 |
0 of 5 |
NO |
Corrosion of household plumbing |
|
consumer’s tap (ppb) |
systems; erosion of natural deposits |
|||||||
|
|
|
|
|
|
|||
Copper – copper at |
1.3 |
1.3 |
0.13* |
2020 |
0 of 5 |
NO |
Corrosion of household plumbing |
|
consumer’s tap (ppm) |
systems; erosion of natural deposits |
|||||||
|
|
|
|
|
|
|||
|
|
|
|
|
|
|
|
*The 90th percentile level is the highest result obtained in 90% of the samples collected when ranked lowest to highest. Skagit PUD is required to collect five samples for lead and copper from household taps every three years.
Susceptibility rating of potential threats to the safety of our water supply: Low
See Source Water Assessment Program data on the Department of Health
How to Read the Water Quality Data Table
EPA establishes the safe drinking water regulations that limit the amount of contaminants allowed in drinking water. The tables show the concentrations of detected substances in comparison to regulatory limits. Substances not detected are not included in the table.
Maximum Contaminant Level (MCL): The highest level of a contaminant that is allowed in drinking water. MCLs are set as close to the MCLGs as feasible using the best available treatment technology.
2020 DRINKING WATER RESULTS
The water quality information presented in the table(s) is from the most recent round of testing done according to the regulations. All data shown were collected during the last calendar year unless otherwise noted in the table(s).
Contaminants |
MCLG |
MCL |
Marblemount |
Range of Detection |
Sample Date |
Violation |
Typical Source of Contaminant |
||
Lowest |
Highest |
||||||||
MICROBIOLOGICAL CONTAMINANTS |
|
|
|
|
|
||||
Total Coliform |
0 |
1 |
0 |
0 |
0 |
2020 |
NO |
Naturally present in the environment |
|
Bacteria |
Positive |
||||||||
|
|
|
|
|
|
|
|||
Skagit PUD collects one compliance sample per month for total coliforms and E. coli from the distribution system. No total coliforms or E. coli were detected in 2020.
INORGANIC CONTAMINANTS
Nitrate (ppm) |
|
10 |
10 |
|
0.12 |
|
N/A |
|
N/A |
2020 |
|
NO |
|
Erosion of natural deposits |
|
|
RADIONUCLIDES |
|
|
|
|
|
|
|
|
|
|
|
|
|
|
|
|
Gross Alpha |
|
0 |
15 |
|
ND |
|
N/A |
|
N/A |
2018 |
|
NO |
|
Erosion of natural deposits |
|
|
(pCi/L) |
|
|
|
|
|
|
|
|||||||||
|
|
|
|
|
|
|
|
|
|
|
|
|
|
|
|
|
Gross Beta |
|
0 |
50 |
|
ND |
|
N/A |
|
N/A |
2018 |
|
NO |
|
Erosion of natural deposits |
|
|
(pCi/L) |
|
|
|
|
|
|
|
|||||||||
|
|
|
|
|
|
|
|
|
|
|
|
|
|
|
|
|
Radium 228 |
|
0 |
5 |
|
ND |
|
N/A |
|
N/A |
2018 |
|
NO |
|
Erosion of natural deposits |
|
|
(pCi/L) |
|
|
|
|
|
|
|
|||||||||
|
|
|
|
|
|
|
|
|
|
|
|
|
|
|
|
|
VOLATILE ORGANIC CONTAMINANTS (VOC) |
|
|
|
|
|
|
|
|
||||||||
VOCs (ppb) |
|
0 |
0 |
|
ND |
|
N/A |
|
N/A |
2016 |
|
NO |
|
Discharge from factories |
|
|
|
|
|
|
|
|
|
|
|
|
|
|
|
|
|||
MONITORING WAIVERS* |
|
|
|
|
|
|
|
|
|
|
|
|
||||
Contaminants |
|
|
|
Frequency |
|
|
Last Sampled |
|
|
Violation |
|
|||||
|
|
|
|
|
|
|
|
|
|
|
|
|
||||
Inorganic Chemicals (IOC) |
|
|
|
Every 9 years. |
|
|
2017 |
|
|
|
NO |
|
||||
|
|
|
|
|
|
|
|
|
|
|
||||||
Synthetic Organic Chemicals (SOC) |
|
Every 3 or 9 years.** |
|
|
2012 |
|
|
|
NO |
|
||||||
|
|
|
|
|
|
|
|
|
|
|
|
|
|
|
|
|
*The Washington State Department of Health reduced the monitoring requirements for IOCs and SOCs, because the source is not at risk of contamination. **Pesticides are tested once every three years and herbicides once every nine years.
Maximum Contaminant Level Goal (MCLG): The level of a contaminant in drinking water below which there is no know or expected risk to health. MCLGs allow for a margin of safety.
Action Level (AL): The concentration of a contaminant which, if exceeded, triggers treatment or other requirements which a system must follow.
Units in the Table: ppm is parts per million (or 1 drop in 1 million gallons), ppb is parts per billion (or 1 drop in 1 billion gallons)
24 | WATER QUALITY REPORT 2020 |
WATER QUALITY REPORT 2020 | 25 |
POTLATCH PUBLIC WATER SYSTEM: ID# 69034L
MONITORING WAIVERS*
SOURCE & TREATMENT
Potlatch water system is located on the west shore of Guemes Island and serves 33 residential connections. Seawater from Bellingham Channel is the supply source. The treatment process consists of a multimedia filter,
WATER QUALITY
Currently, the drinking water quality meets all primary and secondary drinking water standards. Overall the water is considered soft with a hardness
of 19.6 mg/l (as calcium carbonate).
Once a month, a routine distribution sample is tested for total coliform and E. coli. Chlorine residual levels are between
The Washington State Department of Health has granted the Potlatch water system waivers for complete inorganics, soil fumigants, pesticides, volatile organics, herbicides, and asbestos. The system is tested for these contaminants every three, six, or nine years.
Contaminants |
Frequency |
Last Sampled |
Violation |
Synthetic Organic Chemicals (SOC) |
Every 3 or 9 years.* |
2013 |
NO |
*The Washington State Department of Health reduced the monitoring requirements for SOCs, because the source is not at risk of contamination. Pesticides are tested once every three years and herbicides once every nine years.
LEAD & COPPER
Contaminants |
MGLG |
AL |
Potlatch |
Sample Date |
# Samples |
Violation |
Typical Sources |
|
(90th %) |
Exceeding AL |
|||||||
|
|
|
|
|
|
|||
Lead – lead at |
0 |
15 |
1* |
2020 |
0 of 5 |
NO |
Corrosion of household plumbing |
|
consumer’s tap (ppb) |
systems; erosion of natural deposits |
|||||||
|
|
|
|
|
|
|||
|
|
|
|
|
|
|
|
|
Copper – copper at |
1.3 |
1.3 |
0.04* |
2020 |
0 of 5 |
NO |
Corrosion of household plumbing |
|
consumer’s tap (ppm) |
systems; erosion of natural deposits |
|||||||
|
|
|
|
|
|
|||
|
|
|
|
|
|
|
|
*The 90th percentile level is the highest result obtained in 90% of the samples collected when ranked lowest to highest. Skagit PUD is required to collect five samples for lead and copper from household taps every three years.
Susceptibility rating of potential threats to the safety of our water supply: High
See Source Water Assessment Program data on the Department of Health
2020 DRINKING WATER RESULTS
The water quality information presented in the table(s) is from the most recent round of testing done according to the regulations. All data shown were collected during the last calendar year unless otherwise noted in the table(s).
Contaminants |
MCLG |
MCL |
Potlatch |
Range of Detection |
Sample Date |
Violation |
Typical Source of Contaminant |
||
Lowest |
Highest |
||||||||
|
|
|
|
|
|
|
|||
DISINFECTANT RESIDUAL |
|
|
|
|
|
|
|||
Free Chlorine |
4 |
4 |
0.34 |
0.24 |
0.59 |
2020 |
NO |
Measure of disinfectant |
|
Residual (ppm) |
added to water |
||||||||
|
|
|
|
|
|
|
|||
MICROBIOLOGICAL CONTAMINANTS |
|
|
|
|
|
||||
Total Coliform |
0 |
1 |
0 |
0 |
0 |
2020 |
NO |
Naturally present in the environment |
|
Bacteria |
Positive |
||||||||
|
|
|
|
|
|
|
|||
Skagit PUD collects one compliance sample per month for total coliforms and E. coli from the distribution system. No total coliforms or E. coli were detected in 2020.
DISINFECTION
Total |
|
|
|
|
|
|
|
||
Trihalomethanes |
N/A |
80 |
1.2 |
N/A |
N/A |
2020 |
NO |
||
water chlorination |
|||||||||
(ppb) |
|
|
|
|
|
|
|
||
|
|
|
|
|
|
|
|
||
Haloacetic Acids |
N/A |
60 |
ND |
N/A |
N/A |
2020 |
NO |
||
(5) (ppb) |
water chlorination |
||||||||
|
|
|
|
|
|
|
Disinfection
INORGANIC CONTAMINANTS
Chloride |
|
250 |
250 |
86.6 |
|
N/A |
N/A |
2020 |
NO |
Saltwater intrusion |
Nitrate (ppm) |
|
10 |
10 |
ND |
|
N/A |
N/A |
2020 |
NO |
Erosion of natural deposits |
Sodium (ppm) |
|
N/A |
N/A |
33.7 |
|
N/A |
N/A |
2015 |
NO |
Naturally occurring, water softeners, |
|
|
animal waste, road salts |
||||||||
|
|
|
|
|
|
|
|
|
|
|
Total Dissolved |
|
500 |
500 |
116 |
|
N/A |
N/A |
2015 |
NO |
Erosion of natural deposits |
Solids (TDS) (ppm) |
|
|
||||||||
|
|
|
|
|
|
|
|
|
|
|
RADIONUCLIDES |
|
|
|
|
|
|
|
|
|
|
Gross Alpha |
|
0 |
15 |
ND |
|
N/A |
N/A |
2015 |
NO |
Erosion of natural deposits |
(pCi/L) |
|
|
||||||||
|
|
|
|
|
|
|
|
|
|
|
Radium 228 |
|
0 |
5 |
ND |
|
N/A |
N/A |
2015 |
NO |
Erosion of natural deposits |
(pCi/L) |
|
|
||||||||
|
|
|
|
|
|
|
|
|
|
|
VOLATILE ORGANIC CONTAMINANTS (VOC) |
|
|
|
|
|
|||||
VOCs (ppb) |
|
0 |
0 |
ND |
|
N/A |
N/A |
2016 |
NO |
Discharge from factories |
How to Read the Water Quality Data Table
EPA establishes the safe drinking water regulations that limit the amount of contaminants allowed in drinking water. The tables show the concentrations of detected substances in comparison to regulatory limits. Substances not detected are not included in the table.
Maximum Contaminant Level (MCL): The highest level of a contaminant that is allowed in drinking water. MCLs are set as close to the MCLGs as feasible using the best available treatment technology.
Maximum Contaminant Level Goal (MCLG): The level of a contaminant in drinking water below which there is no know or expected risk to health. MCLGs allow for a margin of safety.
Action Level (AL): The concentration of a contaminant which, if exceeded, triggers treatment or other requirements which a system must follow.
Units in the Table: ppm is parts per million (or 1 drop in 1 million gallons), ppb is parts per billion (or 1 drop in 1 billion gallons)
26 | WATER QUALITY REPORT 2020 |
WATER QUALITY REPORT 2020 | 27 |
ROCKPORT PUBLIC WATER SYSTEM: ID# 736006
Contaminants MCLG MCL |
Rockport |
Range of Detection |
Sample Date Violation Typical Source of Contaminant |
||
Lowest |
Highest |
||||
|
|
|
|||
SOURCE & TREATMENT
The Rockport water system is located along the North Cascades Highway serving around 54 residential and six
a filtration system. Chlorine residual is maintained throughout the distribution system to maintain disinfection.
Water Quality
Currently, the drinking water quality meets all primary and secondary drinking water standards. Rockport water is considered moderately hard with a hardness of 109 mg/l (calcium carbonate), and pH levels are between
Once a month, a routine distribution sample is tested for total coliform and E. coli. Chlorine residual
levels are between
The Washington State Department of Health has granted the Rockport water system waivers for asbestos, complete inorganics, volatile organics, herbicides, pesticides, and soil fumigants. It’s tested for these parameters every three, six, or nine years with these contaminates being
Synthetic Organic Contaminants (SOC) |
|
|
|
|
|
|
|
|
|||||||
Herbicides (ppb)* |
0 |
|
0 |
|
ND |
|
N/A |
N/A |
|
2016 |
|
NO |
|
Run off from herbicides |
|
*SOCs include list of 11 contaminants. |
|
|
|
|
|
|
|
|
|
|
|
||||
|
|
|
|
|
|
|
|
|
|
|
|
|
|
|
|
MONITORING WAIVERS* |
|
|
|
|
|
|
|
|
|
|
|
|
|
||
Contaminants |
|
|
|
Frequency |
|
|
Last Sampled |
|
|
Violation |
|
||||
|
|
|
|
|
|
|
|
|
|
|
|
|
|
|
|
Volatile Organic Chemicals (VOC) |
|
|
Every 6 years. |
|
2019 |
|
|
|
NO |
|
|||||
|
|
|
|
|
|
|
|
|
|
|
|
|
|
|
|
Inorganic Chemicals (IOC) |
|
|
|
Every 9 years. |
|
2019 |
|
|
|
NO |
|
||||
|
|
|
|
|
|
|
|
|
|
|
|
|
|
|
|
*The Washington State Department of Health reduced the monitoring requirements for IOCs and VOCs, because the source is not at risk of contamination.
LEAD & COPPER
Contaminants |
MGLG |
AL |
Rockport |
Sample Date |
# Samples |
Violation |
Typical Sources |
|
(90th %) |
Exceeding AL |
|||||||
|
|
|
|
|
|
|||
|
|
|
|
|
|
|
|
|
Lead – lead at |
0 |
15 |
1.5* |
2020 |
0 of 5 |
NO |
Corrosion of household plumbing |
|
consumer’s tap (ppb) |
systems; erosion of natural deposits |
|||||||
|
|
|
|
|
|
|||
|
|
|
|
|
|
|
|
|
Copper – copper at |
1.3 |
1.3 |
0.23* |
2020 |
0 of 5 |
NO |
Corrosion of household plumbing |
|
consumer’s tap (ppm) |
systems; erosion of natural deposits |
|||||||
|
|
|
|
|
|
*The 90th percentile level is the highest result obtained in 90% of the samples collected when ranked lowest to highest. Skagit PUD is required to collect five samples for lead and copper from household taps every three years.
2020 DRINKING WATER RESULTS
The water quality information presented in the table(s) is from the most recent round of testing done according to the regulations. All data shown were collected during the last calendar year unless otherwise noted in the table(s).
Contaminants |
MCLG |
MCL |
Rockport |
Range of Detection |
Sample Date |
Violation |
Typical Source of Contaminant |
||
Lowest |
Highest |
||||||||
|
|
|
|
|
|
|
|||
DISINFECTANT RESIDUAL |
|
|
|
|
|
|
|||
Free Chlorine |
4 |
4 |
0.64 |
0.11 |
1.11 |
2020 |
NO |
Measure of disinfectant |
|
Residual (ppm) |
added to water |
||||||||
|
|
|
|
|
|
|
|||
MICROBIOLOGICAL CONTAMINANTS |
|
|
|
|
|
||||
Total Coliform |
0 |
1 |
0 |
0 |
0 |
2020 |
NO |
Naturally present in the environment |
|
Bacteria |
Positive |
||||||||
|
|
|
|
|
|
|
|||
Skagit PUD collects one compliance sample per month for total coliforms and E. coli from the distribution system. No total coilforms or E. coli were detected in 2020
DISINFECTION
Total |
|
|
|
|
|
|
|
||
Trihalomethanes |
N/A |
80 |
5.5 |
N/A |
N/A |
2020 |
NO |
||
water chlorination |
|||||||||
(ppb) |
|
|
|
|
|
|
|
||
|
|
|
|
|
|
|
|
||
Haloacetic Acids |
N/A |
60 |
3.5 |
N/A |
N/A |
2020 |
NO |
||
(5) (ppb) |
water chlorination |
||||||||
|
|
|
|
|
|
|
Disinfection
INORGANIC CONTAMINANTS
Nitrate (ppm) |
|
10 |
10 |
ND |
N/A |
N/A |
2020 |
NO |
Erosion of natural deposits |
RADIONUCLIDES |
|
|
|
|
|
|
|
|
|
Gross Alpha |
|
0 |
15 |
ND |
N/A |
N/A |
2015 |
NO |
Erosion of natural deposits |
(pCi/L) |
|
||||||||
|
|
|
|
|
|
|
|
|
|
Gross Beta |
|
0 |
50 |
ND |
N/A |
N/A |
2015 |
NO |
Erosion of natural deposits |
(pCi/L) |
|
||||||||
|
|
|
|
|
|
|
|
|
|
Radium 228 |
|
0 |
5 |
ND |
N/A |
N/A |
2015 |
NO |
Erosion of natural deposits |
(pCi/L) |
|
||||||||
|
|
|
|
|
|
|
|
|
|
Susceptibility rating of potential threats to the safety of our water supply: Low
See Source Water Assessment Program data on the Department of Health
How to Read the Water Quality Data Table
EPA establishes the safe drinking water regulations that limit the amount of contaminants allowed in drinking water. The tables show the concentrations of detected substances in comparison to regulatory limits. Substances not detected are not included in the table.
Maximum Contaminant Level (MCL): The highest level of a contaminant that is allowed in drinking water. MCLs are set as close to the MCLGs as feasible using the best available treatment technology.
Maximum Contaminant Level Goal (MCLG): The level of a contaminant in drinking water below which there is no know or expected risk to health. MCLGs allow for a margin of safety.
Action Level (AL): The concentration of a contaminant which, if exceeded, triggers treatment or other requirements which a system must follow.
Units in the Table: ppm is parts per million (or 1 drop in 1 million gallons), ppb is parts per billion (or 1 drop in 1 billion gallons)
28 | WATER QUALITY REPORT 2020 |
WATER QUALITY REPORT 2020 | 29 |
SKAGIT VIEW VILLAGE PUBLIC WATER SYSTEM: ID# 968795
Contaminants MCLG MCL |
Skagit View |
Range of Detection |
Sample Date Violation Typical Source of Contaminant |
|
Village |
Lowest Highest |
|||
|
|
SOURCE & TREATMENT
The Skagit View Village water system is located on the south side of the Skagit River near Concrete and serves around 70 residential connections. The source water is drawn from a
WATER QUALITY
Currently, the drinking water quality meets all primary and secondary drinking water standards. Overall the water is considered moderately hard, with a hardness of 109.9 mg/l (calcium carbonate), and total dissolved solids are 152 mg/l.
Once a month, distribution samples are tested for total coliform and E. coli. Chlorine residual levels are
a year, nitrate levels are measured and are very low (1 mg/l). The system is on
The Washington State Department of Health has granted the Skagit View Village system waivers for asbestos, inorganics, volatile organics, herbicides, pesticides, and soil fumigants. These components are tested for every three, six, or nine years. Most of the contaminants are
RADIONUCLIDES |
|
|
|
|
|
|
|
|
|
|
|
|
|
|
|
Gross Alpha |
|
0 |
15 |
|
ND |
|
N/A |
|
N/A |
|
2015 |
|
NO |
|
Erosion of natural deposits |
(pCi/L) |
|
|
|
|
|
|
|
||||||||
|
|
|
|
|
|
|
|
|
|
|
|
|
|
|
|
Gross Beta |
|
0 |
50 |
|
ND |
|
N/A |
|
N/A |
|
2015 |
|
NO |
|
Erosion of natural deposits |
(pCi/L) |
|
|
|
|
|
|
|
||||||||
|
|
|
|
|
|
|
|
|
|
|
|
|
|
|
|
Radium 228 |
|
0 |
5 |
|
ND |
|
N/A |
|
N/A |
|
2015 |
|
NO |
|
Erosion of natural deposits |
(pCi/L) |
|
|
|
|
|
|
|
||||||||
|
|
|
|
|
|
|
|
|
|
|
|
|
|
|
|
VOLATILE ORGANIC CONTAMINANTS (VOC) |
|
|
|
|
|
|
|
||||||||
Chloroform (ppb) |
|
80 |
80 |
|
1 |
|
N/A |
|
N/A |
|
2016 |
|
NO |
|
|
|
|
|
|
|
|
|
water chlorination |
||||||||
|
|
|
|
|
|
|
|
|
|
|
|
|
|
|
|
Bromodichloro- |
|
80 |
80 |
|
0.7 |
|
N/A |
|
N/A |
|
2016 |
|
NO |
|
|
methane (ppb) |
|
|
|
|
|
|
|
water chlorination |
|||||||
|
|
|
|
|
|
|
|
|
|
|
|
|
|
||
Chlorodibromo- |
|
80 |
80 |
|
0.5 |
|
N/A |
|
N/A |
|
2016 |
|
NO |
|
|
methane (ppb) |
|
|
|
|
|
|
|
water chlorination |
|||||||
|
|
|
|
|
|
|
|
|
|
|
|
|
|
||
Soil Fumigants |
|
0 |
200 |
|
ND |
|
N/A |
|
N/A |
|
2016 |
|
NO |
Runoff/leaching from soil; fumigant |
|
(ppt) |
|
|
|
|
|
|
|
used on soybeans, orchards, etc. |
|||||||
|
|
|
|
|
|
|
|
|
|
|
|
|
|
||
|
|
|
|
|
|
|
|
|
|
|
|
|
|
|
|
MONITORING WAIVERS* |
|
|
|
|
|
|
|
|
|
|
|
|
|||
Contaminants |
|
|
|
Frequency |
|
|
Last Sampled |
|
|
Violation |
|||||
Inorganic Chemicals (IOC) |
|
|
|
Every 9 years |
|
2016 |
|
|
|
NO |
|||||
|
|
|
|
|
|
|
|
|
|
|
|
|
|
||
Synthetic Organic Chemicals (SOC) |
|
Every 3 or 9 years** |
|
2015 |
|
|
|
NO |
|||||||
|
|
|
|
|
|
|
|
|
|
|
|
|
|
|
|
2020 DRINKING WATER RESULTS
The water quality information presented in the table(s) is from the most recent round of testing done according to the regulations. All data shown were collected during the last calendar year unless otherwise noted in the table(s).
Contaminants |
MCLG |
MCL |
Skagit View |
Range of Detection |
Sample Date |
Violation |
Typical Source of Contaminant |
||
Village |
Lowest |
Highest |
|||||||
|
|
|
|
|
|
||||
DISINFECTANT RESIDUAL |
|
|
|
|
|
|
|||
Free Chlorine |
4 |
4 |
0.9 |
0.6 |
1.19 |
2020 |
NO |
Measure of disinfectant |
|
Residual (ppm) |
added to water |
||||||||
|
|
|
|
|
|
|
|||
MICROBIOLOGICAL CONTAMINANTS |
|
|
|
|
|
||||
Total Coliform |
0 |
1 |
0 |
0 |
0 |
2020 |
NO |
Naturally present in the environment |
|
Bacteria |
Positive |
||||||||
|
|
|
|
|
|
|
|||
Skagit PUD collects one compliance sample per month for total coliforms and E. coli from the distribution system. No total coliforms or E. coli were detected in 2020.
DISINFECTION
Total |
|
|
|
|
|
|
|
||
Trihalomethanes |
N/A |
80 |
ND |
N/A |
N/A |
2020 |
NO |
||
water chlorination |
|||||||||
(ppb) |
|
|
|
|
|
|
|
||
|
|
|
|
|
|
|
|
||
Haloacetic Acids |
N/A |
60 |
ND |
N/A |
N/A |
2020 |
NO |
||
(5) (ppb) |
water chlorination |
||||||||
|
|
|
|
|
|
|
Disinfection
INORGANIC CONTAMINANTS
Barium (ppm) |
2 |
2 |
0.006 |
N/A |
N/A |
2016 |
NO |
Erosion of natural deposits |
|
Nitrate (ppm) |
10 |
10 |
0.53 |
N/A |
N/A |
2020 |
NO |
Erosion of natural deposits |
|
Sodium (ppm) |
N/A |
N/A |
7.7 |
N/A |
N/A |
2016 |
NO |
Naturally occurring, water softeners, |
|
animal waste, road salts |
|||||||||
|
|
|
|
|
|
|
|
||
Total Dissolved |
500 |
500 |
152 |
N/A |
N/A |
2016 |
NO |
Erosion of natural deposits |
|
Solids (TDS) (ppm) |
|||||||||
|
|
|
|
|
|
|
|
*The Washington State Department of Health reduced the monitoring requirements for IOCs and SOCs, because the source is not at risk of contamination. **Pesticides are tested once every three years and herbicides once every nine years.
LEAD & COPPER
|
|
|
Skagit View |
|
# Samples |
|
|
|
Contaminants |
MGLG |
AL |
Village |
Sample Date |
Violation |
Typical Sources |
||
Exceeding AL |
||||||||
|
|
|
(90th %) |
|
|
|
||
|
|
|
|
|
|
|
||
Lead – lead at |
0 |
15 |
1* |
2018 |
0 of 5 |
NO |
Corrosion of household plumbing |
|
consumer’s tap (ppb) |
systems; erosion of natural deposits |
|||||||
|
|
|
|
|
|
|||
|
|
|
|
|
|
|
|
|
Copper – copper at |
1.3 |
1.3 |
0.8* |
2018 |
0 of 5 |
NO |
Corrosion of household plumbing |
|
consumer’s tap (ppm) |
systems; erosion of natural deposits |
|||||||
|
|
|
|
|
|
*The 90th percentile level is the highest result obtained in 90% of the samples collected when ranked lowest to highest. Skagit PUD is required to collect five samples for lead and copper from household taps every three years.
Susceptibility rating of potential threats to the safety of our water supply: Moderate
See Source Water Assessment Program data on the Department of Health
How to Read the Water Quality Data Table
EPA establishes the safe drinking water regulations that limit the amount of contaminants allowed in drinking water. The tables show the concentrations of detected substances in comparison to regulatory limits. Substances not detected are not included in the table.
Maximum Contaminant Level (MCL): The highest level of a contaminant that is allowed in drinking water. MCLs are set as close to the MCLGs as feasible using the best available treatment technology.
Maximum Contaminant Level Goal (MCLG): The level of a contaminant in drinking water below which there is no know or expected risk to health. MCLGs allow for a margin of safety.
Action Level (AL): The concentration of a contaminant which, if exceeded, triggers treatment or other requirements which a system must follow.
Units in the Table: ppm is parts per million (or 1 drop in 1 million gallons), ppb is parts per billion (or 1 drop in 1 billion gallons)
30 | WATER QUALITY REPORT 2020 |
WATER QUALITY REPORT 2020 | 31 |

HEALTH EFFECTS OF COPPER
Copper is an essential nutrient, but some people who drink water containing copper above the action level over a relatively short amount of time could experience gastrointestinal distress.
- Some people who drink water containing copper in excess of the action level over many years could suffer liver or kidney damage. People with Wilson’s Disease should consult their doctor.
YOU CAN REDUCE YOUR COPPER EXPOSURE BY FLUSHING
It’s recommended that you let the water run before using it for cooking or drinking whenever the household water remains unused for more than six hours. This would include the times when you first get up in the morning or when you come home from work. The longer the water sits in your household pipes, the more copper it may contain.
-
Flushing the faucet means running the
cold-water tap until the water feels as cold as it can get, or for about one minute. Also, avoid cooking with or consuming water from hot water taps as hot water dissolves copper more readily than cold water does.
CROSS-CONNECTION
WHAT CAN YOU DO TO PROTECT THE WATER SUPPLY?
Skagit PUD offers a
- One of the most effective ways to prevent backflow is installing a specialized plumbing assembly directly after the meter called a backflow prevention assembly.
-
However, as users of the water system, there are other ways to help prevent contamination due to backflow. Hose bibbs (outside faucets) that have been installed in the last few years now
include an atmospheric vacuum breaker. The AVB helps tore-direct potentially contaminated water onto the ground instead of entering your private plumbing system in the instance of a backflow occurrence. - Typical situations where this may occur are when filling
a bucket for washing a vehicle, filling a water trough, or cleaning equipment. Life is busy, so sometimes it’s easier to leave the hose in the bucket while filling it up and even leave it there once it’s done. If there is a main break or the fire department withdraws water from a nearby fire hydrant, the water from your private system could be sucked back into the public water supply. If this happens, then anything connected to water, especially the contents of that bucket, is pulled back into the system. The effect is the same as if you suck a beverage through a straw.
- It’s impossible to identify and protect against every water hazard in the PUD’s system; change is constantly happening. However, through information, education, and working together, protecting the water supply is ultimately the joint responsibility of the PUD and its customers.
-
For questions or more information about what you can do to help, please contact Courtney Shilling,
cross-connection control coordinator, at (360)848-2138 or shilling@skagitpud.org.
32 | WATER QUALITY REPORT 2020 |
WATER QUALITY REPORT 2020 | 33 |
WATER USE EFFICIENCY UPDATE
In January 2008, Skagit PUD established measurable
- Our water use efficiency goals and the steps we are taking to meet those goals are as follows:
MEASURES
Skagit PUD’s Water Use Efficiency program for 2020 to 2024 consists of 10 water saving measures. The WUE program reflects a continuation of the measures from the 2014 to 2019 program.
Measure |
Estimated Average Annual Savings 2020 to 2024 |
|||||
2020 |
2021 |
2022 |
2023 |
2024 |
||
|
||||||
|
|
|
|
|
|
|
Public Outreach |
N/Q |
N/Q |
N/Q |
N/Q |
N/Q |
|
|
|
|
|
|
|
|
Indoor Retrofit Kits |
265,020 |
530,040 |
795,060 |
1,060,080 |
1,325,100 |
|
|
|
|
|
|
|
|
Shower Timers |
N/Q |
N/Q |
N/Q |
N/Q |
N/Q |
|
|
|
|
|
|
|
|
School Outreach |
N/Q |
N/Q |
N/Q |
N/Q |
N/Q |
|
|
|
|
|
|
|
|
Toilet Leak Kits |
N/Q |
N/Q |
N/Q |
N/Q |
N/Q |
|
|
|
|
|
|
|
|
Soil Moisture Meters |
N/Q |
N/Q |
N/Q |
N/Q |
N/Q |
|
|
|
|
|
|
|
|
Rain Barrel Program |
21,000 |
42,000 |
63,000 |
84,000 |
105,000 |
|
|
|
|
|
|
|
|
System Leak Detection & Repair |
N/Q |
N/Q |
N/Q |
N/Q |
N/Q |
|
|
|
|
|
|
|
|
Bill Showing Consumption History |
N/Q |
N/Q |
N/Q |
N/Q |
N/Q |
|
|
|
|
|
|
|
|
Large Meter Testing |
N/Q |
N/Q |
N/Q |
N/Q |
N/Q |
|
|
|
|
|
|
|
|
Annual Total |
286,020 |
572,040 |
858,060 |
1,144,080 |
1,430,100 |
|
|
|
|
|
|
|
|
Cumulative Total |
— |
— |
— |
— |
4,290,300 |
|
|
|
|
|
|
|
|
WUE GOAL NO. 1
SAVE A CUMULATIVE TOTAL OF 4.29 MILLION GALLONS OF WATER BY 2024
For 2020, Skagit PUD’s goal for estimated annual water savings through the Water Use Efficiency program was 286,020 gallons. Skagit PUD achieved an estimated 73,753 gallons saved. The
-
Skagit PUD continues to focus its public outreach efforts on providing customers with simple
water-saving ideas to use at their homes or business. Unfortunately, in 2020, Skagit PUD’s public - Skagit PUD regularly offers school groups tours of Judy Reservoir and the water treatment plant. However, in 2020, just
outreach activities at local community events, festivals, and fairs were curtailed due to the lockdown and schools not open.
two school classes visited on field trips, where typically over 700 students and parents are hosted during the year.
-
Hardware measures provide the most quantifiable method for calculating potential water savings as compared to behavioral measures. Since 2008, Skagit PUD has teamed with the Environmental Protection Agency’s WaterSense program to help customers decrease indoor and outdoor water use through
water-efficient products and simplewater-saving practices. The program encourages customers to look for WaterSense labeled products, which are independently certified for efficiency and performance. -
Skagit PUD sells
low-cost indoor retrofit kits that include one
1.5 gallons per minute
Skagit PUD places emphasis on creating public awareness of the need to use water wisely. The PUD regularly provides outdoor water- saving tips in its Pipeline customer newsletter.
34 | WATER QUALITY REPORT 2020 |
WATER QUALITY REPORT 2020 | 35 |
WUE GOAL NO. 2
REDUCE DISTRIBUTION SYSTEM LEAKAGE
TO 10% OR LESS OF TOTAL WATER PRODUCED PER YEAR
Skagit PUD operates the most expansive water system in Skagit County with over 26,000 metered services, serving approximately 82,000 people. The majority of Skagit PUD’s services are within the Judy Reservoir system; however, the PUD also operates seven remote water systems that are monitored for water quality.
All water services in Skagit PUD’s water systems are metered. The PUD tracks
In 2020, the average water loss reported from distribution system leakage (DSL) for all systems operated by Skagit PUD was 8.2%. The
OUR VALUES
As we pursue our vision and advance our mission, we demonstrate and maintain balance among our Core Values:
QUALITY. We seek to exceed customer expectations by providing exceptional service.
ENVIRONMENTAL STEWARDSHIP.
We act to preserve our region’s natural resources.
FINANCIAL PRUDENCE. We strive to keep our rates as low as possible while making wise capital investments and strategic business decisions.
WATER SYSTEM PERFORMANCE 2020
Judy Reservoir Production |
2,766,545.4 Kgals Produced |
Judy Reservoir Billed |
2,568,312.7 Kgals Billed |
% Distribution System Leakage |
10.2% DSL |
Alger Production |
9,026.5 Kgals Produced |
Alger Billed |
7,847.1 Kgals Billed |
% Distribution System Leakage |
7.7% DSL |
|
|
Cedargrove Production |
9,647.1 Kgals Produced |
Cedargrove Billed |
8,462.7 Kgals Billed |
% Distribution System Leakage |
7.8% DSL |
Fidalgo Island Production |
55,911.2 Kgals Produced |
Fidalgo Island Billed |
43,532.1 Kgals Billed |
% Distribution System Leakage |
6.0% DSL |
|
|
Marblemount Production |
2,733.3 Kgals Produced |
Marblemount Billed |
1,704.1 Kgals Billed |
% Distribution System Leakage |
0.1% DSL |
|
|
*Mountain View Production |
295.6 Kgals Produced |
Mountain View Billed |
295.5 Kgals Billed |
% Distribution System Leakage |
|
Potlatch Beach Production |
687.2 Kgals Produced |
Potlatch Beach Billed |
647.8 Kgals Billed |
% Distribution System Leakage |
5.7% DSL |
|
|
Rockport Production |
4,167.1 Kgals Produced |
Rockport Billed |
3,451.5 Kgals Billed |
% Distribution System Leakage |
5.7% DSL |
Skagit View Village Production |
4,021.9 Kgals Produced |
Skagit View Village Billed |
3,815.8 Kgals Billed |
|
|
% Distribution System Leakage |
2.4% DSL |
Numbers calculated in thousands of gallons (Kgals).
The chart at the left reports each system’s water production performance for
2020. All water that is not authorized consumption is considered distribution system leakage (DSL). Some examples of water use considered leakage include: water main breaks, theft, meter inaccuracies, meter reading errors, data collection, and calculation errors.
The DSL calculation also takes into account water that is produced but not billable. For example: backwash, customer leak adjustments, estimated fire suppression usage, estimated project line flushing, etc.
The total average DSL in 2020 for all systems is 8.2%. The DSL standard set by the state is 10% or less for the last
- The Mountain View system was incorporated into the Judy Reservoir system in April 2020. The well is no longer in operation.
36 | WATER QUALITY REPORT 2020 |
WATER QUALITY REPORT 2020 | 37 |
DROPS NEED WATTS
SAVE WATER & ENERGY
BY SHOWERING BETTER
Water and energy work together. Have you ever picked up a gallon of water or milk from the fridge? It’s pretty heavy, right? A lot of energy is used to carry every gallon of water you use from a drinking water source to a treatment plant that makes it safe to drink.
After the water leaves the treatment plant, more energy is needed to carry it through water pipes to your house. Imagine the journey it has
And the work doesn’t stop there. If you want that water to be hot, it takes energy to warm it up before it hits the tap. Here’s some food for
That’s why it’s so important not to waste water at home. Don’t leave the water on when you brush your teeth. Make sure to turn off the faucet all the way after you wash your hands. If water drips from the faucet after you turn it off, it could be a leak. One of the best places to save both water and energy at home is in your shower. Besides taking shorter showers, the U.S. Environmental Protection Agency’s WaterSense program has some tips for how you and your family can “shower better.”
SHOWERING FACTS
The shower is a place where we can clean up, cool off, wake up, or relax after a long day. But it’s also a place where we waste a lot of water and energy!
Consider this:
- The average shower lasts eight minutes. Since a standard showerhead has a water flow of 2.5 gallons per minute, each shower uses 20 gallons of water!
- Across the United States, we use more than one trillion gallons of water each year just for showering.
Never fear! You can still save water and energy. WaterSense has a special label for showerheads that use less water but still provide a great spray of water when you shower. If your family uses a WaterSense labeled showerhead:
-
Every shower, you’ll save enough electricity to power a
60-watt light bulb for eight hours. - Every year, you’ll save the amount of water it takes to wash more than 70 loads of laundry.
DREAMING OF A BETTER BATHROOM?
Bathrooms are by far the largest water users in the home, accounting for more than half of all the water that families use indoors. If you are planning to remodel your bathroom, did you know plumbing fixtures are available in a wide variety of colors, models, and prices to help you save water and money?
Advances in plumbing technology and design mean that faucets, showers, and toilets can use significantly less water than standard models while still delivering the rinse, spray, and flush you expect.
Skagit PUD is a partner in the EPA’s WaterSense program, which encourages customers to look for WaterSense labeled products. The products have been independently certified for efficiency and performance, and promote water- saving techniques that reduce stress on water systems and the environment. Just look for the WaterSense label to find products at retailers in our area.
SAVE MONEY, SHOWER BETTER
An American taking a
Installing a
water use and your water heating bills. Skagit PUD sells a quality,
Install these items today for more efficient and enjoyable showering with better faucet flow.
38 | WATER QUALITY REPORT 2020 |
WATER QUALITY REPORT 2020 | 39 |
LEARN MORE ABOUT YOUR WATER
skagitpud.org
1415 FREEWAY DRIVE, MOUNT VERNON WA 98273
(360)
Reminder
Always take extra precautions, the water may be safe to drink when it leaves the sewage treatment plant but it may pick up pollutants during its way to your tap. We advise that you ask locals or hotel staff about the water quality. Also, note that different cities have different water mineral contents.