Table of Contents
Can You Drink Tap Water in Roanoke City?
Yes, Roanoke City's tap water is generally considered safe to drink as Roanoke City has no active health based violations of the Safe Drinking Water Act (SDWA) that we are aware of. Other factors such as lead piping in a home, or low levels of pollutants on immunocompromised individuals, should also be considered, however. To find more recent info we might have, you can check out our boil water notice page or the city's water provider website.
According the EPA’s ECHO database, from April 30, 2019 to June 30, 2022, Roanoke City's water utility, Western Virginia Water Authority, had 2 health-based violations of the Safe Drinking Water Act. For more details on the violations, please see our violation history section below. The last violation for Roanoke City was resolved on March 31, 2020. This assessment is based on the Western Virginia Water Authority water system, other water systems in the city may have different results.
While tap water that meets the EPA health guidelines generally won’t make you sick to your stomach, it can still contain regulated and unregulated contaminants present in trace amounts that could potentially cause health issues over the long-run. These trace contaminants may also impact immunocompromised and vulnerable individuals.
The EPA is reviewing if it’s current regulations around pollutant levels in tap water are strict enough, and the health dangers posed by unregulated pollutants, like PFAS.
Water Quality Report for Roanoke City Tap Water
The most recent publicly available numbers for measured contaminant levels in Roanoke City tap water are in its 2020 Water Quality Report. As you can see, there are levels which the EPA considers to be acceptable, but being below the maximum allowable level doesn’t necessarily mean the water is healthy.
Lead in tap water, for example, is currently allowed at up to 15ppb by the EPA, but it has set the ideal goal for lead at zero. This highlights how meeting EPA standards doesn’t necessarily mean local tap water is healthy.
EPA regulations continue to change as it evaluates the long term impacts of chemicals and updates drinking water acceptable levels. The rules around arsenic, as well as, lead and copper are currently being re-evaluated.
There are also a number of "emerging" contaminants that are not currently. For example, PFAS (Per- and polyfluoroalkyl substances), for which the EPA has issued a health advisory. PFAS are called "forever chemicals" since they tend not to break down in the environment or the human body and can accumulate over time.
We recommend looking at the contaminants present in Roanoke City's water quality reports, or getting your home's tap water tested to see if you should be filtering your water.
Roanoke City Tap Water Safe Drinking Water Act Violation History - Prior 10 Years
Below is a ten year history of violations for the water system named Western Virginia Water Authority for Roanoke City in Virginia. For more details please see the "What do these Violations Mean?" section below.
From Jan. 1, 2020 to March 31, 2020, Roanoke City had 1 health-based Safe Drinking Water Act violation with the violation category being Maximum Contaminant Level Violation, more specifically, the violation code was Maximum Contaminant Level Violation, Average which falls into the Disinfectants and Disinfection Byproducts Rule rule code group, and the Stage 2 Disinfectants and Disinfection Byproducts Rule rule code family for the following contaminant code: TTHM.
From July 1, 2019 to Sept. 30, 2019, Roanoke City had 1 health-based Safe Drinking Water Act violation with the violation category being Maximum Contaminant Level Violation, more specifically, the violation code was Maximum Contaminant Level Violation, Average which falls into the Disinfectants and Disinfection Byproducts Rule rule code group, and the Stage 2 Disinfectants and Disinfection Byproducts Rule rule code family for the following contaminant code: TTHM.
From July 1, 2017 to Sept. 30, 2017, Roanoke City had 1 health-based Safe Drinking Water Act violation with the violation category being Maximum Contaminant Level Violation, more specifically, the violation code was Maximum Contaminant Level Violation, Average which falls into the Disinfectants and Disinfection Byproducts Rule rule code group, and the Stage 2 Disinfectants and Disinfection Byproducts Rule rule code family for the following contaminant code: Total Haloacetic Acids (HAA5).
Is there Lead in Roanoke City Water?
Based on the EPA’s ECHO Database, 90% of the samples taken from the Roanoke City water system, Western Virginia Water Authority, between sample start date and sample end date, were at or below, 0.00151 mg/L of lead in Roanoke City water. This is 10.1% of the 0.015 mg/L action level. This means 10% of the samples taken from Roanoke City contained more lead.
While Roanoke City water testing may have found 0.00151 mg/L of lead in its water, that does not mean your water source has the same amount. The amount of lead in water in a city can vary greatly from neighborhood to neighborhood, or even building to building. Many buildings, particularly older ones, have lead pipes or service lines which can be a source of contamination. To find out if your home has lead, we recommend getting you water tested.
No amount of lead in water is healthy, only less dangerous. As lead accumulates in our bodies over time, even exposure to relatively small amounts can have negative health effects. For more information, please check out our Lead FAQ page.
Are there PFAS in Roanoke City Tap Water?
Currently, testing tap water for PFAS isn’t mandated on a national level. We do have a list of military bases where there have been suspected or confirmed leaks. There appears to be at least one military base - Radford Army Ammunition Plant - near Roanoke City with suspected leaks.
With many potential sources of PFAS in tap water across the US, the best information we currently have about which cities have PFAS in their water is this ewg map, which you can check to see if Roanoke City has been evaluated for yet.
Our stance is better safe than sorry, and that it makes sense to try to purify the tap water just in case.
Roanoke City SDWA Violation History Table - Prior 10 Years
| Compliance Period | Status | Health-Based? | Category Code | Code | Rule Code | Contaminant Code | Rule Group Code | Rule Family Code |
|---|---|---|---|---|---|---|---|---|
| 01/01/2020 - 03/31/2020 | Resolved | Yes | Maximum Contaminant Level Violation (MCL) | Maximum Contaminant Level Violation, Average (02) | Stage 2 Disinfectants and Disinfection Byproducts Rule (220) | TTHM (2950) | Disinfectants and Disinfection Byproducts Rule (200) | Stage 2 Disinfectants and Disinfection Byproducts Rule (220) |
| 07/01/2019 - 09/30/2019 | Resolved | Yes | Maximum Contaminant Level Violation (MCL) | Maximum Contaminant Level Violation, Average (02) | Stage 2 Disinfectants and Disinfection Byproducts Rule (220) | TTHM (2950) | Disinfectants and Disinfection Byproducts Rule (200) | Stage 2 Disinfectants and Disinfection Byproducts Rule (220) |
| 07/01/2017 - 09/30/2017 | Resolved | Yes | Maximum Contaminant Level Violation (MCL) | Maximum Contaminant Level Violation, Average (02) | Stage 2 Disinfectants and Disinfection Byproducts Rule (220) | Total Haloacetic Acids (HAA5) (2456) | Disinfectants and Disinfection Byproducts Rule (200) | Stage 2 Disinfectants and Disinfection Byproducts Rule (220) |
What do these Violations Mean?
Safe Drinking Water Act Violations categories split into two groups, health based, and non-health based. Generally, health based violations are more serious, though non-health based violations can also be cause for concern.
Health Based Violations
- Maximum contaminant levels (MCLs) - maximum allowed contaminant level was exceeded.
- Maximum residual disinfectant levels (MRDLs) - maximum allowed disinfectant level was exceeded.
- Other violations (Other) - the exact required process to reduce the amounts of contaminants in drinking water was not followed.
Non-Health Based Violations
- Monitoring and reporting violations (MR, MON) - failure to conduct the required regular monitoring of drinking water quality, and/or to submit monitoring results on time.
- Public notice violations (Other) - failure to immediately alert consumers if there is a serious problem with their drinking water that may pose a risk to public health.
- Other violations (Other) - miscellaneous violations, such as failure to issue annual consumer confidence reports or maintain required records.
SDWA Table Key
| Field | Description |
|---|---|
| Compliance Period | Dates of the compliance period. |
| Status |
Current status of the violation.
|
| Health-Based? | Whether the violation is health based. |
| Category Code |
The category of violation that is reported.
|
| Code | A full description of violation codes can be accessed in the SDWA_REF_CODE_VALUES (CSV) table. |
| Contaminant Code | A code value that represents a contaminant for which a public water system has incurred a violation of a primary drinking water regulation. |
| Rule Code |
Code for a National Drinking Water rule.
|
| Rule Group Code |
Code that uniquely identifies a rule group.
|
| Rule Family Code |
Code for rule family.
|
For more clarification please visit the EPA's data dictionary.
Roanoke City Water - Frequently Asked Questions
| By Mail: | 1502 Brownlee Ave SE ROANOKE, VA, 24014 |
Existing customers can login to their Western Virginia Water Authority account to pay their Roanoke City water bill by clicking here.
If you want to pay your Western Virginia Water Authority bill online and haven't made an account yet, you can create an account online. Please click here to create your account to pay your Roanoke City water bill.
If you don't want to make an account, or can't remember your account, you can make a one-time payment towards your Roanoke City water bill without creating an account using a one time payment portal with your account number and credit or debit card. Click here to make a one time payment.
Moving to a new house or apartment in Roanoke City means you will often need to put the water in your name with Western Virginia Water Authority. In order to put the water in your name, please click the link to the start service form below. Start service requests for water bills typically take two business days.
Leaving your house or apartment in Roanoke City means you will likely need to take your name off of the water bill with Western Virginia Water Authority. In order to take your name off the water bill, please click the link to the stop service form below. Stop service for water bills requests typically take two business days.
The estimated price of bottled water
$1.50 in USD (1.5-liter)
USER SUBMITTED RATINGS
- Drinking Water Pollution and Inaccessibility
- Water Pollution
- Drinking Water Quality and Accessibility
- Water Quality
The above data is comprised of subjective, user submitted opinions about the water quality and pollution in Roanoke City, measured on a scale from 0% (lowest) to 100% (highest).
Related FAQS
Roanoke City Water Quality Report (Consumer Confidence Report)
The EPA mandates that towns and cities consistently monitor and test their tap water. They must report their findings in an annual Consumer Confidence Report. Below is the most recent water quality report from Roanoke City's Water. If you would like to see the original version of the report, please click here.
2021 Water Quality Report
www.westernvawater.org
info@westernvawater.org
540.853.5700
Serving customers in the City of Roanoke and the Counties of Roanoke, Franklin & Botetourt, Virginia

About This Report
The Western Virginia Water Authority supplies customers in the City of Roanoke and the Counties of Roanoke, Franklin and Botetourt with an annual water quality report. This provides you with information about the source of your water, what it contains and how it compares to the standards set by regulatory agencies based on data collected during calendar year 2020 or the most recent testing period.
The Water Quality Division of the Western Virginia Water Authority is pleased to deliver safe drinking water. Once again, the Water Authority is in full compliance with all state and federal monitoring and reporting requirements.
On July 1, 2004 the Western Virginia Water Authority was formed from the former utility departments of the City of Roanoke and Roanoke County. In November 2009 Franklin County joined the Water Authority. Botetourt County joined in 2015 offering a larger regional approach to meeting the communities’ water and wastewater needs.
The Authority has earned the highest industry awards for both water and wastewater, implemented energy saving measures across all departments, focused on cleaning the sanitary sewer lines and rehabilitating aging water distribution pipes.
Reaching out to the Western Virginia Water Authority
Executive Director
The Western Virginia Water Authority’s Executive Director, Michael McEvoy, oversees the daily treatment and delivery of
Authority Board of Directors
The Western Virginia Water Authority’s Board of Directors, appointed by the member localities, governs the Authority. Representatives from the City of Roanoke include Mr. John P. Bradshaw, Jr., Mr. Bob Cowell and Mr. Harvey Brookins. The Roanoke County representatives include Mr. Don Davis, Mr. Dan O’Donnell and Mr. Randall Hancock. Mrs. Shirley Holland represents Franklin County, and Mr. Hunter Young represents Botetourt County.
Board meetings are held on the third Thursday of each month (with the exception of August and December) at 601 S. Jefferson Street. The Board meetings are open to the public.
Customer Service
Our customer service representatives are available
601 S. Jefferson Street • Suite 200 • Roanoke, VA 24011 www.westernvawater.org
connect with us
2

Table of Contents
2021 Water Quality Report
Contact Information |
2 |
How Standards are Set |
3 |
Information about Specific Tests |
4 |
Definitions |
5 |
Source Water Assessment |
6 |
Backflow Education |
6 |
UCMR4 Data |
7 |
Roanoke Area System Water Quality Data |
8 |
Botetourt County System Water Quality Data |
18 - 21 |
Franklin County Systems Water Quality Data |
22 - 39 |
Water Conservation, Leak Detection & Outreach |
40 |
Testing Your Water
In order to ensure that tap water is safe to drink, the Environmental Protection Agency (EPA) prescribes regulations which limit the amount of certain contaminants in water provided by public water systems. Food and Drug Administration regulations establish limits for contaminants in bottled water which must provide the same protection for public health. All drinking water, including bottled drinking water, may reasonably be expected to contain at least small amounts of some contaminants. The presence of contaminants does not necessarily indicate that water poses a health risk.
More information about drinking water is available through these sources
Virginia Department of Health: (Roanoke & Botetourt area) 540.463.7136
Virginia Department of Health: (Franklin County) 434.836.8416
Center for Disease Control and Prevention: 1.800.311.3435 404.639.3311 or 404.639.3312 (TTY)
Roanoke Environmental Health Department: 540.857.7663
EPA Safe Drinking Water Hotline: 800.426.4791
How are the standards set?
The U.S. Environmental Protection Agency (EPA) sets maximum contaminant levels (MCLs) at very stringent levels. In developing the standards, EPA assumes that the average adult drinks 2 liters of water each day throughout a
The tables of data on pages 10
There is no State or Federal MCL for sodium. Monitoring is required to provide information to consumers and health officials that are concerned about sodium intake due to dietary restrictions. The EPA recommended optimal level of sodium is less than 20 ppm, established for people on a “strict” sodium intake diet. The amount of sodium detected in each water system is listed in the data charts.
The Western Virginia Water Authority constantly monitors its water supplies for various contaminants to meet all regulatory requirements. All regulated substances must be tested annually (or triennially) for small systems) except for lead and copper and SOCs, which must be tested every three years, and radiologicals, which must be tested every six to nine years. The TTHMs/HAA5s were derived from running annual averages.
3

Cryptosporidium & Giardia
Cryptosporidium and Giardia are microscopic organisms that can cause fever, diarrhea and other gastrointestinal symptoms when ingested. The organisms come from animal and human wastes and are eliminated through water filtration and disinfection. Even though the presence of these organisms is not regulated by the state or federal government, the Water Authority has tested for these organisms. Giardia, 0.2 cyst per 1 liter, was detected in the raw (untreated) water at Falling Creek in March 2016 and 8 cyst per 1 liter in June 2017. Cryptosporidium was detected in the raw (untreated) water at Carvins Cove (0.1 cyst per 1 liter in January 2016 and 0.1 cyst per 1 liter in February 2016).
Some people may be more vulnerable to contaminants in drinking water than the general population.
What Causes Discolored Water?
Changes in water pressure in water systems, such as when water mains break or fire hydrants are used or flushed, can occasionally cause drinking water to be discolored. The discoloration is caused by sediments in pipes mixing with clear water. The sediments occur naturally from the oxidation of iron in pipes.
While discolored water is ordinarily safe to drink, it is best to flush any discolored water from pipes by turning on all
If you notice evidence of a water main break or leaking fire hydrant, please call 540.853.5700.
What is my Water Hardness?
As water naturally flows over rocks and through the soil, it picks up minerals. The more calcium and magnesium present, the harder your water. While water hardness is not a safety issue, you may notice increased mineral
PPM |
GPG |
Rating |
|
|
|
0 - 75 |
0 - 4.3 |
Soft |
|
|
|
76 - 150 |
4.4 - 8.7 |
Moderately Hard |
|
|
|
151 - 300 |
8.8 - 17.5 |
Hard |
|
|
|
over 300 |
17.6 + |
Very Hard |
|
|
|
Lead & Copper Testing
Quality water begins at the source. It is important that the Western Virginia Water Authority knows and understands the water chemistry from each source, closely monitors the treatment process and understands the pipe material that the water can flow through. This is especially important regarding lead and copper.
Copper is a nutritionally essential element, but at high levels, copper can cause gastrointestinal difficulties such as nausea and diarrhea. Elevated levels of lead, if present, can cause serious health problems, especially for pregnant women and young children. Lead in drinking water is primarily associated with materials and components in service lines and home plumbing.
The Authority maintains over 1500 miles of pipes up to and including the lines going to the customer’s water meter. Pipe materials in our system can be cast iron, ductile iron or pvc. We do not know of any lead pipes in our distribution system. However, customers, particularly those in older homes, may have lead plumbing in their homes or pipes that were joined with lead solder.
We treat the water with corrosion control or adjust the pH of the water so that pipes in our distribution system and the customers’ pipes in their homes are protected.
The Western Virginia Water Authority is responsible for providing high quality drinking water but cannot control the variety of materials used in plumbing components. When your water has been sitting in your pipes for several hours, you can minimize the potential for lead exposure by flushing your tap for 30 seconds to 2 minutes or until it becomes cold or reaches a steady temperature before using water for drinking or cooking. If you are concerned about lead in your water, you may wish to have your water tested.
Information on lead in drinking water, testing methods and steps you can take to minimize exposure is available from the Safe Drinking Water Hotline or at http://www.epa.gov/safewater/lead.
4

Terms Used in This Water Quality Report
Action Level (AL): The concentration of a contaminant that triggers treatment or other requirement that a water system must follow.
Combined Radium: Radium 226 + Radium 228
E. coli: Bacteria from human and animal fecal waste
HAA5s: Haloacetic acids.
LRAA: Locational Running Annual Average
Maximum Contaminant Level (MCL):
The highest level of a contaminant that is allowed in drinking water. MCLs are set as close to the MCLG as feasible using the best available treatment technology.
Maximum Contaminant Level Goal (MCLG): The level of a contaminant in drinking water below which there is no known or expected risk to health. MCLGs allow for a margin of safety.
Maximum Residual Disinfection Level (MRDL): The highest level of a disinfection allowed in drinking water. There is convincing evidence that addition of a disinfectant is necessary for control of microbial contaminants.
mg/L: Milligrams per liter, also referred to as parts per million (for example, one minute in two years).
ND: Analyte was not detected or was below the method detection limit of the laboratory’s instrumentation.
NTUs: Nephelometric Turbidity Units; a measure of
turbidity.
P/A: Present or Absent
pCi/L: Picocuries per liter is a measure of the radioactivity in water.
ppm: One part per million, also referred to as mg/L, (for example, one minute in two years).
ppb: One part per billion, also referred to as μg/L (for example, one minute in 2,000 years).
TTHMs: Total Trihalomethanes
Treatment Technique (TT): A required process intended to reduce the level of a contaminant in drinking water.
μg/L: Micrograms per liter, also referred to as parts per billion (for example, one minute in 2,000 years).
μmhos/cm: Micromhos per centimeter; a measure of conductivity.
Substance |
Source of Substance |
Alkalinity |
Measurement of naturally occurring carbonates |
Antimony |
Discharge from petroleum refineries; fire retardants; ceramics; |
|
electronics; solder |
Arsenic |
Erosion of natural deposits; runoff from orchards, runoff from glass |
|
and electronics production wastes |
Barium |
Discharge from drilling wastes; discharge from metal refineries; |
|
erosion of natural deposits |
Beryllium |
Discharge from metal refineries and |
|
from electrical, aerospace, and defense industries |
Cadmium |
Corrosion of galvanized pipes; erosion of natural deposits; discharge |
|
from metal refineries; runoff from waste batteries and paints |
Chlorate |
|
Chlorine |
Required disinfectant added during treatment process to eliminate |
|
bacteria |
Chlorite |
|
Chromium |
Discharge from steel and pulp mills; erosion of natural deposits |
Conductivity |
Physical property of water |
Copper |
Natural\industrial deposits, plumbing, wood preservatives |
Corrosivity |
Physical property of water that occurs when water reacts with metal |
Ethylbenzene |
Discharge from petroleum refineries |
Fecal Coliforms |
Human and animal waste |
Fluoride |
Erosion of natural deposits; water additive which promotes strong |
|
teeth; discharge from aluminum and fertilizer factories |
Gross Alpha |
Erosion of natural deposits |
Gross Beta |
Decay of natural and |
HAA5s |
|
Hardness |
Measurement of naturally occurring hardness metals |
Iron |
Naturally occurring in the environment |
Lead |
Natural\industrial deposits, plumbing solder, brass alloy in faucets |
Manganese |
Naturally occurring in the environment |
Orthophosphate (as P) |
Corrosion inhibitor added during treatment process |
Radium 226/228 |
Erosion of natural deposits |
Selenium |
Discharge from petroleum refineries; erosion of natural deposits; |
|
discharge from mines |
Sodium |
Naturally occurring in the environment |
Styrene |
Discharge from rubber and plastic factories; leaching from landfills |
Thallium |
Leaching from |
|
and drug factories |
Toluene |
Discharge from petroleum factories |
Total Coliforms |
Naturally present in the environment |
Total Nitrate & Nitrite |
|
(as N) |
of natural deposits |
TTHMs |
|
Vinyl Chloride |
Leaching from PVC pipes; discharge from plastic factories |
Xylene |
Discharge from petroleum factories; discharge from chemical factory |
Zinc |
Naturally occurring in the environment |
Discharge from industrial chemical factories |
|
Discharge from textile finishing factories |
5
Source Water Assessment
As water travels over the surface of the land or through the ground, it dissolves naturally occurring minerals and can pick up substances resulting from the presence of animals or from human activity. Water from surface sources is treated to make it drinkable while groundwater may or may not require any treatment.
Contaminants in source water may be naturally occurring substances, or may come from:
- Microbial contaminants, such as viruses and bacteria, which may come from sewage treatment plants, septic systems, agricultural livestock operations, and wildlife;
-
Inorganic contaminants, such as salts and metals, which can be
naturally-occurring or result from urban stormwater runoff, industrial or domestic wastewater discharges, oil and gas production, mining, or farming; - Pesticides and herbicides, which may come from a variety of sources such as agriculture, urban stormwater runoff, and residential uses;
-
Organic chemical contaminants, including synthetic and volatile organic chemicals, which are
by-products of industrial processes and petroleum production, and can also come from gas stations, urban stormwater runoff, and septic systems; and -
Radioactive contaminants, which can be
naturally-occurring or be the result of oil and gas production and mining activities.
The Western Virginia Water Authority has worked with the Virginia Department of Health to determine our water sources susceptibility to contaminants. The assessment is a requirement of the Virginia Department of Health’s (VDH) Source Water Assessment Program (SWAP) in accordance with the 1996 Amendments of the Safe Drinking Water Act.
The assessment determined that Crystal Spring, Falling Creek and Carvins Cove are susceptible to contamination based on land use activities and potential types of contaminants in these areas. This designation does not mean that the source water has been impacted or that it will be impacted. It does mean that if there is a release of pollutants in the assessment area, the source water could be impacted.
The VDH also completed a source water assessment of Spring Hollow Reservoir’s water source, the Roanoke River. This assessment determined that the Roanoke River may be susceptible to contamination because it is surface water exposed to a wide array of contaminants at varying concentrations. Also, changing hydrologic, hydraulic and atmospheric conditions promote migration of contaminants from land use activities of concern.
The assessment also determined that the Water Authority’s wells might be susceptible to contamination because they are located in areas that promote migration of contaminants from land use activities of concern. More specific information about these reports may be obtained by contacting the Western Virginia Water Authority’s Water Quality Division at 540.853.5700.
6
Backflow Prevention &
Cross-Connection Identification
A plumbing
Water travelling through the Authority’s distribution system is pressurized. If the water system loses pressure, such as during a water main break, system maintenance or fire hydrant usage/testing, the flow of the water may be reversed. If a customer has made a
What You Can Do To Protect
Your Drinking Water
Help us identify potential locations where backflow can occur. You can complete a simple Backflow Prevention Survey
If necessary, contact the Water Authority to schedule a free assessment with our staff to assist you in finding and removing any potential
Remove any
If you have a backflow prevention device installed by a certified plumber, have it tested annually or after any repairs.
Questions about backflow prevention? email us at backflow@westernvawater.org call us at 540.853.5700

Unregulated Contaminant Monitoring - UCMR4
The following substances were tested in Western Virginia Water Authority sources during calendar year 2019 as part of the unregulated contaminants monitoring.
Unregulated contaminants are those for which EPA has not established drinking water standards. Unregulated contaminant monitoring helps EPA to determine where certain contaminants occur and whether the Agency should consider regulating those contaminants in the future.
Parameter |
Units |
Carvins |
Spring |
Crystal |
Falling |
Garden |
LaBellevue |
Longridge |
Muse |
North |
Starkey |
Starkey |
City of |
|
Cove |
Hollow |
Spring |
Creek |
City Well 2 |
Well 7 |
Well 2 |
Spring |
Lakes |
Well 1 |
Well 2 |
Salem |
|
||
|
|
|
||||||||||||
|
|
|
|
|
|
|
|
|
|
|
|
|
|
|
Germanium |
ppb |
ND |
ND |
ND |
ND |
ND |
ND |
ND |
ND |
ND |
ND |
ND |
ND |
|
|
|
|
|
|
|
|
|
|
|
|
|
|
|
|
Manganese |
ppb |
ND |
0.439 |
ND |
8.63 |
ND |
ND |
16.7 |
ND |
4.6 |
40.8 |
45.8 |
|
|
|
|
|
|
|
|
|
|
|
|
|
|
|
|
|
ppb |
ND |
ND |
ND |
ND |
ND |
ND |
ND |
ND |
ND |
ND |
ND |
ND |
|
|
|
|
|
|
|
|
|
|
|
|
|
|
|
|
|
Chlorpyrifos |
ppb |
ND |
ND |
ND |
ND |
ND |
ND |
ND |
ND |
ND |
ND |
ND |
ND |
|
|
|
|
|
|
|
|
|
|
|
|
|
|
|
|
Dimethipin |
ppb |
ND |
ND |
ND |
ND |
ND |
ND |
ND |
ND |
ND |
ND |
ND |
ND |
|
|
|
|
|
|
|
|
|
|
|
|
|
|
|
|
Ethoprop |
ppb |
ND |
ND |
ND |
ND |
ND |
ND |
ND |
ND |
ND |
ND |
ND |
ND |
|
|
|
|
|
|
|
|
|
|
|
|
|
|
|
|
Oxyfluorfen |
ppb |
ND |
ND |
ND |
ND |
ND |
ND |
ND |
ND |
ND |
ND |
ND |
ND |
|
|
|
|
|
|
|
|
|
|
|
|
|
|
|
|
Profenofos |
ppb |
ND |
ND |
ND |
ND |
ND |
ND |
ND |
ND |
ND |
ND |
ND |
ND |
|
|
|
|
|
|
|
|
|
|
|
|
|
|
|
|
Tebuconazole |
ppb |
ND |
ND |
ND |
ND |
ND |
ND |
ND |
ND |
ND |
ND |
ND |
ND |
|
|
|
|
|
|
|
|
|
|
|
|
|
|
|
|
Permethrin, cis & trans |
ppb |
ND |
ND |
ND |
ND |
ND |
ND |
ND |
ND |
ND |
ND |
ND |
ND |
|
|
|
|
|
|
|
|
|
|
|
|
|
|
|
|
Tribufos |
ppb |
ND |
ND |
ND |
ND |
ND |
ND |
ND |
ND |
ND |
ND |
ND |
ND |
|
|
|
|
|
|
|
|
|
|
|
|
|
|
|
|
Butylated hydroxyanisole |
ppb |
ND |
ND |
ND |
ND |
ND |
ND |
ND |
ND |
ND |
ND |
ND |
ND |
|
|
|
|
|
|
|
|
|
|
|
|
|
|
|
|
ppb |
ND |
ND |
ND |
ND |
ND |
ND |
ND |
ND |
ND |
ND |
ND |
ND |
|
|
|
|
|
|
|
|
|
|
|
|
|
|
|
|
|
Quinoline |
ppb |
ND |
ND |
ND |
ND |
ND |
ND |
ND |
ND |
ND |
ND |
ND |
0.021 |
|
|
|
|
|
|
|
|
|
|
|
|
|
|
|
|
ppb |
ND |
ND |
ND |
ND |
ND |
ND |
ND |
ND |
ND |
ND |
ND |
ND |
|
|
|
|
|
|
|
|
|
|
|
|
|
|
|
|
|
ppb |
ND |
ND |
ND |
ND |
ND |
ND |
ND |
ND |
ND |
ND |
ND |
ND |
|
|
|
|
|
|
|
|
|
|
|
|
|
|
|
|
|
ppb |
ND |
ND |
ND |
ND |
ND |
ND |
ND |
ND |
ND |
ND |
ND |
ND |
|
|
|
|
|
|
|
|
|
|
|
|
|
|
|
|
|
Bromochloroacetic acid |
ppb |
|
|
|
|
|
|
|
|
|
|
|
|
|
|
|
|
|
|
|
|
|
|
|
|
|
|
|
|
Bromodichloroacetic acid |
ppb |
|
|
|
|
|
ND - 1.99 |
|
|
|
|
|
|
|
|
|
|
|
|
|
|
|
|
|
|
|
|
|
|
Chlorodibromoacetic acid |
ppb |
|
|
|
|
|
ND - 0.348 |
|
|
|
|
|
|
|
|
|
|
|
|
|
|
|
|
|
|
|
|
|
|
Dibromoacetic acid |
ppb |
|
|
|
|
|
ND |
|
|
|
|
|
|
|
|
|
|
|
|
|
|
|
|
|
|
|
|
|
|
Dichloroacetic acid |
ppb |
|
|
|
|
|
2.56 - 28.5 |
|
|
|
|
|
|
|
|
|
|
|
|
|
|
|
|
|
|
|
|
|
|
Monobromoacetic acid |
ppb |
|
|
|
|
|
ND |
|
|
|
|
|
|
|
|
|
|
|
|
|
|
|
|
|
|
|
|
|
|
Monochloroacetic acid |
ppb |
|
|
|
|
|
ND - 3.14 |
|
|
|
|
|
|
|
|
|
|
|
|
|
|
|
|
|
|
|
|
|
|
Tribromoacetic acid |
ppb |
|
|
|
|
|
ND |
|
|
|
|
|
|
|
|
|
|
|
|
|
|
|
|
|
|
|
|
|
|
Trichloroacetic acid |
ppb |
|
|
|
|
|
2.85 - 27.3 |
|
|
|
|
|
|
|
|
|
|
|
|
|
|
|
|
|
|
|
|
|
|
Bromide (Raw) |
ppb |
|
|
|
|
|
ND |
|
|
|
|
|
|
|
|
|
|
|
|
|
|
|
|
|
|
|
|
|
|
TOC (Raw) |
ppb |
|
|
|
|
|
ND - 2510 |
|
|
|
|
|
|
|
|
|
|
|
|
|
|
|
|
|
|
|
|
||
|
|
|
|
|
|
|
|
|
|
|
|
|
|
|
Microcystins |
|
|
|
|
|
|
|
|
|
|
|
|
|
|
|
|
|
|
|
|
|
|
|
|
|
|
|
|
|
Anatoxin |
ppb |
ND |
ND |
ND |
ND |
|
|
|
|
|
|
|
ND |
|
|
|
|
|
|
|
|
|
|
|
|
|
|
|
|
Cylindrospermopsin |
ppb |
ND |
ND |
ND |
ND |
|
|
|
|
|
|
|
ND |
|
|
|
|
|
|
|
|
|
|
|
|
|
|
|
|
Total Microcystins and |
ppb |
ND |
ND |
ND |
ND |
|
|
|
|
|
|
|
|
7 |
Nodularins |
|
|
|
|
|
|
|
|
||||||
|
|
|
|
|
|
|
|
|
|
|
|
|
Drinking Water
Systems in the
Roanoke Valley
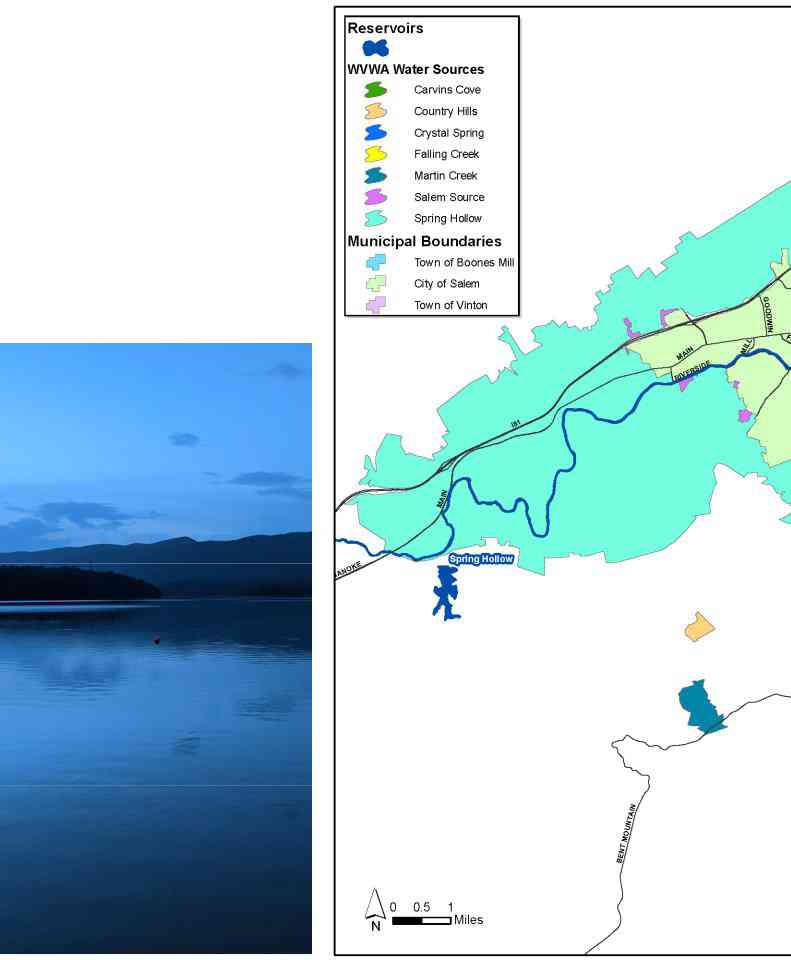
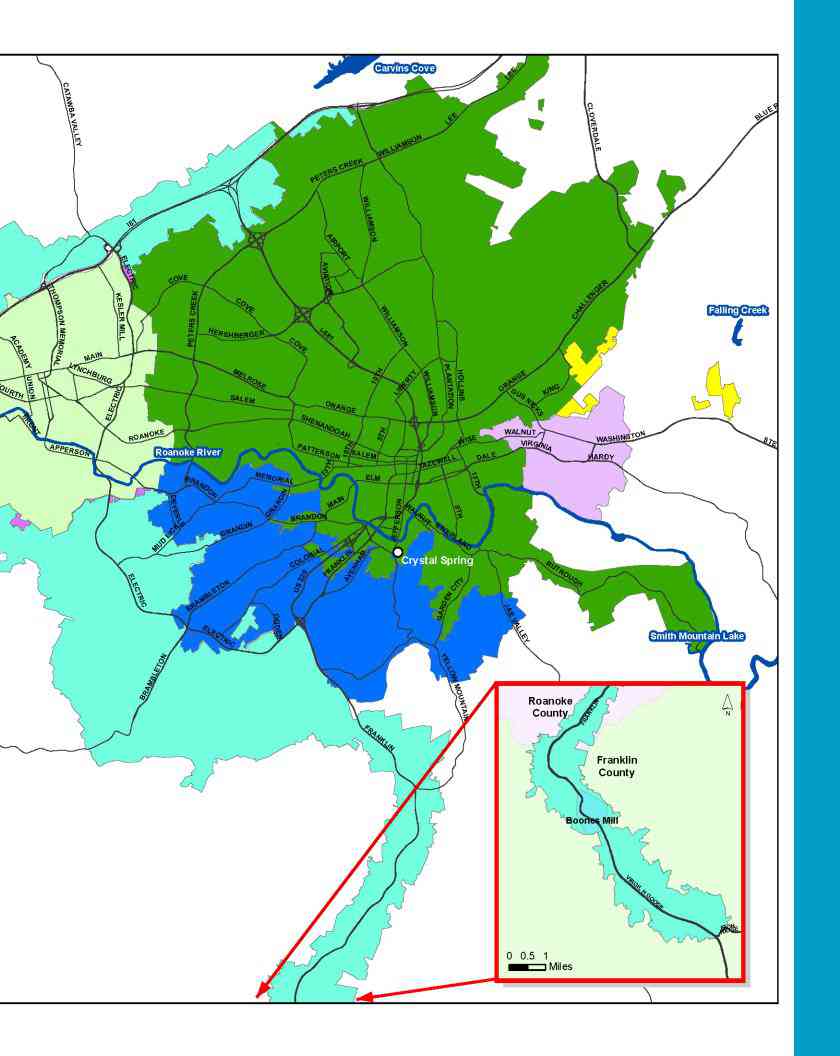
The Western Virginia Water Authority utilizes four surface water sources and multiple springs and wells as drinking water sources in the Roanoke Valley to serve customers in the City of Roanoke and the Counties of Roanoke, Franklin and Botetourt. Having an abundant supply of water helps protect against drought or other emergencies.
Combined, the water treatment facilities for these sources can treat over
8
Roanoke Systems
9

Carvins Cove
Reservoir &
Treatment Facility
Carvins Cove Reservoir is situated within Carvins Cove Natural Reserve, a
How is it treated? Carvins Cove Water Treatment Facility has the capacity to treat
Where does it serve? A large part of the northeastern and northwestern parts of the city, and the majority of the southeastern part of the city, to Reserve Avenue, are served by Carvins Cove. Portions of northern and northeastern Roanoke County are also served by the Carvins Cove water source. Water from Carvins Cove also serves the Botetourt area around Exit 150 to Tinkerview and Greenfield.
Many other primary and secondary contaminants have been analyzed but were either below the instrument’s detection limits or below the Maxium Contaminant Levels (MCLs). The Virginia Department of Health advised that the MCL for total trihalomethanes (TTHMs) was exceeded because the running annual average exceeded the MCL at one monitoring location in the Etzler Road area of Botetourt. Disinfectants used in the treatment of drinking water react with naturally occurring organic matter present in the water to form trihalomethanes. These results are averaged with the previous three quarters of results to determine the system’s running annual average at each sampling location. Because the running annual average exceeded the 80 ppb MCL at the sampling location, the Authority was deemed out of compliance with TTHM standards. Operation changes included adding a mechnical mixing system and increased monitoring. Water treated at the Carvins Cove Treatment Facility meets all state and federal monitoring and reporting requirements.
Carvins Cove Natural Reserve
www.westernvawater.org/carvinscove
Carvins Cove Natural Reserve, the second largest municipal park in the United States, offers outdoor recreation opportunities, including boating, fishing, hiking, paddleboarding and nature viewing. You can bring your own boat or rent kayaks and jon boats at the reservoir.
Visitors to the Natural Reserve are charged $7 per vehicle for daily use or annual passes are available for $50. Payment drop boxes are located at the Bennett Springs, Hollins Trailhead and Timberview parking lots, or passes can be purchased from the Security Office on Reservoir Road. For more information, call the Natural Reserve at 540.362.1757.
10

Substance |
Units |
Ideal Goals |
Highest Level Allowed |
Violation |
Carvins Cove Data |
|
(EPA’s MCLG) |
(EPA’s MCL) |
(range) average |
||||
|
|
|
||||
Regulated Substances |
|
|
|
|
|
|
|
|
|
|
|
|
|
Barium |
ppm |
2 |
2 |
no |
0.05 |
|
|
|
|
|
|
|
|
Fluoride |
ppm |
4 |
4 |
no |
(0.39 - 0.76) 0.61 |
|
|
|
|
|
|
|
|
Total Nitrate & Nitrite (as N) |
ppm |
10 |
10 |
no |
ND |
|
|
|
|
|
|
|
|
Total Organic Carbon |
ppm |
TT |
N/A |
no |
(1.43 - 2.0) 1.73 |
|
|
|
|
|
|
|
|
Turbidity |
NTU |
TT |
Percent of samples that met treatment requirement of |
no |
maximum 0.23/ 100% |
|
0.3 NTU |
||||||
|
|
|
|
|
||
Radioactive Contaminants |
|
|
|
|
|
|
|
|
|
|
|
|
|
Gross Alpha |
pCi/L |
0 |
15 |
no |
0.7 |
|
|
|
|
|
|
|
|
Gross Beta |
pCi/L |
0 |
50 |
no |
1.7 |
|
Radium 228 |
pCi/L |
0 |
5 |
no |
< 0.35 |
|
|
|
|
|
|
|
|
Combined Radium |
pCi/L |
0 |
5 |
no |
0.7 |
|
|
|
|
|
|
|
|
Lead and Copper Testing |
|
|
|
|
|
|
Lead |
ppb |
0 ppb |
AL = 15 |
no |
0 of 52 samples exceeded AL |
|
90th percentile = 1.51 ppb |
||||||
|
|
|
|
|
||
Copper |
ppm |
1.3 ppm |
AL = 1.3 |
no |
0 of 52 samples exceeded AL |
|
90th percentile = 0.30 ppm |
||||||
|
|
|
|
|
||
Disinfectants and Disinfection |
|
|
|
|
||
|
|
|
|
|
|
|
Chlorate |
ppm |
|
0.8 |
no |
(0.01 - 0.02) 0.01 |
|
|
|
|
|
|
|
|
Chlorine |
ppm |
|
4 |
no |
(1.2 - 1.4) 1.3 |
|
|
|
|
|
|
|
|
Chlorite |
ppm |
|
0.8 |
no |
ND |
|
|
|
|
|
|
|
|
HAA5s |
ppb |
0 |
60 |
no |
(ND - 61) site range |
|
(7 - 38) LRAA range |
||||||
|
|
|
|
|
||
TTHMs |
ppb |
0 |
80 |
yes |
(15 - 80) site range |
|
(24 - 81) LRAA range |
||||||
|
|
|
|
|
||
Microbiological Substances |
|
|
|
|
|
|
|
|
|
|
|
|
|
Total Coliforms |
P/A |
0 |
Presence of coliform bacteria in >5% of monthly samples |
no |
3 |
|
|
|
|
|
|
|
|
E.coli |
P/A |
0 |
A routine and a repeat sample are total coliform positive, |
no |
0 |
|
and one is also fecal coliform or E. coli positive. |
||||||
|
|
|
|
|
||
Unregulated and Secondary Substances |
|
|
|
|
||
|
|
|
|
|
|
|
Alkalinity |
ppm |
unregulated |
|
n/a |
(20 - 36) 26 |
|
|
|
|
|
|
|
|
Conductivity |
μmhos/cm |
unregulated |
|
n/a |
96.7 |
|
|
|
|
|
|
|
|
Hardness (Total) |
ppm |
unregulated |
|
n/a |
(26 - 42) 33 |
|
|
|
|
|
|
|
|
Iron |
ppm |
|
0.3 |
n/a |
(ND - 0.03) 0.023 |
|
Manganese |
ppm |
|
0.05 |
n/a |
(0.008 - 0.036) 0.02 |
|
|
|
|
|
|
|
|
Orthophosphate as P |
ppm |
unregulated |
|
n/a |
(0.24 - 0.29) 0.27 |
|
pH |
pH units |
|
6.5 - 8.5 |
no |
(7.4 - 7.7) 7.6 |
|
Sodium |
ppm |
unregulated |
|
n/a |
6.0 |
|
Zinc |
ppm |
|
5 |
n/a |
ND |
|
|
|
|
|
|
|
|
Roanoke Systems
11
Crystal Spring
Treatment Facility
Crystal Spring flows at the base of Mill Mountain in the southern part of the city. Annual production from this groundwater source was
How is it treated ? The water is filtered in the Crystal Spring Ultrafiltration Treatment Facility which filters out all particles larger than 0.01 micron. One micron is one thousandth of a millimeter. Filtered water is treated with chlorine and fluoride and pumped to water customers from the Crystal Spring Pumping Station.
Where does it serve? Crystal Spring serves portions of southwest Roanoke County and the southwestern part of the city. With the capacity to filter
Tests for volatile organics (VOCs), pesticides and synthetic organic compounds (SOCs) have been conducted, and all met current state and federal standards for drinking water.
Many other primary and secondary contaminants have been analyzed but were either below the instrument’s detection limits or below the MCLs.
Water treated at the Crystal Spring Treatment Facility meets all state and federal monitoring and reporting requirements.
|
|
Ideal Goals |
Highest Level |
|
Crystal Spring Data |
|
Substance |
Units |
Allowed |
Violation |
|||
(EPA’s MCLG) |
(range) average |
|||||
|
|
(EPA’s MCL) |
|
|||
|
|
|
|
|
||
Regulated Substances |
|
|
|
|
|
|
|
|
|
|
|
|
|
Barium |
ppm |
2 |
2 |
no |
0.04 |
|
|
|
|
|
|
|
|
Chromium |
ppm |
0.1 |
0.1 |
no |
0.0011 |
|
|
|
|
|
|
|
|
Fluoride |
ppm |
4 |
4 |
no |
(0.6 - 0.74) 0.7 |
|
|
|
|
|
|
|
|
Total Nitrate & Nitrite (as N) |
ppm |
10 |
10 |
no |
0.8 |
|
|
|
|
|
|
|
|
Total Organic Carbon |
ppm |
TT |
N/A |
no |
N/A |
|
|
|
|
|
|
|
|
Turbidity |
NTU |
TT |
0.3 |
no |
(0.01 - 0.01) 0.01 |
|
|
|
|
|
|
|
|
Radioactive Contaminants |
|
|
|
|
|
|
|
|
|
|
|
|
|
Gross Alpha |
pCi/L |
0 |
15 |
no |
1.0 |
|
|
|
|
|
|
|
|
Gross Beta |
pCi/L |
0 |
50 |
no |
7.7 |
|
|
|
|
|
|
|
|
Radium 228 |
pCi/L |
0 |
5 |
no |
0.7 |
|
|
|
|
|
|
|
|
Combined Radium |
pCi/L |
0 |
5 |
no |
1.7 |
|
|
|
|
|
|
|
|
Lead and Copper Testing |
|
|
|
|
|
|
|
|
|
|
|
|
|
Lead |
ppb |
0 ppb |
AL = 15 |
no |
0 of 52 samples exceeded AL |
|
90th percentile = 1.51 ppb |
||||||
|
|
|
|
|
||
Copper |
ppm |
1.3 ppm |
AL = 1.3 |
no |
0 of 52 samples exceeded AL |
|
90th percentile = 0.30 ppm |
||||||
|
|
|
|
|
||
Disinfectants and Disinfection |
|
|
|
|
||
|
|
|
|
|
|
|
Chlorate |
ppm |
|
0.8 |
no |
N/A |
|
|
|
|
|
|
|
|
Chlorine |
ppm |
|
4 |
no |
(1.1 |
|
|
|
|
|
|
|
|
Chlorite |
ppm |
|
0.8 |
no |
N/A |
|
|
|
|
|
|
|
|
HAA5s |
ppb |
0 |
60 |
no |
(ND - 61) site range |
|
(7 - 38) LRAA range |
||||||
|
|
|
|
|
||
TTHMs |
ppb |
0 |
80 |
no |
(15 - 80) site range |
|
(24 - 81) LRAA range |
||||||
|
|
|
|
|
||
Unregulated and Secondary Substances |
|
|
|
|
||
|
|
|
|
|
|
|
Alkalinity |
ppm |
unregulated |
|
n/a |
118 |
|
|
|
|
|
|
|
|
Conductivity |
μmhos/cm |
unregulated |
|
n/a |
250 |
|
|
|
|
|
|
|
|
Hardness (Total) |
ppm |
unregulated |
|
n/a |
(133 - 137) 137 |
|
|
|
|
|
|
|
|
Iron |
ppm |
|
0.3 |
n/a |
ND |
|
Manganese |
ppm |
|
0.05 |
n/a |
ND |
|
|
|
|
|
|
|
|
Orthophosphate as P |
ppm |
unregulated |
|
n/a |
ND |
|
pH |
pH units |
|
6.5 - 8.5 |
no |
(7.6 - 7.8) 7.7 |
|
Sodium |
ppm |
unregulated |
|
n/a |
3.7 |
|
Zinc |
ppm |
|
5 |
n/a |
ND |
|
|
|
|
|
|
|
|
Microbiological Substances |
Units |
EPA’s MCLG |
Highest Level Allowed - EPA’s MCL |
Violation |
Distribution System |
|
Total Coliforms |
P/A |
0 |
Presence of coliform bacteria in >5% of monthly samples |
no |
1 |
|
|
|
|
|
|
|
|
E. coli |
P/A |
0 |
A routine and a repeat sample are total coliform positive, and one |
no |
0 |
|
is also fecal coliform or E. coli positive. |
||||||
|
|
|
|
|
12
Falling Creek &
Beaverdam Creek
Reservoirs
Roanoke Systems
Falling Creek Reservoir is a surface water source located in Bedford County east of Vinton. It covers 21 acres and stores
How is it treated? The treatment process of this water source is similar to that of Spring Hollow Treatment Facility. The treatment capacity is
Where does it serve? Falling Creek Water Treatment Facility serves King Street northeast to Route 460, along Route 24 to 13th Street and east on Route 24 to Stewartsville. Falling Creek was not utilized during 2020. Residents in the Falling Creek service area received water from the Carvins Cove system.
Many other primary and secondary contaminants have been analyzed but were either below the instrument’s detection limits or below the MCLs.
|
|
Ideal Goals |
Highest Level |
|
Falling Creek Data |
|
Substance |
Units |
(EPA’s |
Allowed |
Violation |
||
(range) average |
||||||
|
|
MCLG) |
(EPA’s MCL) |
|
||
|
|
|
|
|||
Regulated Substances |
|
|
|
|
|
|
|
|
|
|
|
|
|
Barium |
ppm |
2 |
2 |
no |
0.01 |
|
|
|
|
|
|
|
|
Chromium |
ppm |
0.1 |
0.1 |
no |
0.0002 |
|
|
|
|
|
|
|
|
Fluoride |
ppm |
4 |
4 |
no |
0.05 |
|
|
|
|
|
|
|
|
Thallium |
ppm |
0.0005 |
0.002 |
no |
0.00005 |
|
|
|
|
|
|
|
|
Total Nitrate & Nitrite (as N) |
ppm |
10 |
10 |
no |
ND |
|
|
|
|
|
|
|
|
Total Organic Carbon |
ppm |
TT |
N/A |
no |
0.8 |
|
|
|
|
|
|
|
|
Turbidity |
NTU |
TT |
0.3 |
no |
(0.03 - 0.24) 0.08 |
|
|
|
|
|
|
|
|
Radioactive Contaminants |
|
|
|
|
|
|
|
|
|
|
|
|
|
Gross Alpha |
pCi/L |
0 |
15 |
no |
- 0.83 |
|
|
|
|
|
|
|
|
Gross Beta |
pCi/L |
0 |
50 |
no |
0.11 |
|
|
|
|
|
|
|
|
Radium 228 |
pCi/L |
0 |
5 |
no |
||
|
|
|
|
|
|
|
Combined Radium |
pCi/L |
0 |
5 |
no |
|
|
|
|
|
|
|
|
|
Lead and Copper Testing |
|
|
|
|
|
|
|
|
|
|
|
|
|
Lead |
ppb |
0 ppb |
AL = 15 |
no |
0 of 52 samples exceeded AL |
|
90th percentile = 1.51 ppb |
||||||
|
|
|
|
|
||
Copper |
ppm |
1.3 ppm |
AL = 1.3 |
no |
0 of 52 samples exceeded AL |
|
90th percentile = 0.30 ppm |
||||||
|
|
|
|
|
||
Disinfectants and Disinfection |
|
|
|
|
||
|
|
|
|
|
|
|
Chlorate |
ppm |
|
0.8 |
no |
N/A |
|
|
|
|
|
|
|
|
Chlorine |
ppm |
|
4 |
no |
(0.9 - 1.9) 1.2 |
|
|
|
|
|
|
|
|
Chlorite |
ppm |
|
0.8 |
no |
N/A |
|
|
|
|
|
|
|
|
HAA5s |
ppb |
0 |
60 |
no |
(ND - 61) site range |
|
(7 - 38) LRAA range |
||||||
|
|
|
|
|
||
TTHMs |
ppb |
0 |
80 |
no |
(15 - 80) site range |
|
(24 - 81) LRAA range |
||||||
|
|
|
|
|
||
Unregulated and Secondary Substances |
|
|
|
|
||
|
|
|
|
|
|
|
Alkalinity |
ppm |
unregulated |
|
n/a |
(12 - 20) 18 |
|
|
|
|
|
|
|
|
Conductivity |
μmhos/cm |
unregulated |
|
n/a |
67.1 |
|
|
|
|
|
|
|
|
Hardness (Total) |
ppm |
unregulated |
|
n/a |
(16 - 18) 17 |
|
|
|
|
|
|
|
|
Iron |
ppm |
|
0.3 |
n/a |
(ND - 0.04) 0.02 |
|
Manganese |
ppm |
|
0.05 |
n/a |
0.01 |
|
|
|
|
|
|
|
|
Orthophosphate as P |
ppm |
unregulated |
|
n/a |
(0.1 - 0.29) 0.19 |
|
pH |
pH units |
|
6.5 - 8.5 |
no |
(7.1 - 8.6) 7.9 |
|
Sodium |
ppm |
unregulated |
|
n/a |
8.92 |
|
Zinc |
ppm |
|
5 |
n/a |
0.13 |
|
|
|
|
|
|
|
|
Microbiological Substances |
Units |
EPA’s MCLG |
Highest Level Allowed - EPA’s MCL |
Violation |
Distribution System |
|
Total Coliforms |
P/A |
0 |
Presence of coliform bacteria in >5% of monthly samples |
no |
0 |
|
|
|
|
|
|
|
|
E. coli |
P/A |
0 |
A routine and a repeat sample are total coliform positive, and one |
no |
0 |
|
is also fecal coliform or E. coli positive. |
||||||
|
|
|
|
|
13
Muse Spring
Treatment Facility
The Muse Spring Water Treatment Facility (WTF), located at the site of Muse Spring on Riverland Road, treats raw water from Muse Spring and Garden City Well No. 3. This facility has the capacity to treat
How is it treated? The water is filtered in the Muse Spring Ultrafiltration Treatment Facility which filters out all particles larger than 0.01 micron. One micron is one thousandth of a millimeter. Filtered water is treated with chlorine, fluoride and orthophosphate and pumped to water customers from the Muse Spring Pumping Station.
Where does it serve? Muse Spring ties directly into the existing Authority distribution system and will help serve the eastern portion of the Carvins Cove service area southeast of downtown.
Many other primary and secondary contaminants have been analyzed but were either below the instrument’s detection limits or below the MCLs.
Water treated at the Muse Spring Treatment Facility meets all state and federal monitoring and reporting requirements.
|
|
Ideal Goals |
Highest Level |
|
Muse Spring WTf Data |
|
Substance |
Units |
Allowed |
Violation |
|||
(EPA’s MCLG) |
(range) average |
|||||
|
|
(EPA’s MCL) |
|
|||
|
|
|
|
|
||
Regulated Substances |
|
|
|
|
|
|
|
|
|
|
|
|
|
Barium |
ppm |
2 |
2 |
no |
|
|
|
|
|
|
|
|
|
Fluoride |
ppm |
4 |
4 |
no |
(0.5 - 0.7) 0.6 |
|
|
|
|
|
|
|
|
Total Nitrate & Nitrite |
ppm |
10 |
10 |
no |
|
|
(as N) |
|
|||||
|
|
|
|
|
||
Total Organic Carbon |
ppm |
TT |
N/A |
no |
NA |
|
|
|
|
|
|
|
|
Turbidity |
NTU |
TT |
0.3 |
no |
(0.01 - 0.25) 0.05 |
|
|
|
|
|
|
|
|
Radioactive Contaminants |
|
|
|
|
||
|
|
|
|
|
|
|
Gross Alpha |
pCi/L |
0 |
15 |
no |
|
|
|
|
|
|
|
|
|
Gross Beta |
pCi/L |
0 |
50 |
no |
|
|
|
|
|
|
|
|
|
Radium 228 |
|
|
|
|
|
|
|
|
|
|
|
|
|
Combined Radium |
pCi/L |
0 |
5 |
no |
|
|
|
|
|
|
|
|
|
Lead and Copper Testing |
|
|
|
|
||
|
|
|
|
|
|
|
Lead |
ppb |
0 ppb |
AL = 15 |
no |
0 of 10 samples exceeded AL |
|
90th percentile = 1.5 ppb |
||||||
|
|
|
|
|
||
Copper |
ppm |
1.3 ppm |
AL = 1.3 |
no |
0 of 10 samples exceeded AL |
|
90th percentile = 0.223 ppm |
||||||
|
|
|
|
|
||
Disinfectants and Disinfection |
|
|
|
|||
|
|
|
|
|
|
|
Chlorate |
ppm |
|
0.8 |
no |
NA |
|
|
|
|
|
|
|
|
Chlorine |
ppm |
|
4 |
no |
(1.0 - 1.2) 1.12 |
|
|
|
|
|
|
|
|
Chlorite |
ppm |
|
0.8 |
no |
NA |
|
|
|
|
|
|
|
|
HAA5s |
ppb |
0 |
60 |
no |
(ND - 61) site range |
|
(7 - 38) LRAA range |
||||||
|
|
|
|
|
||
TTHMs |
ppb |
0 |
80 |
no |
(15 - 80) site range |
|
(24 - 81) LRAA range |
||||||
|
|
|
|
|
||
Unregulated and Secondary Substances |
|
|
|
|||
|
|
|
|
|
|
|
Alkalinity |
ppm |
unregulated |
|
n/a |
|
|
|
|
|
|
|
|
|
Conductivity |
μmhos/cm |
unregulated |
|
n/a |
|
|
|
|
|
|
|
|
|
Hardness (Total) |
ppm |
unregulated |
|
n/a |
(120 - 137) 130 |
|
|
|
|
|
|
|
|
Iron |
ppm |
|
0.3 |
n/a |
|
|
Manganese |
ppm |
|
0.05 |
n/a |
|
|
|
|
|
|
|
|
|
Orthophosphate as P |
ppm |
unregulated |
|
n/a |
(0.13 - 0.26) 0.21 |
|
pH |
pH units |
|
6.5 - 8.5 |
no |
(7.3 - 7.6) 7.5 |
|
Sodium |
ppm |
unregulated |
|
n/a |
|
|
Zinc |
ppm |
|
5 |
n/a |
|
|
|
|
|
|
|
|
|
Microbiological Substances |
Units |
EPA’s MCLG |
Highest Level Allowed - EPA’s MCL |
Violation |
Distribution System |
|
Total Coliforms |
P/A |
0 |
Presence of coliform bacteria in >5% of monthly samples |
no |
3 |
|
|
|
|
|
|
|
|
E. coli |
P/A |
0 |
A routine and a repeat sample are total coliform positive, and one |
no |
0 |
|
is also fecal coliform or E. coli positive. |
||||||
|
|
|
|
|
14

Spring Hollow
Reservoir &
Treatment Facility
The water source for this system comes |
|
|
|
|
|
|
|
|
|
|
|
||||||||
|
|
Substance |
|
Units |
Ideal Goals |
Highest Level Allowed |
Violation |
|
Spring Hollow Data |
||||||||||
from the Roanoke River and is pumped into |
|
|
|
(EPA’s MCLG) |
(EPA’s MCL) |
|
(range) average |
||||||||||||
the Spring Hollow Reservoir, a |
|
|
|
|
|
|
|
|
|
|
|||||||||
|
|
Regulated Substances |
|
|
|
|
|
||||||||||||
gallon |
|
|
|
|
|
|
|
|
|
|
|
|
|
||||||
|
|
|
|
Barium |
|
ppm |
2 |
2 |
no |
0.03 |
|||||||||
|
|
|
|
|
|
|
|
|
|
|
|
||||||||
|
|
|
|
|
|
|
|
|
|
|
|
|
|
|
|
|
|
|
|
How is it treated? Water is first oxygenated |
|
|
Fluoride |
|
ppm |
4 |
4 |
no |
(0.7 - 0.77) 0.73 |
||||||||||
|
|
|
|
|
|
|
|
|
|
|
|||||||||
|
|
Total Nitrate & |
|
ppm |
10 |
10 |
no |
0.4 |
|||||||||||
in the reservoir, then the water is withdrawn |
|
|
|
||||||||||||||||
|
|
Nitrite (as N) |
|
||||||||||||||||
from the reservoir and treated with sodium |
|
|
|
|
|
|
|
|
|
|
|
||||||||
|
|
Total Organic |
|
ppm |
TT |
N/A |
no |
(1.08 - 1.37) 1.23 |
|||||||||||
hypochlorite |
and |
sodium |
permangante |
|
|
|
|||||||||||||
|
|
Carbon |
|
||||||||||||||||
to oxidize dissolved |
organic |
matter, |
|
iron |
|
|
|
|
|
|
|
|
|
|
|
||||
|
|
|
|
|
|
|
Percent of samples |
|
|
|
|||||||||
and manganese. |
Treatment at the Spring |
|
|
|
|
|
|
|
|
|
|
||||||||
|
|
Turbidity |
|
NTU |
TT |
that met treatment |
no |
|
maxium 0.24/ 100% |
||||||||||
Hollow Treatment Facility includes upflow |
|
|
|
|
|
|
|
requirement of 0.3 NTU |
|
|
|
||||||||
clarification, filtration, chlorine disinfection |
|
|
Radioactive Contaminants |
|
|
|
|
|
|||||||||||
and fluoridation. Orthophosphate is added |
|
|
|
|
|
|
|
|
|
|
|
||||||||
|
|
Gross Alpha |
|
pCi/L |
0 |
15 |
no |
0.24 |
|||||||||||
to control corrosion in pipes. The Spring |
|
|
|
|
|
|
|
|
|
|
|
||||||||
|
|
Gross Beta |
|
pCi/L |
0 |
50 |
no |
2.4 |
|||||||||||
Hollow Water Treatment Facility currently |
|
|
|
||||||||||||||||
|
|
|
|
|
|
|
|
|
|
|
|||||||||
|
|
Radium 228 |
|
|
|
|
|
0.36 |
|||||||||||
has the capacity to treat |
|
|
|
|
|
|
|
||||||||||||
|
|
|
|
|
|
|
|
|
|
|
|||||||||
|
|
Combined Radium |
|
pCi/L |
0 |
5 |
no |
0.6 |
|||||||||||
of water a day and can be expanded to |
|
|
|
||||||||||||||||
|
|
Lead and Copper Testing |
|
|
|
|
|
||||||||||||
stored in a |
|
|
Lead |
|
ppb |
0 ppb |
AL = 15 |
no |
|
0 of 52 samples exceeded AL |
|||||||||
then pumped through the north and south |
|
|
|
|
90th percentile = 1.51 ppb |
||||||||||||||
|
|
|
|
|
|
|
|
|
|
||||||||||
transmission lines to the distribution system. |
|
|
Copper |
|
ppm |
1.3 ppm |
AL = 1.3 |
no |
|
0 of 52 samples exceeded AL |
|||||||||
Annual production averaged |
|
|
|
|
90th percentile = 0.30 ppm |
||||||||||||||
|
|
|
|
|
|
|
|
|
|
||||||||||
gallons a day. During an emergency, standby |
|
|
Disinfectants and Disinfection |
|
|
|
|
||||||||||||
wells may be used to supplement the source |
|
|
|
|
|
|
|
|
|
|
|
||||||||
|
|
Chlorate |
|
ppm |
|
0.8 |
no |
|
(ND - 0.21) 0.07 |
||||||||||
water. |
|
|
|
|
|
|
|
|
|
|
|
|
|||||||
|
|
|
|
|
|
|
|
|
|
|
|
|
|
|
|
|
|
||
|
|
|
|
|
|
|
|
|
Chlorine |
|
ppm |
|
4 |
no |
(1.18 - 1.3) 1.24 |
||||
|
|
|
|
|
|
|
|
|
|
|
|
|
|||||||
|
|
|
|
|
|
|
|
|
|
|
|
|
|
|
|||||
Where does it serve? Spring Hollow supplies |
|
|
Chlorite |
|
ppm |
|
0.8 |
no |
|
ND |
|||||||||
water to various neighborhoods in Roanoke |
|
|
HAA5s |
|
ppb |
0 |
60 |
no |
|
(ND - 61) site range |
|||||||||
County and Franklin County through the |
|
|
|
|
(7 - 38) LRAA range |
||||||||||||||
|
|
|
|
|
|
|
|
|
|
||||||||||
southern transmission lines. The northern |
|
|
TTHMs |
|
ppb |
0 |
80 |
no |
|
(15 - 80) site range |
|||||||||
transmission lines run along |
|
|
|
|
(24 - 81) LRAA range |
||||||||||||||
|
|
|
|
|
|
|
|
|
|
||||||||||
the City of Roanoke and Roanoke County. |
|
|
Unregulated and Secondary Substances |
|
|
|
|
||||||||||||
Many other primary and secondary |
|
|
Alkalinity |
|
ppm |
unregulated |
|
n/a |
(124 - 139) 132 |
||||||||||
|
|
|
|
|
|
|
|
|
|
|
|||||||||
|
|
Conductivity |
|
μmhos/cm |
unregulated |
|
n/a |
294 |
|||||||||||
contaminants have been analyzed but were |
|
|
|
|
|
|
|
|
|
|
|
||||||||
|
|
Hardness (Total) |
|
ppm |
unregulated |
|
n/a |
(150 - 161) 156 |
|||||||||||
either below |
the |
instrument’s detection |
|
|
|
|
|||||||||||||
|
|
|
|
|
|
|
|
|
|
|
|||||||||
|
|
|
Iron |
|
ppm |
|
0.3 |
n/a |
|
ND |
|||||||||
limits or below the MCLs. |
|
|
|
|
|
|
|
|
|
||||||||||
|
|
|
|
|
Manganese |
|
ppm |
|
0.05 |
n/a |
|
ND |
|||||||
|
|
|
|
|
|
|
|
|
|
|
|
|
|
||||||
Water treated at the Spring Hollow |
|
|
|
|
|
|
|
|
|
|
|
||||||||
|
|
Orthophosphate |
|
ppm |
unregulated |
|
n/a |
(0.23 - 0.34) 0.25 |
|||||||||||
Treatment |
Facility |
meets |
all |
state |
|
|
|
as P |
|
|
|
|
|
|
|
||||
and federal monitoring and reporting |
|
|
|
pH |
|
pH units |
|
6.5 - 8.5 |
no |
(7.6 - 7.8) 7.6 |
|||||||||
requirements. |
|
|
|
|
|
|
|
|
Sodium |
|
ppm |
unregulated |
|
n/a |
4.8 |
||||
|
|
|
|
|
|
|
|
|
|
|
|
Zinc |
|
ppm |
|
5 |
n/a |
|
ND |
|
|
|
|
|
|
|
|
|
|
|
|
|
|
|
|||||
|
|
|
|
|
|
|
|
|
|
|
|||||||||
|
Microbiological Substances |
Units |
|
EPA’s MCLG |
Highest Level Allowed - EPA’s MCL |
Violation |
|
Distribution System |
|||||||||||
|
Total Coliforms |
|
P/A |
|
|
0 |
|
Presence of coliform bacteria in >5% of monthly samples |
no |
|
1 |
||||||||
|
|
|
|
|
|
|
|
|
|
|
|
|
|
|
|
||||
|
|
E. coli |
|
|
P/A |
|
|
0 |
|
A routine and a repeat sample are total coliform positive, and one |
no |
|
1 |
||||||
|
|
|
|
|
|
|
|
|
is also fecal coliform or E. coli positive. |
|
|||||||||
|
|
|
|
|
|
|
|
|
|
|
|
|
|
|
|
|
|||
|
|
|
|
|
|
|
|
|
|
|
|
|
|
|
|
|
|
|
15 |
Roanoke Systems

Community
Well Systems
The Authority maintains well systems that serve the community of Martin Creek and over 20 other wells in the Roanoke area. While many of these wells are inactive, they can offer an additional supply of water if needed. Wells* represent those in service in 2020 including Garden City #2, LaBellevue 7, Muse Spring Well, North Lakes 6, and Starkey 3. Data presented as (range) average.
The Western Virginia Water Authority is pleased to meet all requirements, and there were no drinking water violations in calendar year 2020.
Martin Creek System
Seven wells supply this groundwater source, which is disinfected with chlorine prior to distribution. Water is distributed throughout the community by two storage tanks and distribution piping consisting of
According to results of the chemical analyses for Metals based on a sample collected in 2019, the sodium in the treated water in wells 1, 2 and 10 had sodium ranging from 24.1 - 7 ppm. This is above the EPA recommended optimal level of less than 20 mg/L for sodium in drinking water, which is established for those individuals on a “strict” sodium intake diet.
Substance |
Units |
Ideal Goals - |
Highest Level |
Martin Creek |
Wells* |
|
EPA’s MCLG |
Allowed (EPA’s MCL) |
|||||
|
|
|
|
|||
Regulated Substances |
|
|
|
|
|
|
|
|
|
|
|
|
|
Antimony |
ppm |
0.006 |
0.006 |
(ND - 0.00013) |
(ND - 0.0001) |
|
0.00002 |
0.00001 |
|||||
|
|
|
|
|||
|
|
|
|
|
|
|
Arsenic |
ppm |
0 |
0.01 |
(ND - 0.00011) |
(ND - 0.0002) |
|
0.00002 |
0.00006 |
|||||
|
|
|
|
|||
|
|
|
|
|
|
|
Barium |
ppm |
2 |
2 |
(0.002 - 0.02) 0.009 |
(0.036 - 0.14) |
|
|
0.08 |
|||||
|
|
|
|
|
||
|
|
|
|
|
|
|
Beryllium |
ppm |
0.004 |
0.004 |
(ND - 0.00006) |
(ND 0.0003) |
|
0.00002 |
0.00006 |
|||||
|
|
|
|
|||
|
|
|
|
|
|
|
Cadmium |
ppm |
0.005 |
0.005 |
(ND - 0.00005) |
(ND - 0.0001) |
|
0.00002 |
0.00001 |
|||||
|
|
|
|
|||
|
|
|
|
|
|
|
Chromium |
ppm |
0.1 |
0.1 |
(0.00023 - 0.00084) |
(ND - 0.0018) |
|
0.00053 |
0.00096 |
|||||
|
|
|
|
|||
|
|
|
|
|
|
|
Fluoride |
ppm |
4 |
4 |
(0.2 - 1.6) 0.7 |
(0.1 - 0.3) 0.2 |
|
|
|
|
|
|
|
|
Selenium |
ppm |
0.05 |
0.05 |
ND |
(ND - 0.00135) |
|
0.00034 |
||||||
|
|
|
|
|
||
|
|
|
|
|
|
|
Thallium |
ppm |
0.0005 |
0.002 |
(ND - 0.00009) |
(ND - 0.00011) |
|
0.00005 |
0.00002) |
|||||
|
|
|
|
|||
|
|
|
|
|
|
|
Total Nitrate & Nitrite (as N) |
ppm |
10 |
10 |
(ND - 0.47) 0.25 |
(0.5 - 0.9) 0.7 |
|
|
|
|
|
|
|
|
Turbidity |
NTU |
TT |
0.3 |
(0.08 - 0.21) 0.12 |
(ND - 0.2) 0.1 |
|
|
|
|
|
|
|
|
Radioactive Contaminants |
|
|
|
|
|
|
|
|
|
|
|
|
|
Gross Alpha |
pCi/L |
0 |
15 |
(0.7 - 3.2) 2.1 |
(1.2 - 2.10) 1.64 |
|
|
|
|
|
|
|
|
Gross Beta |
pCi/L |
0 |
50 |
(2.2 - 4.5) 2.94 |
||
|
|
|
|
|
|
|
Radium 228 |
pCi/L |
0 |
5 |
(ND - 1.9) 0.6 |
||
|
|
|
|
|
|
|
Combined Radium |
pCi/L |
0 |
5 |
(ND - 2.5) 1.3 |
|
|
|
|
|
|
|
|
|
Lead and Copper Testing |
|
|
|
|
|
|
|
|
|
|
|
|
|
|
|
|
|
0 of 5 samples |
0 of 52 samples |
|
Lead |
ppb |
0 ppb |
AL = 15 |
exceeded AL |
exceeded AL |
|
90th percentile |
90th percentile |
|||||
|
|
|
|
|||
|
|
|
|
= 3.2 ppb |
= 1.51 ppb |
|
|
|
|
|
|
|
|
|
|
|
|
0 of 5 samples |
0 of 52 samples |
|
Copper |
ppm |
1.3 ppm |
AL = 1.3 |
exceeded AL |
exceeded AL |
|
90th percentile |
90th percentile |
|||||
|
|
|
|
|||
|
|
|
|
= 0.212 ppm |
= 0.3 ppm |
|
|
|
|
|
|
|
|
Disinfectants and Disinfection |
|
|
|
|
||
|
|
|
|
|
|
|
Chlorine |
ppm |
|
4 |
(0.95 - 1.76) 1.41 |
(0.9 - 1.5) 1.1 |
|
|
|
|
|
|
|
|
HAA5 |
ppb |
0 |
60 |
5.6 |
|
|
|
|
|
|
|
|
|
TTHM |
ppb |
0 |
80 |
21.6 |
|
|
|
|
|
|
|
|
|
Microbiological Substances |
|
|
|
|
|
|
|
|
|
|
|
|
|
Total Coliforms |
P/A |
0 |
Presence of coliform bacteria in |
0 |
0 |
|
>5% of monthly samples |
||||||
|
|
|
|
|
||
|
|
|
A routine and a repeat sample |
|
|
|
E. coli |
P/A |
0 |
are total coliform positive, and |
0 |
0 |
|
one is also fecal coliform or E. |
||||||
|
|
|
|
|
||
|
|
|
coli positive. |
|
|
|
|
|
|
|
|
|
|
Unregulated and Secondary Substances |
|
|
|
|
||
|
|
|
|
|
|
|
Alkalinity |
ppm |
unregulated |
|
(110 - 210) 182 |
||
|
|
|
|
|
|
|
Conductivity |
μmhos/cm |
unregulated |
|
(278 - 859) 514 |
||
|
|
|
|
|
|
|
Hardness (Total) |
ppm |
unregulated |
|
(124 - 380) 232 |
||
|
|
|
|
|
|
|
Iron |
ppm |
|
0.3 |
(ND - 0.058) 0.02 |
(ND - 0.068) 0.02 |
|
Manganese |
ppm |
|
0.05 |
(0.0003 - 0.042) |
||
|
0.015 |
|||||
|
|
|
|
|
||
|
|
|
|
|
|
|
Orthophosphate as P |
ppm |
unregulated |
|
ND |
ND |
|
pH |
pH units |
|
6.5 - 8.5 |
(6.9 - 7.5) 7.2 |
||
Sodium |
ppm |
unregulated |
|
(11.7 - 27) 19.8 |
(2.8 - 8.0) 5.2 |
|
Zinc |
ppm |
|
5 |
(0.02 - 0.46) 0.15 |
(0.003 - 0.008) |
|
|
0.006 |
|||||
|
|
|
|
|
||
16

City of Salem
Source
The Western Virginia Water Authority contracts with the City of Salem to purchase water to supply Robin Hood Park and other areas around West Main Street and Riverside Drive in Roanoke County. The City of Salem’s water source is the Roanoke River and three ground water wells.
If you have any questions about this data, please contact the City of Salem Water Department at
The City of Salem Water Department routinely monitors for contaminants in the drinking water mandated by Federal and State laws. The following table shows the results of monitoring for the period of January 1st to December 31st, 2020 or the most recent monitoring period. The City of Salem Water Department had no violations during this time period.
The Virginia Department of Health has completed a source water assessment for Salem’s waterworks system. This assessment provides information on possible sources of contamination to our source water. As determined by the source water assessment, the possibility of contamination to our water source (Roanoke River) is high. This is due to the fact that surface water is exposed to an inconsistent array of contaminants at varying concentrations due to changing hydrologic, hydraulic and atmospheric conditions with land use activities of concern in the assessment area. To view a copy of this water assessment, please contact the City of Salem Water Department office at
|
|
|
Ideal Goals |
Highest Level |
|
City of Salem Data |
Substance |
|
Units |
Allowed |
Violation |
||
|
(EPA’s MCLG) |
(range) average |
||||
|
|
|
(EPA’s MCL) |
|
||
|
|
|
|
|
|
|
Regulated Substances |
|
|
|
|
|
|
|
|
|
|
|
|
|
Barium |
|
ppm |
2 |
2 |
no |
0.044 |
|
|
|
|
|
|
|
Fluoride |
|
ppm |
4 |
4 |
no |
(0.27 - 0.79) |
|
|
|
|
|
|
|
Total Nitrate & |
|
ppm |
10 |
10 |
no |
0.43 |
Nitrite (as N) |
|
|||||
|
|
|
|
|
|
|
Total Organic |
|
ppm |
TT |
N/A |
no |
1.0 |
Carbon |
|
|||||
|
|
|
|
|
|
|
Turbidity |
|
NTU |
TT |
0.3 |
no |
(0.03 - 0.12) |
|
|
|
|
|
|
|
Radioactive Contaminants |
|
|
|
|
||
|
|
|
|
|
|
|
Gross Alpha |
|
pCi/L |
0 |
15 |
no |
± 0.7 - 0.51 |
|
|
|
|
|
|
|
Gross Beta |
|
pCi/L |
0 |
50 |
no |
± 3.0 - 0.69 |
|
|
|
|
|
|
|
Combined Radium |
|
pCi/L |
0 |
5 |
no |
± 0.6 - 0.49 |
|
|
|
|
|
|
|
Lead and Copper Testing |
|
|
|
|
||
|
|
|
|
|
|
|
Lead |
|
ppb |
0 ppb |
AL = 15 |
no |
0 of 32 samples exceeded AL |
|
90th percentile = 2.1 ppb |
|||||
|
|
|
|
|
|
|
Copper |
|
ppm |
1.3 ppm |
AL = 1.3 |
no |
0 of 32 samples exceeded AL |
|
90th percentile = 0.07 ppm |
|||||
|
|
|
|
|
|
|
Disinfectants and Disinfection |
|
|
|
|||
|
|
|
|
|
|
|
Chlorine |
|
ppm |
|
4 |
no |
(1.03 - 2.0) |
|
|
|
|
|
|
|
Chlorite |
|
ppm |
|
0.8 |
no |
N/A |
|
|
|
|
|
|
|
HAA5s |
|
ppb |
0 |
60 |
no |
(12.0 - 45.8) LRAA 31 |
|
|
|
|
|
|
|
TTHMs |
|
ppb |
0 |
80 |
no |
(12.9 |
|
|
|
|
|
|
|
Unregulated and Secondary Substances |
|
|
|
|||
|
|
|
|
|
|
|
Alkalinity |
|
ppm |
unregulated |
|
n/a |
(122 - 182) |
|
|
|
|
|
|
|
Hardness (Total) |
|
ppm |
unregulated |
|
n/a |
(121 - 240) |
|
|
|
|
|
|
|
pH |
|
pH units |
|
6.5 - 8.5 |
no |
(7.35 - 7.96) |
Sodium |
|
ppm |
unregulated |
|
n/a |
4.87 |
Zinc |
|
ppm |
|
5 |
n/a |
< 0.01 |
|
|
|
|
|
|
|
Roanoke Systems
Microbiological Substances |
Units |
EPA’s MCLG |
Highest Level Allowed - EPA’s MCL |
Violation |
Level Detected in Salem |
|
|
|
|
|
|
|
|
Total Coliforms |
P/A |
0 |
|
Presence of coliform bacteria in >5% of monthly samples |
no |
0 |
|
|
|
|
|
|
|
E. coli |
P/A |
0 |
|
A routine and a repeat sample are total coliform positive, and one is |
no |
0 |
|
also fecal coliform or E. coli positive. |
|||||
|
|
|
|
|
|
|
Source Water Testing - this data does not apply to treated water |
|
|
|
|||
|
|
|
|
|
|
|
Cryptosporidium |
Oocysts per 1L |
0 |
|
99% removal by filtration plus addition as required |
no |
(0.098 - 0.103) |
|
under the LT2ESWTR |
|||||
|
|
|
|
|
|
|
Giardia |
Cysts per 1L |
0 |
|
99% removal or inactivation |
no |
1.0 - 2.0 |
|
|
|
|
|
|
|
17
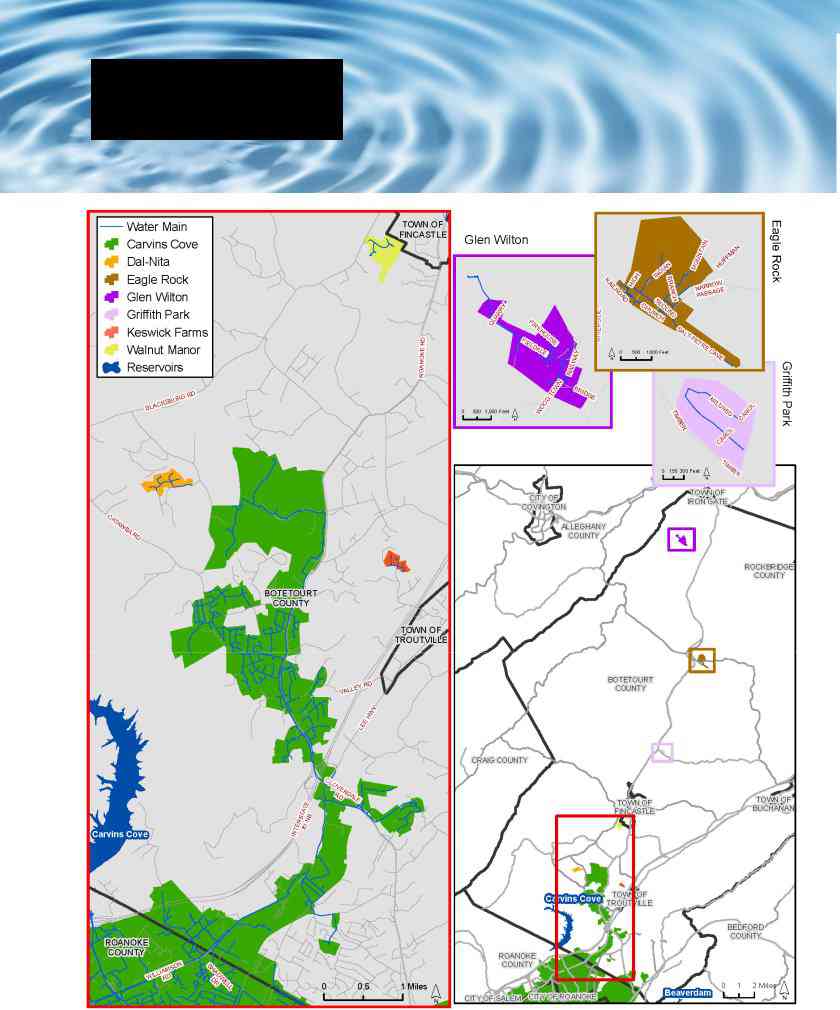
Botetourt County
Water Systems
On July 1, 2015, Botetourt County consolidated its utility system with the Western Virginia Water Authority. This joinder allowed for the expansion of the Carvins Cove service area to include customers in the former Greenfield and Tinkerview Garden well service areas. The water quality of Carvins Cove, particularly in terms of the mineral content, is more beneficial to meeting the needs of industries and residents. Other customers in the Botetourt service area receive water from community wells.
18
|
|
Greenfield and Tinkerview |
|
Customers in Greenfield and along the southern end of |
||||||
|
|
Garden Areas |
|
|
US Route 220 to the |
|||||
|
|
|
|
water from the treatment plant that treats surface water |
||||||
|
|
|
|
|
|
|
|
|||
|
|
|
|
|
|
|
|
from Carvins Cove Reservoir. |
|
|
|
|
|
|
|
|
|
|
|
|
|
|
|
|
|
|
|
|
|
|
||
|
|
Substance |
Units |
Ideal Goals |
|
Highest Level Allowed |
Violation |
Carvins Cove Data |
||
|
|
(EPA’s MCLG) |
|
|
(EPA’s MCL) |
(range) average |
||||
|
|
|
|
|
|
|
||||
|
Regulated Substances |
|
|
|
|
|
|
|
|
|
|
|
|
|
|
|
|
|
|
|
|
|
|
Barium |
ppm |
2 |
|
|
2 |
|
no |
0.05 |
|
|
|
|
|
|
|
|
|
|
|
|
|
Fluoride |
ppm |
4 |
|
|
4 |
|
no |
(0.39 - 0.76) 0.61 |
|
|
|
|
|
|
|
|
|
||
|
Total Nitrate & Nitrite (as N) |
ppm |
10 |
|
|
10 |
no |
ND |
||
|
|
|
|
|
|
|
|
|
|
|
|
|
Total Organic Carbon |
ppm |
TT |
|
|
N/A |
no |
(1.43 - 2.0) 1.73 |
|
|
|
|
|
|
|
|
|
|
||
|
|
Turbidity |
NTU |
TT |
|
Percent of samples that met treatment requirement of |
no |
maximum 0.23/ 100% |
||
|
|
|
|
0.3 NTU |
||||||
|
|
|
|
|
|
|
|
|
||
|
Radioactive Contaminants |
|
|
|
|
|
|
|
|
|
|
|
|
|
|
|
|
|
|
|
|
|
|
Gross Alpha |
pCi/L |
0 |
|
|
15 |
no |
0.7 |
|
|
|
|
|
|
|
|
|
|
|
|
|
|
Gross Beta |
pCi/L |
0 |
|
|
50 |
no |
1.7 |
|
|
|
|
|
|
|
|
|
|
|
|
|
|
Radium 228 |
pCi/L |
0 |
|
|
5 |
|
no |
< 0.35 |
|
|
|
|
|
|
|
|
|
|
|
|
|
Combined Radium |
pCi/L |
0 |
|
|
5 |
|
no |
0.7 |
|
|
|
|
|
|
|
|
|
|
|
|
Lead and Copper Testing |
|
|
|
|
|
|
|
|
|
|
|
|
|
|
|
|
|
|
|
|
|
|
Lead |
ppb |
0 ppb |
|
|
AL = 15 |
no |
0 of 52 samples exceeded AL |
|
|
|
|
|
90th percentile = 1.51 ppb |
||||||
|
|
|
|
|
|
|
|
|
|
|
|
|
Copper |
ppm |
1.3 ppm |
|
|
AL = 1.3 |
no |
0 of 52 samples exceeded AL |
|
|
|
|
|
90th percentile = 0.30 ppm |
||||||
|
|
|
|
|
|
|
|
|
|
|
|
Disinfectants and Disinfection |
|
|
|
|
|
|
|
||
|
|
|
|
|
|
|
|
|
|
|
|
|
Chlorate |
ppm |
|
|
|
0.8 |
no |
(0.01 - 0.02) 0.01 |
|
|
|
|
|
|
|
|
|
|
|
|
|
|
Chlorine |
ppm |
|
|
|
4 |
|
no |
(1.2 - 1.4) 1.3 |
|
|
|
|
|
|
|
|
|
|
|
|
|
Chlorite |
ppm |
|
|
|
0.8 |
no |
ND |
|
|
|
|
|
|
|
|
|
|
|
|
|
|
HAA5s |
ppb |
0 |
|
|
60 |
no |
(ND - 61) site range |
|
|
|
|
|
|||||||
|
|
|
|
|
|
|
|
|
|
|
|
|
TTHMs |
ppb |
0 |
|
|
80 |
yes |
(15 - 80) site range |
|
|
|
|
|
(24 - 81) LRAA range |
||||||
|
|
|
|
|
|
|
|
|
|
|
|
Microbiological Substances |
|
|
|
|
|
|
|
|
|
|
|
|
|
|
|
|
|
|
||
|
|
Total Coliforms |
P/A |
0 |
|
Presence of coliform bacteria in >5% of monthly samples |
no |
3 |
||
|
|
|
|
|
|
|
|
|
||
|
|
E.coli |
P/A |
0 |
|
A routine and a repeat sample are total coliform positive, |
no |
0 |
||
|
|
|
and one is also fecal coliform or E. coli positive. |
|||||||
|
|
|
|
|
|
|
|
|||
|
Unregulated and Secondary Substances |
|
|
|
|
|
|
|
||
|
|
|
|
|
|
|
|
|
|
|
|
|
Alkalinity |
ppm |
unregulated |
|
|
|
|
n/a |
(20 - 36) 26 |
|
|
|
|
|
|
|
|
|
|
|
|
|
Conductivity |
μmhos/cm |
unregulated |
|
|
|
|
n/a |
96.7 |
|
|
|
|
|
|
|
|
|
|
|
|
|
Hardness (Total) |
ppm |
unregulated |
|
|
|
|
n/a |
(26 - 42) 33 |
|
|
|
|
|
|
|
|
|
|
|
|
|
Iron |
ppm |
|
|
|
0.3 |
n/a |
(ND - 0.03) 0.023 |
|
|
|
Manganese |
ppm |
|
|
|
0.05 |
n/a |
(0.008 - 0.036) 0.02 |
|
|
|
|
|
|
|
|
|
|
|
|
|
|
Orthophosphate as P |
ppm |
unregulated |
|
|
|
|
n/a |
(0.24 - 0.29) 0.27 |
|
|
pH |
pH units |
|
|
|
6.5 - 8.5 |
no |
(7.4 - 7.7) 7.6 |
|
|
|
Sodium |
ppm |
unregulated |
|
|
|
|
n/a |
6.0 |
|
|
Zinc |
ppm |
|
|
|
5 |
|
n/a |
ND |
|
|
|
|
|
|
|
|
|
|
|
Botetourt County Systems
19
Botetourt Well
Systems
The Western Virginia Water Authority is pleased to report that Botetourt well systems meet all requirements, and there were no drinking water violations in calendar year 2020.
Dal-Nita Hills
Water from
Eagle Rock
Your drinking water is groundwater obtained from two wells. Disinfection treatment (by chlorination) is provided for both wells prior to discharge to the storage tank. Water is distributed from the storage tank by gravity.
Five samples were tested for Lead in 2019. No samples exceeded the Action Level and the 90th percentile was 7.91 ppb. Five samples were tested for Copper. No samples exceeded the Action Level and the 90th percentile was 0.175 ppm.
Glen Wilton
Your drinking water is groundwater and can be obtained from three wells. All wells are treated for iron and manganese removal by chemical precipitation and filtration and chlorine for disinfection. Wells 1 and 2 have higher levels of iron and manganese and these wells are normally not used. Well 3 is the primary source. Water is pumped from the treatment building to the storage tank and distribution piping.
Five samples were tested for Lead in 2019. No samples exceeded the Action Level and the 90th percentile was 2.92 ppb. Five samples were tested for Copper. No samples exceeded the Action Level and the 90th percentile was 0.096 ppm. According to results of the chemical analyses for Metals, the sodium in the treated water is 23.1 ppm. This is above the EPA recommended optimal level of less than 20 ppm for sodium in drinking water, which is established for those individuals on a “strict” sodium intake diet.
Griffith Park
Your drinking water is groundwater obtained from a drilled well. Water is pumped from the well to a metal storage tank behind the well house. A booster pump in the well house draws water from the tank and sends it to a pressure tank (also in the well house) and then throughout the community. Treatment is provided for iron and manganese. A small pump in the well house feeds a blend of orthophosphate and polyphosphate to sequester iron and manganese. Chlorine feed equipment was installed to continuously disinfect the water.
Manganese levels (0.356 - 0.368 ppm) and Iron levels (1.9
Five samples were tested for Lead in 2019. No samples exceeded the Action Level and the 90th percentile was 2.5 ppb. Five samples were tested for Copper. No samples exceeded the Action Level and the 90th percentile was 0.629 ppm.
Keswick Farms
Your drinking water is groundwater obtained from a drilled well. Water is distributed throughout the community by a storage tank and distribution piping. Chlorination treatment is provided. Public education materials on lead and copper are distributed to customers in this system each year.
Walnut Manor
Your drinking water is groundwater obtained from a drilled well. Water is distributed throughout the community by a storage tank and distribution piping. Chlorination treatment is provided. Public education materials on lead and copper are distributed to customers in this system each year.
20

|
|
|
|
|
|
|
|
|
|
|
|
|
|
Ideal Goals |
Highest Level |
Eagle Rock |
Glen Wilton |
Griffith Park |
Keswick Farm |
Walnut |
|
|
Substance |
Units |
(EPA’s |
Allowed |
Manor |
|||||
|
Wells |
Wells |
Wells |
Wells |
Wells |
|||||
|
|
|
MCLG) |
(EPA’s MCL) |
Wells |
|||||
|
|
|
|
|
|
|
|
|||
|
Regulated Substances |
|
|
|
|
|
|
|
|
|
|
|
|
|
|
|
|
|
|
|
|
|
Antimony |
ppm |
0.006 |
0.006 |
ND |
0.00005 |
ND |
ND |
0.00008 |
ND |
|
|
|
|
|
|
|
|
|
|
|
|
Arsenic |
ppm |
0 |
0.01 |
ND |
0.00017 |
0.00011 |
ND |
ND |
ND |
|
|
|
|
|
|
|
|
|
|
|
|
Barium |
ppm |
2 |
2 |
0.042 |
0.183 |
0.153 |
0.0785 |
0.135 |
0.12 |
|
|
|
|
|
|
|
|
|
|
|
|
Beryllium |
ppm |
0.004 |
0.004 |
ND |
ND |
ND |
ND |
ND |
ND |
|
|
|
|
|
|
|
|
|
|
|
|
Cadmium |
ppm |
0.005 |
0.005 |
ND |
ND |
ND |
ND |
ND |
ND |
|
|
|
|
|
|
|
|
|
|
|
|
Chromium |
ppm |
0.1 |
0.1 |
ND |
0.00025 |
0.00057 |
ND |
0.0013 |
0.001 |
|
|
|
|
|
|
|
|
|
|
|
|
Fluoride |
ppm |
4 |
4 |
0.087 |
0.148 |
0.12 |
0.134 |
0.44 |
2.3 |
|
|
|
|
|
|
|
|
|
|
|
|
Selenium |
ppm |
0.05 |
0.05 |
ND |
0.00102 |
ND |
ND |
ND |
ND |
|
|
|
|
|
|
|
|
|
|
|
|
Thallium |
ppm |
0.0005 |
0.002 |
ND |
0.00003 |
0.00001 |
ND |
0.00002 |
ND |
|
|
|
|
|
|
|
|
|
|
|
|
Total Nitrate & Nitrite (as N) |
ppm |
10 |
10 |
3.1 |
ND |
ND |
ND |
2.2 |
0.3 |
|
|
|
|
|
|
|
|
|
|
|
|
Turbidity |
NTU |
TT |
0.3 |
0.127 |
0.116 |
0.109 |
(2.39 - 10.8) |
0.149 |
0.099 |
|
|
|
|
|
|
|
|
|
|
|
|
ppb |
|
5 |
ND |
ND |
ND |
0.053 |
ND |
ND |
|
|
|
|
|
|
|
|
|
|
|
|
|
Ethylbenzene |
ppb |
|
700 |
ND |
ND |
ND |
ND |
(ND - 2.7) 1.63 |
ND |
|
|
|
|
|
|
|
|
|
|
|
|
Styrene |
ppb |
|
100 |
ND |
ND |
ND |
ND |
(ND - 0.5) 1.67 |
ND |
|
|
|
|
|
|
|
|
|
|
|
|
Total Xylene |
ppb |
|
10,000 |
ND |
ND |
ND |
ND |
(ND - 21.9) |
ND |
|
|
13.18 |
||||||||
|
|
|
|
|
|
|
|
|
|
|
|
Radioactive Contaminants |
|
|
|
|
|
|
|
|
|
|
|
|
|
|
|
|
|
|
|
|
|
Gross Alpha |
pCi/L |
0 |
15 |
1.8 |
1.1 |
0.7 |
0.6 |
< 0.27 |
0.36 |
|
Gross Beta |
pCi/L |
0 |
50 |
5.1 |
2.1 |
< 0.61 |
1.7 |
1.2 |
5.7 |
|
|
|
|
|
|
|
|
|
|
|
|
Radium 228 |
|
|
|
1.9 |
0.62 |
< 0.4 |
1.3 |
< 0.6 |
1.4 |
|
|
|
|
|
|
|
|
|
|
|
|
Combined Radium |
pCi/L |
0 |
5 |
3.7 |
1.72 |
0.7 |
1.9 |
< 0.6 |
1.76 |
|
Lead and Copper Testing |
|
|
|
|
|
|
|
|
|
|
|
|
|
|
|
|
|
|
|
|
|
Lead |
ppb |
0 ppb |
AL = 15 |
<1.0 |
|
|
|
<1.0 |
1.3 |
|
|
|
|
|
|
|
See page 20 |
|
|
|
|
Copper |
ppm |
1.3 ppm |
AL = 1.3 |
0.002 |
|
|
0.0051 |
0.021 |
|
|
|
|
|
|||||||
|
|
|
|
|
|
|
|
|
|
|
|
Disinfectants and Disinfection |
|
|
|
|
|
|
|
|
|
|
|
|
|
|
|
|
|
|
|
|
|
Chlorine |
ppm |
|
4 |
(1.0 - 1.2) 1.1 |
(0.9 - 1.3) 1.2 |
(0.8 - 1.0) 0.9 |
(0.9 - 1.15) 1.1 |
(0.9 - 1.2) |
|
|
|
1.1 |
||||||||
|
|
|
|
|
|
|
|
|
|
|
|
HAA5 |
ppb |
0 |
60 |
ND |
ND |
ND |
ND |
ND |
ND |
|
|
|
|
|
|
|
|
|
|
|
|
TTHM |
ppb |
0 |
80 |
7.0 |
2.1 |
1.6 |
6.7 |
4.2 |
8.0 |
|
|
|
|
|
|
|
|
|
|
|
|
Microbiological Substances |
|
|
|
|
|
|
|
|
|
|
|
|
|
|
|
|
|
|
|
|
|
|
|
|
Presence of coliform |
|
|
|
|
|
|
|
Total Coliforms |
P/A |
0 |
bacteria in >5% of |
0 |
0 |
0 |
0 |
0 |
0 |
|
|
|
|
monthly samples |
|
|
|
|
|
|
|
|
|
|
A routine and a |
|
|
|
|
|
|
|
|
|
|
repeat sample |
|
|
|
|
|
|
|
E. coli |
P/A |
0 |
are total coliform |
0 |
0 |
0 |
0 |
0 |
0 |
|
positive, and one is |
|||||||||
|
|
|
|
|
|
|
|
|
|
|
|
|
|
|
also fecal coliform or |
|
|
|
|
|
|
|
|
|
|
E. coli positive. |
|
|
|
|
|
|
|
Unregulated and Secondary Substances |
|
|
|
|
|
|
|
|
|
|
|
|
|
|
|
|
|
|
|
|
|
Alkalinity |
ppm |
unregulated |
|
459 |
180 |
140 |
144 |
336 |
320 |
|
|
|
|
|
|
|
|
|
|
|
|
Conductivity |
μmhos/cm |
unregulated |
|
1120 |
366 |
334 |
488 |
772 |
703 |
|
|
|
|
|
|
|
|
|
|
|
|
Hardness (Total) |
ppm |
unregulated |
|
464 |
191 |
126 |
228 |
380 |
400 |
|
|
|
|
|
|
|
|
|
|
|
|
Iron |
ppm |
|
0.3 |
ND |
0.035 |
(ND - 0.065) |
(0.9 - 1.1) 1.0 |
ND |
ND |
|
|
0.01 |
||||||||
|
|
|
|
|
|
|
|
|
|
|
|
Manganese |
ppm |
|
0.05 |
ND |
0.003 |
0.002 |
(0.356 - 0.368) |
0.0003 |
ND |
|
|
|
|
|
|
|
|
|
|
|
|
Orthophosphate as P |
ppm |
unregulated |
|
ND |
ND |
ND |
(1.3 - 1.6) 1.4 |
0.14 |
ND |
|
pH |
pH units |
|
6.5 - 8.5 |
7.01 |
7.57 |
7.7 |
6.75 |
7.13 |
7.39 |
|
Sodium |
ppm |
unregulated |
|
66.7 |
8.8 |
23.1 |
17.7 |
11.8 |
5.7 |
|
Zinc |
ppm |
|
5 |
0.008 |
0.02 |
0.002 |
0.008 |
0.02 |
0.04 |
|
|
|
|
|
|
|
|
|
|
|
Botetourt County Systems
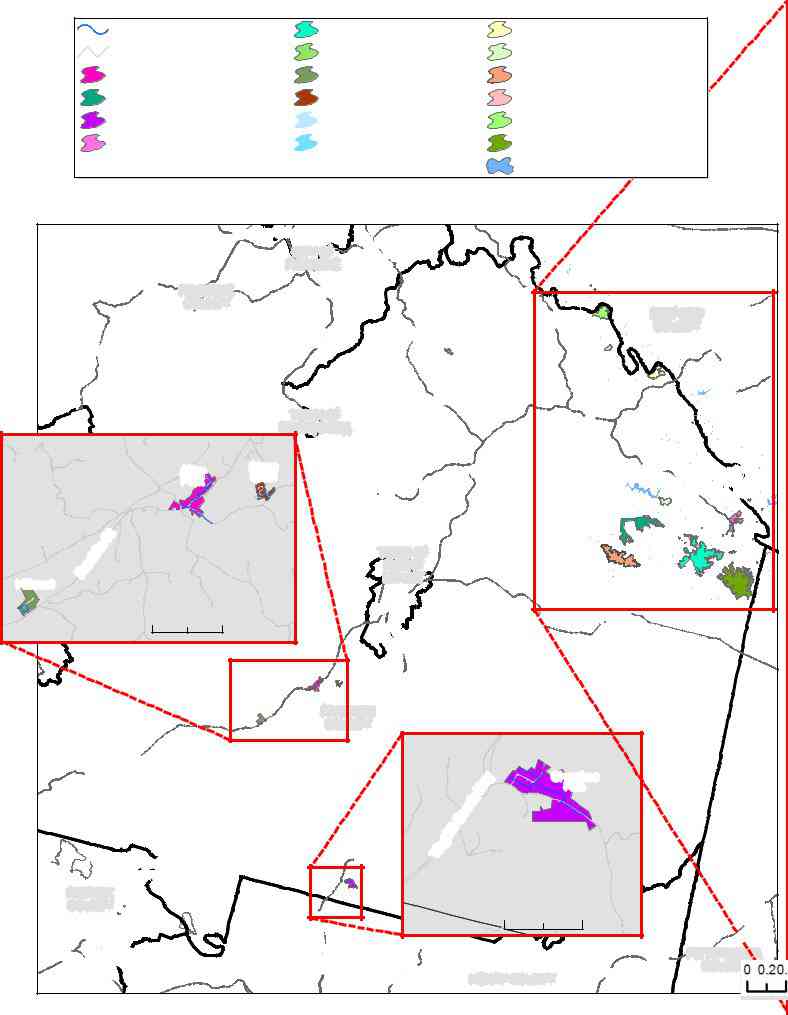
Water Main |
Dillards Hill Water System |
StarOverLake |
Streets |
Frederick Acres |
Striper's Landing |
Alton Park Water System |
Hillcrest Water System |
The Retreat Water System |
Burnt Chimney Rd Water System |
Ridgecrest Water System |
Timberlake Crossing Water System |
Cherokee Hills Water System |
Westlake Area Water System |
Walnut Run Water System |
Compass Cove Water System |
Spring Hollow |
Water's Edge Water System |
|
|
Smith Mountain Lake |
ng |
|
|
|
|
|
|
|
|
|
|
|
|
|
|
|
|
|
|
|
Electric Rd |
Va |
|
|
|
|
|
|
|
|
|
|
|
|
|
|
|
|
|
|
|
|
|
|
|
|
|
|
|
|
|
|
|
|
|
|
|
||
|
|
|
|
|
|
|
|
|
|
|
|
|
|
|
|
|
|
|
|
|
|
|
|
|
|
|
|
|
|
|
|
|
|
|
|
|
|
|
|
|
|
|
|
|
|
|
|
|
|
|
|
|
|
|
|
|||
|
|
|
|
|
|
|
|
|
|
|
|
|
|
|
|
|
|
|
|
|
|
|
Ja |
|
|
|
|
|
|
|
|
|
|
|
|
|
|
|
|
|
|
|
|
|
|
|
|
|
|
|
|
|
|
|||||
ow |
|
|
|
|
|
|
|
|
|
|
|
|
|
|
|
|
|
|
|
|
|
l |
|
|
|
|
|
|
|
|
|
|
|
|
|
|
|
|
|
|
|
|
|
|
|
|
|
|
|
|
|
|
|
|
|
|
||
|
|
|
|
|
|
|
|
|
|
|
|
|
|
|
|
|
|
|
|
CITY OF |
|
e |
|
|
|
|
|
|
|
|
|
|
|
|
|
|
|
|
|
|
|
|
|
|
|
|
|
|
|
|
|
|
||||||
|
|
|
|
|
|
|
|
|
|
|
|
|
|
|
|
|
|
|
|
|
ey |
|
|
|
|
|
|
|
|
|
|
|
|
|
|
|
|
|
|
|
|
|
|
|
|
|
|
|
|
|
|
|
|
|||||
|
|
|
|
|
|
|
|
|
|
|
|
|
|
|
|
|
|
|
|
|
ROANOKE |
|
Rd |
|
|
|
|
|
|
|
|
|
|
|
|
|
|
|
|
|
|
|
|
|
|
|
|
|
|
|
|
|
|
|||||
|
|
|
|
|
|
|
|
|
|
|
|
|
|
|
|
|
d |
ROANOKE |
|
d |
|
|
|
|
|
|
|
|
|
|
|
|
|
|
|
|
|
|
|
H |
|
|
|
|
|
|
|
|
|
|
|
|
|
|
|
|||
|
|
|
|
|
|
|
|
|
|
|
|
|
|
|
|
|
|
|
|
|
|
|
|
|
|
|
|
|
|
|
|
|
|
|
|
|
|
a |
|
|
|
|
|
|
|
|
|
|
|
|
|
|
||||||
|
|
|
|
|
|
|
|
|
|
|
|
|
|
|
|
R |
COUNTY |
|
R |
|
|
|
|
|
|
|
|
|
|
|
|
|
|
|
|
|
|
|
|
rdy |
|
|
|
|
|
|
|
|
|
|
|
|
|
|
||||
|
|
|
|
|
|
|
|
|
|
|
|
|
|
in |
|
|
n |
|
|
|
|
|
|
|
|
|
|
|
|
|
|
|
|
|
|
|
|
|
|
|
|
|
|
|
|
|
|
|
|
|
|
|||||||
|
|
|
|
|
|
|
|
|
|
|
|
|
ta |
|
y |
|
|
|
i |
|
|
|
|
|
|
|
|
|
|
|
|
|
|
|
|
|
|
|
|
|
|
|
|
|
|
|
BEDFORD |
|
|
|
Rd |
|||||||
|
|
|
|
|
|
|
|
|
|
|
|
|
|
|
|
|
l |
|
|
|
|
|
|
|
|
|
|
|
|
|
|
|
|
|
|
|
|
|
|
|
|
|
|
|
|
|
|
|||||||||||
|
|
|
|
|
|
|
|
|
|
|
n |
|
|
|
|
|
nk |
|
|
|
|
|
|
J |
|
|
|
|
|
|
|
|
|
|
|
|
|
Rd |
|
|
|
|
COUNTY |
|
|
|
|
|||||||||||
|
|
|
|
|
|
|
|
|
|
ou |
|
|
|
k |
|
|
|
|
|
|
|
|
|
|
|
|
|
|
|
|
|
|
|
|
|
|
|
|
|
|
|
|
|
|
|
|
|
ta |
|
|||||||||
|
|
|
|
|
|
|
|
|
M |
|
|
|
|
|
P |
|
|
|
a |
|
|
|
|
|
|
ubFrederick |
|
|
|
|
|
|
|
|
|
|
|
|
|
|
|
|
|
e |
|
|
||||||||||||
|
|
|
|
|
|
|
|
|
|
|
|
|
|
|
|
|
|
|
|
|
|
|
|
|
|
|
|
|
|
|
|
|
|
|
|
|
|
|
|
|
|
|
||||||||||||||||
|
|
|
|
|
|
|
|
t |
|
|
|
|
|
e |
|
|
|
|
Fr |
|
|
|
|
|
|
a |
|
|
|
|
|
|
|
|
|
|
|
|
|
|
|
|
|
|
|
|
|
|
|
on |
|
|
|
|||||
|
|
|
|
|
en |
|
|
|
|
g |
|
|
|
|
|
|
|
|
|
|
|
|
l |
Acres |
|
|
|
|
|
|
|
|
|
|
|
|
|
|
|
|
M |
|
|
|
|
|||||||||||||
|
|
|
|
|
|
|
|
id |
|
|
|
|
|
|
|
|
|
|
|
|
|
|
|
|
|
|
|
|
|
|
|
|
|
|
|
|
|
|
|
|
|
|
|
|||||||||||||||
|
|
|
|
B |
|
|
|
R |
|
|
|
|
|
|
|
|
|
|
|
|
|
|
Ea |
|
|
|
|
|
|
|
|
|
|
|
|
|
|
|
|
|
|
|
|
|
|
|
|
|
|
|
|
|||||||
|
|
|
|
|
|
|
|
|
|
e |
|
|
|
|
|
|
|
|
|
|
|
|
|
|
|
r |
|
|
|
|
|
|
|
|
|
|
|
|
|
|
|
|
|
|
|
|
|
|
|
|
|
|
|
|
||||
|
|
|
|
|
|
|
|
|
|
|
|
|
|
|
|
|
|
|
|
|
|
|
|
|
|
|
|
|
|
|
|
|
|
|
|
|
|
|
|
|
|
|
|
|
|
|
|
|
|
|
|
|
|
|
|
|||
|
|
|
|
|
|
|
|
|
lu |
|
|
|
|
|
|
|
|
|
|
|
|
|
|
|
|
|
ly |
|
|
|
|
|
|
|
|
|
|
|
|
|
|
|
|
|
|
|
|
|
|
|
Hend |
|||||||
|
|
|
|
|
|
|
|
B |
|
|
|
|
|
|
|
|
|
|
|
|
|
|
|
|
|
|
|
|
|
|
|
|
|
|
|
|
|
|
|
|
|
|
|
|
|
|
|
|
|
|
|
|
|
|||||
|
|
|
|
|
|
|
|
|
|
|
|
|
|
|
|
|
|
|
|
|
|
|
|
|
|
|
|
Hw |
|
|
|
|
|
|
|
|
|
|
|
|
|
|
|
|
|
|
|
|
|
|
Store |
|
||||||
|
|
|
|
|
|
|
|
|
|
|
|
|
|
|
|
|
|
|
|
|
|
|
|
|
|
|
|
|
|
y |
|
|
|
|
|
|
|
|
|
|
|
|
|
|
|
|
|
|
|
|
|
|
|
|
rick |
|||
|
|
|
|
|
|
|
|
|
|
|
|
|
|
|
|
|
|
|
|
|
|
|
|
|
|
|
|
|
|
|
|
|
|
|
|
|
|
|
|
|
|
|
|
|
|
|
|
|
|
|
|
|
|
|
|
|||
|
|
|
|
|
|
|
|
|
|
|
|
|
|
|
|
|
|
|
|
|
|
|
|
|
|
|
|
|
|
|
|
|
|
|
|
|
|
|
|
|
|
|
|
|
|
|
|
|
|
|
|
|
|
Rd |
|
|||
|
|
|
|
|
|
|
|
|
|
|
|
|
|
|
|
|
|
|
|
|
|
|
|
|
|
|
|
|
|
|
|
|
|
|
|
|
|
|
|
|
|
|
|
|
|
|
|
|
|
|
|
|
|
|
|
s |
||
|
|
F |
|
|
|
|
|
|
|
|
|
|
|
|
|
TOWN OF |
|
|
|
|
|
|
|
|
|
|
|
|
|
|
|
|
|
|
|
|
|
|
|
|
y |
|
|
|
|
|
|
|
|
|
|
|
|
|||||
|
|
|
|
|
|
|
|
|
|
|
|
|
|
|
|
|
|
|
|
|
|
|
|
|
|
|
|
|
|
|
|
|
|
|
|
|
|
|
|
|
|
|
|
|
|
|
|
|
|
|
|
|
|
|
|
|
||
|
|
loyd |
|
|
|
|
|
|
|
|
|
|
|
|
BOONES MILL |
|
|
|
|
|
|
|
|
|
|
|
|
|
|
|
|
|
|
|
|
|
|
|
Hw |
|
|
|
|
|
|
|
|
|
|
|
|
|||||||
|
|
|
|
|
|
|
|
|
|
|
|
|
|
|
|
|
|
|
|
|
|
|
|
|
|
|
|
|
|
|
|
|
|
|
|
on |
|
|
|
|
|
|
|
|
|
|
|
|
|
|||||||||
|
|
|
|
|
|
|
|
|
|
|
|
|
|
|
|
|
|
|
|
|
|
|
|
|
|
|
|
|
|
|
|
|
|
|
|
|
t |
|
|
|
|
|
|
|
|
|
|
|
|
|
|
|||||||
|
|
|
|
|
|
|
|
|
|
|
|
|
|
|
|
|
|
|
|
|
|
|
|
|
|
|
|
|
|
|
|
|
|
|
|
|
|
|
|
|
|
|
g |
|
|
|
|
|
|
|
|
|
|
|
|
|
|
|
|
|
|
|
|
|
|
|
|
|
|
|
|
|
|
|
|
|
|
|
|
|
|
|
|
|
|
|
|
|
|
|
|
|
|
|
|
|
|
|
|
|
|
in |
|
|
|
|
|
|
|
|
|
|
|
|
|
|
|
|
|
|
H |
|
|
|
|
|
|
|
|
|
|
|
|
|
|
|
|
|
|
|
|
|
|
|
|
|
|
|
|
|
|
|
|
sh |
|
|
|
|
|
|
|
|
|
|
|
|
|
|
|
|||||||
|
|
|
|
|
|
|
|
|
|
|
|
|
|
|
|
|
|
|
|
|
|
|
|
|
|
|
|
|
|
|
|
|
|
|
|
|
|
|
|
|
a |
|
|
|
|
|
|
|
|
|
|
|
|
|
|
|
|
|
|
|
|
|
|
|
|
|
|
|
|
|
|
|
|
|
|
|
|
|
|
|
|
|
|
|
|
|
|
|
|
|
|
|
|
|
|
|
|
|
W |
|
|
|
|
|
|
|
|
|
|
|
|
|
|
|
|
|
|
|
|
|
wy |
|
|
|
|
|
|
|
|
|
|
|
|
|
|
|
|
|
|
|
|
|
|
|
|
|
|
|
|
|
T |
|
|
|
|
|
|
|
|
|
|
|
|
|
|
|
|
|
|
|||||||
|
|
|
|
|
|
|
|
|
|
|
|
|
|
|
|
|
|
|
|
|
|
|
|
|
|
|
|
|
|
|
r |
|
|
|
|
|
|
|
|
|
|
|
|
|
|
|
|
|
|
|
||||||||
|
|
|
|
|
|
|
|
|
|
|
|
|
|
|
|
|
|
|
|
|
|
|
|
|
|
|
|
|
|
|
|
|
|
|
|
e |
|
|
|
|
|
|
|
|
|
|
|
|
|
|
|
|
|
|
|
|
||
|
|
|
|
|
|
|
|
|
|
|
|
|
|
|
|
|
|
|
|
|
|
|
|
|
|
|
|
|
|
|
|
|
|
|
k |
|
|
|
|
|
|
|
|
|
|
|
|
|
|
|
|
|
|
|
|
|
||
|
|
|
|
|
|
|
|
|
|
|
|
|
|
|
|
|
|
|
|
Ridge |
|
|
|
|
|
|
|
|
|
|
|
|
o |
|
|
|
|
|
|
|
|
|
|
|
|
S |
|
|
|
|
|
|
|
|
|
|||
|
|
|
|
|
|
|
|
|
|
|
|
|
|
|
|
|
|
Alton |
|
|
|
|
|
|
|
|
|
|
|
|
o |
|
|
|
|
|
|
|
|
|
|
|
|
|
|
|
|
|
|
|
|
Smith |
||||||
|
|
|
|
|
|
|
|
|
|
|
|
|
|
|
|
|
|
|
Crest |
|
|
|
|
|
|
|
|
|
|
B |
|
|
|
|
|
|
|
|
|
|
|
|
|
|
cr |
|
|
|
|
|
|
|||||||
|
|
|
|
|
|
|
|
|
|
|
|
|
|
|
|
|
|
Park |
|
|
|
|
|
|
|
Rd |
|
|
|
|
|
|
|
|
|
|
|
|
|
|
|
|
|
|
|
|
|
ug |
|
|
|
|
Mountain |
|||||
|
|
|
|
|
|
|
|
|
|
|
|
|
|
|
|
|
|
|
|
|
|
|
|
|
|
|
|
|
|
|
|
|
|
|
|
|
|
|
|
|
|
|
|
|
|
|
|
|
gs |
|
|
|
||||||
|
|
|
|
|
|
|
|
|
|
|
|
|
|
|
|
|
|
|
|
|
|
|
|
|
|
z |
|
|
|
|
|
|
|
|
|
|
|
|
|
|
|
|
|
|
|
|
|
|
|
Rd |
|
|
|
|
|
|
||
|
|
|
|
|
|
|
|
|
|
|
|
|
|
|
|
|
|
|
|
|
|
|
irt |
|
|
|
|
|
|
|
|
|
|
|
|
|
|
|
|
|
|
|
|
|
|
|
|
|
|
|
|
Lake |
||||||
|
|
|
|
|
|
|
|
|
|
|
|
|
|
|
|
|
|
|
|
|
|
W |
|
|
|
|
|
|
|
|
|
|
|
|
|
|
|
|
|
|
|
|
|
|
|
|
|
|
|
|
|
|
|
|||||
FLOYD |
|
|
|
|
t |
|
|
|
|
|
|
|
|
|
|
|
|
|
|
|
|
|
|
|
|
|
|
|
|
|
|
|
|
|
|
|
|
|
|
|
|
|
|
|
|
|
|
|
|
|
|
|
|
|
||||
COUNTY |
|
|
|
|
|
|
|
|
|
|
|
|
|
|
|
|
|
|
|
|
|
|
|
|
|
|
|
|
|
|
|
|
|
|
|
|
|
|
|
|
|
|
|
|
|
|
|
|
|
|
|
|
||||||
|
|
|
|
|
|
|
S |
|
|
|
|
|
|
|
|
|
|
|
|
|
|
|
|
|
|
|
|
|
|
|
|
|
|
|
|
|
|
|
|
|
|
|
|
|
|
|
|
|
|
|
|
|
|
|
|
|
|
|
|
|
|
|
|
n |
|
|
|
|
|
|
|
|
|
|
|
|
|
|
|
TOWN OF |
|
|
|
|
|
|
|
|
|
|
|
|
|
|
|
|
|
|
|
|
|
|
|
|
|
|
|
|
|
|
|||||||
|
|
|
|
li |
|
|
|
|
|
|
|
|
|
|
|
|
|
|
|
|
|
|
|
|
|
|
|
|
|
|
|
|
|
|
|
|
|
|
|
|
|
|
|
|
|
|
|
|
|
|
||||||||
|
|
|
|
k |
|
|
|
|
|
|
|
|
|
|
|
|
|
|
|
|
|
|
|
ROCKY |
|
|
|
|
|
|
|
|
|
|
|
|
|
|
|
|
|
|
|
|
|
|
|
|
|
|
|
|
|
|
||||
|
|
an |
|
|
|
|
|
|
|
|
|
|
|
|
|
|
|
|
|
|
|
|
|
|
|
|
|
|
|
|
|
|
|
|
|
|
|
|
|
|
|
|
|
|
|
|
|
|
|
|
|
|||||||
|
|
|
|
|
|
|
|
|
|
|
|
|
|
|
|
|
|
|
|
|
|
|
|
|
|
|
|
|
|
|
|
|
|
|
|
|
|
|
|
|
|
|
|
|
|
|
|
|
|
|
|
|
|
|
|
|||
|
|
r |
|
|
|
|
|
|
|
|
|
|
|
|
|
|
|
|
|
|
|
MOUNT |
|
|
|
|
|
|
|
|
|
|
|
|
|
|
|
|
|
|
|
|
|
|
|
|
|
|
|
|
|
|
||||||
Hillcrest |
F |
|
|
|
|
|
|
|
|
|
|
|
|
|
|
|
|
|
|
|
|
|
|
|
|
|
|
|
|
|
|
|
|
|
|
|
|
|
|
|
|
|
|
|
|
|
|
|
|
|
|
|||||||
|
|
|
|
|
|
|
|
|
|
|
|
|
|
|
|
|
|
|
|
|
|
|
|
|
e |
|
|
|
|
|
|
|
|
|
|
|
|
|
|
|
|
|
|
|
|
|
|
|
|
|
|
|
|
|
|
|||
|
|
|
|
|
|
|
|
|
|
|
|
|
|
|
|
|
|
|
|
|
|
|
|
|
|
|
|
|
|
|
|
|
|
|
|
|
|
|
|
|
|
|
|
|
|
|
|
|
|
|
|
|
|
|
|
|||
|
|
|
|
|
|
|
|
|
|
|
|
|
|
|
|
|
|
|
|
|
|
|
Av |
|
|
|
|
|
|
|
|
|
|
|
|
|
|
|
|
|
|
|
|
|
|
|
|
|
|
|
|
|
|
|||||
|
|
|
|
|
|
|
|
|
|
|
|
|
|
|
|
|
|
|
|
|
|
|
l |
|
|
|
|
|
|
|
|
|
|
|
|
|
|
|
|
|
|
|
|
|
|
|
|
|
|
|
|
|
|
|
|
|
|
|
|
|
|
|
|
|
|
|
|
|
|
|
|
|
|
|
|
0 |
0.5 |
1 Miles |
´ |
Pe |
|
|
|
|
|
|
|
|
|
|
|
|
|
|
|
|
|
|
|
Old Franklin Tpke |
|
|
|
|
|
|
|
|
|
|
|||||||
|
|
|
|
|
|
|
|
|
|
|
|
|
|
|
|
|
|
|
S |
|
|
|
|
|
|
|
|
|
|
|
|
|
|
|
|
|
|
|
|
|
|
|
|
|||||||||||||||
|
|
|
|
|
|
|
|
|
|
|
|
|
|
|
|
|
|
|
|
|
M |
|
|
|
|
|
|
|
|
|
|
|
|
|
|
|
|
|
|
|
|
|
|
|
|
|
|
|
|
|
|
|
||||||
|
|
|
|
|
|
|
|
|
|
|
|
|
|
|
|
|
|
|
|
|
|
|
|
o |
|
|
|
|
|
|
|
|
|
|
|
|
|
|
|
|
|
|
|
|
|
|
|
|
|
|
|
|
|
|
||||
|
|
|
|
|
|
|
|
|
|
|
|
|
|
|
|
|
|
|
|
|
|
|
|
u |
|
|
|
|
|
|
|
|
|
|
|
|
|
|
|
|
|
|
|
|
|
|
|
|
|
|
|
|
|
|
||||
|
|
|
|
|
|
|
|
|
|
|
|
|
|
|
|
|
|
|
|
|
|
|
ai |
|
|
|
|
|
|
|
|
|
|
|
|
|
|
|
|
|
|
|
|
|
|
|
|
|
|
|
|
|
|
|||||
|
|
|
|
|
|
|
|
|
|
|
|
|
|
|
|
|
|
|
|
|
|
|
nt |
|
|
|
|
|
|
|
|
|
|
|
|
|
|
|
|
|
|
|
|
|
|
|
|
|
|
|
|
|
|
|||||
|
|
|
|
|
|
|
|
|
|
|
|
|
|
|
|
|
|
|
|
|
|
|
|
|
|
|
h |
|
|
|
|
|
|
|
|
|
|
|
|
|
|
|
|
|
|
|
|
|
|
|
|
|
|
|
|
|
|
|
|
|
|
|
|
|
|
|
|
|
|
|
|
|
|
|
|
|
|
|
|
|
|
|
St |
|
|
|
|
|
|
|
|
|
|
|
|
|
|
|
|
|
|
|
|
|
|
|
|
|
|
|
|
|
|
||||
|
|
|
|
|
|
|
|
|
|
|
|
|
|
|
|
|
|
|
|
|
|
|
|
|
|
|
|
V |
|
|
|
|
|
|
|
|
|
|
|
|
|
|
|
|
|
|
|
|
|
|
|
|
|
|
|
|
|
|
|
|
|
|
|
|
|
|
|
|
|
|
|
|
|
|
|
|
|
|
|
FRANKLIN |
|
|
|
|
|
i |
|
|
|
|
|
|
|
|
|
|
|
|
|
|
|
|
|
|
|
|
|
|
|
|
|
|
|
|
|
|
|
|
|
|
|
|
|
|
|
|
|
|
|
|
|
|
|
|
|
|
|
|
|
|
|
|
|
r |
|
|
|
|
|
|
|
|
|
|
|
|
|
|
|
|
|
|
|
|
|
|
|
|
|
|
|
|
|
|
||
|
|
|
|
|
|
|
|
|
|
|
|
|
|
|
|
|
|
|
|
|
|
|
|
|
|
|
|
g |
|
|
|
|
|
|
|
|
|
|
|
|
|
|
|
|
|
|
|
|
|
|
|
|
|
|
|
|
|
|
|
|
|
|
|
|
|
|
|
|
|
|
|
|
|
|
|
|
|
|
|
COUNTY |
|
|
|
|
|
i |
|
|
|
|
|
|
|
|
|
|
|
|
|
|
|
|
|
|
|
|
|
|
|
|
|
|
|
|
|
|
|
|
|
|
|
|
|
|
|
|
|
|
|
|
|
|
|
|
|
|
|
|
|
|
|
|
|
l |
|
|
|
|
|
|
|
|
|
|
|
|
|
|
|
|
|
|
|
|
|
|
|
|
|
|
|
|
|
|
||
|
|
|
|
|
|
|
|
|
|
|
|
|
|
|
|
|
|
|
|
|
|
|
|
|
|
|
|
H |
|
|
|
|
|
|
|
|
|
|
|
|
|
|
|
|
|
|
|
|
|
|
|
|
|
|
|
|
|
|
|
|
|
|
|
|
|
|
|
|
|
|
|
|
|
|
|
|
|
|
|
|
|
|
|
|
|
|
G |
|
|
|
|
|
|
|
|
|
|
|
|
|
|
|
|
|
|
|
|
|
|
|
|
|
|
|
|
|
|
|
|
|
|
|
|
|
|
|
|
|
|
|
|
t |
|
|
|
|
|
|
|
|
|
|
|
o |
|
|
|
|
|
|
|
|
|
|
|
|
|
|
|
|
|
|
|
|
|
|
|
|
|
|
|
|
|
|
||
|
|
|
|
|
|
|
|
|
|
|
|
|
|
|
|
|
|
|
|
|
|
|
|
|
o |
|
|
|
|
|
|
|
|
|
|
|
|
|
|
|
|
|
|
|
|
|
|
|
|
|
|
|
|
|
|
|||
|
|
|
|
|
|
|
|
|
|
|
|
|
S |
|
|
|
|
|
|
|
|
|
|
|
|
|
|
|
|
|
|
|
|
|
|
|
|
|
|
|
|
|
|
|
|
|
|
|
|
|
|
|
|
|
|
|||
|
|
|
|
|
|
|
|
|
|
n |
|
|
|
|
|
|
|
|
|
|
|
|
|
|
|
|
|
|
|
|
|
|
|
|
|
|
|
|
|
|
|
|
|
|
|
|
|
|
|
|
|
|
|
|
|
|||
|
|
|
|
|
|
|
|
|
li |
|
|
|
|
|
|
|
|
|
|
|
|
|
|
|
|
|
|
|
|
|
|
|
|
|
|
|
|
|
|
|
|
|
|
|
|
|
|
|
|
|
|
|
|
|
|
|||
|
|
|
|
|
|
|
|
k |
|
|
|
|
|
|
|
|
|
|
|
|
|
|
|
|
|
d |
|
|
|
|
|
|
|
|
|
|
|
|
|
|
|
|
|
|
|
|
|
|
|
|
|
|
|
|
|
|
||
|
|
|
|
|
|
|
n |
|
|
|
|
|
|
|
|
|
|
|
|
|
|
|
|
|
|
|
|
|
|
|
wy |
|
|
|
|
|
|
|
|
|
|
|
|
|
|
|
|
|
|
|
|
|
|
|
||||
|
|
|
|
|
a |
|
|
|
|
|
|
|
|
|
|
|
|
|
|
|
|
|
|
|
|
|
|
|
|
|
|
|
|
|
|
|
|
|
|
|
|
|
|
|
|
|
|
|
|
|
|
|
|
|||||
|
|
|
|
r |
|
|
|
|
|
|
|
|
|
|
|
|
|
|
|
|
|
|
|
|
e |
|
|
|
|
|
|
|
|
|
|
|
|
|
|
|
|
|
|
|
|
|
|
|
|
|
|
|
|
|||||
|
|
|
F |
|
|
|
|
|
|
|
|
|
|
|
|
|
|
|
|
|
|
|
|
|
|
|
|
|
|
H |
|
|
|
|
|
|
|
|
Cherokee |
|
|
|
|
|
|
|
|
|
|
|
|
|||||||
|
|
|
|
|
|
|
|
|
|
|
|
|
|
|
|
|
|
|
|
|
|
|
|
|
|
|
|
H |
|
|
|
|
|
|
|
|
|
|
|
|
|
|
|
|
|
|
|
|
|
|
|
|
||||||
|
|
|
|
|
|
|
|
|
|
|
|
|
|
|
|
|
|
|
|
|
|
|
|
|
|
|
|
w |
|
|
|
e |
|
|
|
|
|
|
|
|
|
Hills |
|
|
|
|
|
|
|
|
|
|
|
|
||||
|
|
|
|
|
|
|
|
|
|
|
|
|
|
|
|
|
|
|
|
|
|
|
|
|
|
|
|
y |
|
|
|
|
|
|
|
|
|
|
|
|
|
|
|
|
|
|
|
|
|
|
|
|
|
|
|
|
||
|
|
|
|
|
|
|
|
|
|
|
|
|
|
|
|
|
|
|
|
|
|
|
|
|
|
|
|
|
|
|
|
|
|
|
|
|
|
|
|
|
|
|
|
|
|
|
|
|
|
|
|
|
|
|
|
|
|
|
|
|
|
|
|
|
|
|
|
|
|
|
|
|
|
|
|
|
|
|
|
|
|
|
|
|
|
|
|
|
|
o |
d |
|
|
|
|
|
|
|
|
|
|
|
|
|
|
|
|
|
|
|
|
|
|
|
|
|
|
|
|
|
|
|
|
|
|
|
|
|
|
|
|
|
|
|
|
|
|
|
|
|
|
|
|
|
|
|
|
gilH |
Go |
|
|
|
|
|
|
|
|
|
|
|
|
|
|
|
|
|
|
|
|
|
|
|
|
|
|
|
|
|
|
|
|
|
|
|
|
|
|
|
|
|
|
|
|
|
|
|
|
|
|
|
|
|
|
|
|
|
|
|
|
|
|
|
|
|
|
|
|
|
|
|
|
|
|
|
|
|
|
|
|
|
|
|
|
|
|
|
|
|
|
|
|
|
|
|
|
|
|
|
|
|
|
|
|
|
|
|
|
|
|
|
|
|
|
|
r |
|
|
|
|
|
|
|
|
|
|
|
|
|
|
|
|
|
|
|
|
|
|
|
|
|
|
|
|
|
|
|
|
|
|
|
|
|
|
|
|
|
|
|
|
|
|
|
|
|
|
|
|
|
|
|
|
|
i |
|
|
|
|
|
|
|
|
|
|
|
|
|
|
|
|
|
|
|
|
|
|
|
|
|
|
|
|
|
|
|
|
|
|
|
|
|
|
|
|
|
|
|
|
|
Philpott |
|
|
|
|
|
|
|
|
|
|
V |
|
|
|
|
|
|
|
|
|
|
|
|
|
|
|
|
|
|
|
|
|
|
|
|
|
|
|
|
|
|
||
|
|
|
|
|
|
|
|
|
|
|
|
|
|
|
|
|
|
|
|
|
|
|
|
|
|
|
|
|
|
|
|
|
|
|
|
|
|
|
|
|
|
|
|
|
|
|
|
|
|
|
|
|
|
|
|
|||
|
|
|
|
|
|
|
|
|
|
|
|
|
|
Reservoir |
|
|
|
|
|
|
|
|
|
|
|
|
|
|
|
|
|
|
|
|
|
|
|
|
|
|
|
|
|
|
|
|
|
|
|
|
|
|
|
|
|
|||
|
PATRICK |
|
|
|
|
|
|
|
|
|
|
|
|
|
|
|
|
|
|
|
|
|
|
|
|
|
|
|
|
|
|
|
|
|
|
|
|
|
|
|
|
|
|
|
|
|
|
|
s |
|||||||||
|
COUNTY |
|
|
|
|
|
|
|
|
|
|
|
|
|
|
|
|
|
|
|
|
|
|
|
|
|
|
|
|
|
|
|
|
|
|
|
|
|
|
|
|
|
|
|
|
|
|
|
||||||||||
|
|
|
|
|
|
|
|
|
|
|
|
|
|
|
|
|
|
|
|
|
V |
|
|
|
|
|
|
|
|
|
|
|
|
|
|
|
|
|
0 |
|
|
0.25 |
|
0.5 Miles |
´ |
|
|
|
|
|
|
|
|
an |
||||
|
|
|
|
|
|
|
|
|
|
|
|
|
|
|
|
|
|
|
|
|
i |
|
|
|
|
|
|
|
|
|
|
|
|
|
|
|
|
|
|
|
|
|
|
|
|
|
|
|
|
|
|
|
|
|
|
|||
|
|
|
|
|
|
|
|
|
|
|
|
|
|
|
|
|
|
|
|
|
r |
|
|
|
|
|
|
|
|
|
|
|
|
|
|
|
|
|
|
|
|
|
|
|
|
|
|
|
|
|
|
|
|
|
l |
|||
|
|
|
|
|
|
|
|
|
|
|
|
|
|
|
|
|
|
|
|
|
g |
|
|
|
|
|
|
|
|
|
|
|
|
|
|
|
|
|
|
|
|
|
|
|
|
|
|
|
|
|
|
|
|
|
|
Rd |
||
|
|
|
|
Fair |
|
|
|
|
|
|
|
|
|
|
|
inia |
|
|
|
|
|
|
|
|
|
|
|
|
|
|
|
|
|
|
|
|
|
|
|
|
|
|
|
|
|
|
|
|
|
Ca |
|
|||||||
|
|
|
|
|
|
|
|
y |
|
|
|
|
|
|
|
|
|
|
|
|
|
|
|
|
o |
|
|
|
|
|
|
|
|
|
|
|
|
|
|
|
|
|
|
|
|
|
|
|
|
|
|
|
|
|
|
|||
|
F |
|
|
L |
|
s |
|
|
|
|
|
|
|
|
|
|
|
|
|
|
|
|
|
|
|
|
|
|
|
|
|
|
|
|
|
|
|
|
|
|
|
|
|
|
PITTSYLVANIA |
|||||||||||||
|
|
|
|
|
|
|
|
|
|
|
|
|
|
|
|
|
|
|
|
|
|
|
|
|
|
|
|
|
|
|
|
|
|
|
|
|
|
|
|
|
|
|
|
|
|
|||||||||||||
|
|
|
|
|
aketone |
|
|
|
|
|
|
|
|
|
|
|
|
|
|
|
|
|
|
|
|
|
|
|
|
|
|
|
|
|
|
|
|
d |
|
|||||||||||||||||||
|
Pairyst |
|
D |
|
|
|
|
|
|
|
Av |
|
|
|
|
or |
|
|
|
|
|
|
|
|
|
|
|
|
|
|
|
|
|
|
|
|
|
|
|
|
|
|
|
|
|
|||||||||||||
|
|
|
|
r |
|
|
|
|
|
|
|
|
|
|
|
|
|
|
|
|
|
|
|
|
|
|
|
|
|
|
|
|
|
|
R |
|
|
COUNTY |
||||||||||||||||||||
|
|
|
|
|
|
|
|
|
|
|
|
|
e |
|
|
|
b |
|
|
|
|
|
|
|
|
|
|
|
|
|
|
|
|
|
|
|
tham |
|
|
|
||||||||||||||||||
|
|
|
|
|
|
|
on |
|
|
|
|
|
|
|
|
|
|
|
|
|
|
s |
|
d |
|
|
|
|
|
|
|
|
|
|
|
|
|
|
|
|
|
a |
|
|
|
|
|
|
|
|
|
|
||||||
|
ark |
|
|
|
|
e |
|
|
|
|
|
|
|
|
|
|
|
|
ig |
|
|
|
|
|
|
|
|
|
|
|
|
|
|
|
|
|
|
|
h |
|
|
|
|
|
|
|
|
|
|
|
||||||||
|
|
|
|
|
|
|
|
|
|
|
|
|
|
|
|
|
|
|
|
|
|
|
|
|
|
|
|
|
|
|
|
|
|
|
|
|
|
C |
|
|
|
|
|
|
|
|
|
|
|
|
||||||||
|
|
|
|
Hw |
|
|
|
|
|
|
|
|
|
|
|
|
|
|
|
R |
|
|
|
|
HENRY COUNTY |
|
|
|
|
|
|
|
|
|
|
|
|
|
|
|||||||||||||||||||
22 |
|
|
|
|
|
|
|
y |
|
|
|
|
|
|
|
|
|
|
|
|
|
F |
|
|
|
|
|
|
|
|
|
|
|
|
|
|
|
|
|
|
|
|
|
|
|
|
|
|
|
|
|
|
|
|
|
|
||
|
|
|
|
|
|
|
|
|
|
|
|
|
|
|
|
|
|
|
|
|
|
|
|
|
|
|
|
|
|
|
|
|
|
|
|
|
|
|
|
|
|
|
|
|
|
|
|
|
|
|
|
|
|
|
|
|
|
|
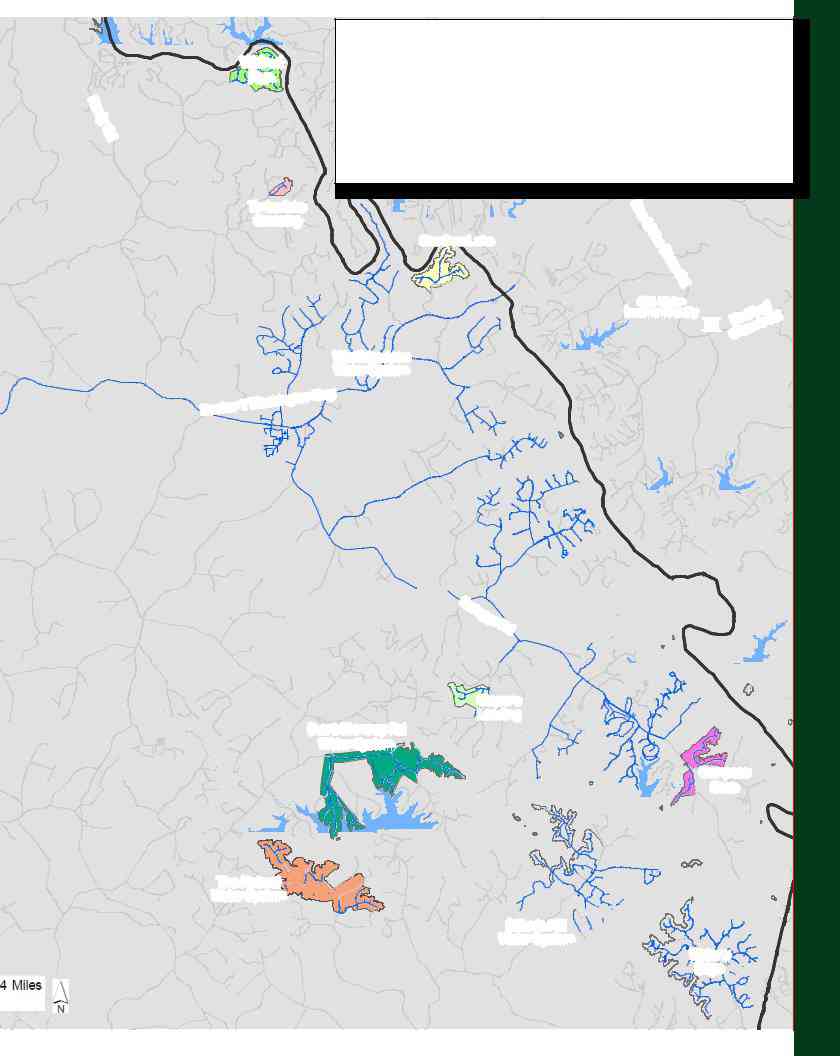
H a r d y
Rd
|
Drinking Water Systems |
0 0.20.4 Miles |
´ |
||
Walnut |
in |
||||
Franklin County |
|
|
a Rd |
|
|
Run |
e |
|
|||
|
|
|
|||
|
|
|
|
||
|
Mon |
tand well water |
|||
|
The Western Virginia Water Authority utilizes surface water |
||||
|
sources to provide customers in the Franklin County service area with drinking |
||||
|
water and fire protection. Information on each of those sources can be found on |
||||
|
the following pages. For information on the water supply serving the U.S. Route |
||||
|
220 area, please see page 15 (Spring Hollow Water Supply) of this publication. |
||||
Timberlake Crossing
StarOverLake
Hendricks
Store
Rd
SML Water
Treatment Facility
Q3
|
|
|
d |
|
|
r |
|
|
fo d |
||
Rad |
R |
||
|
|
ch |
|
|
r |
|
|
u |
|
||
h |
|
|
|
C |
|
|
|
Westlake Area
Water System
|
|
|
|
|
y |
|
|
|
|
onHw |
|
|
|
|
ingt |
|
|
|
|
sh |
|
|
|
|
rTWa |
|
|
|
|
ke |
|
|
|
|
|
Boo |
|
|
|
|
|
ScruggsRd
Burnt Chimney Rd Water System
Striper's |
Landing |
Compass
Cove
The Retreat Water System
Dillards Hill Water System
Water's
Edge
23
Franklin County Systems
Smith Mountain Lake Water
Treatment Facility -
Westlake Area Water System
The Western Virginia Water Authority (WVWA) has a successful working relationship with the Bedford Regional Water Authority (BRWA) to provide treated drinking water from the Smith Mountain Lake Water Treatment Plant to customers in the Westlake Area Water System area. This facility, which opened in May 2017, was designed to meet both utilities’ joint water needs through the year 2060 as recommended by the Regional Long Range Water Supply Plan.
How is it treated? Water from Smith Mountain Lake is screened through 500 micron woven mesh stainless steel strainers to remove fine silt and then pumped to the treatment facility. The membrane plant has 216 modules that each have 10,000 membrane filter strands to provide the unique water treatment capability. The membranes can filter out particles larger than 0.02 microns. Ferric sulfate and permanganate is added as a coagulation. After filtration, the water is treated with sodium hypochlorite, a required disinfectant to eliminate bacteria. The finished water in the distribution system is
Where does it serve? Water from this treatment plant serves customers in Bedford County and Franklin County. As the water flows through pipes under Hales Ford Bridge, it enters the Westlake Area Water System service area. Customers in the Westlake Commercial District, Boardwalk, Chestnut Creek, Deer Creek, Hales Point, Lakewood Forest, Long Island, Twin Cove, Waterfront, Waverly, Weatherwood and Windmere Point communities, along Scruggs Road and along Route 122 to just past Wirtz Road are served by the Westlake Area Public Water System.
The Western Virginia Water Authority and Bedford Regional Water Authority are pleased to report that this water meets all requirements, and there were no drinking water violations in calendar year 2020.
A source water assessment for the Westlake Area systems has been conducted by the Virginia Department of Health. Well(s) serving this community were determined to be of high susceptibility to contamination using the criteria developed by the state in its approved Source Water Assessment Program. The assessment report consists of maps showing the source water assessment area, an inventory of known land use activities of concern and documentation of any known contamination within the last five years. The assessment determined that this source might be susceptible to contamination because they are located in areas that promote migration of contaminants from land use activities of concern. More specific information about these reports may be obtained by contacting the Authority’s Water Quality Division at 540.853.5700.
Data collected during calendar year 2020 or most recent testing period. Data presented as (range) average. PWSID# 5067244
Smith Mountain Lake
Water Treatment Facility
working together to provide the region’s drinking water
24

Substance |
|
Units |
Ideal Goals |
Highest Level Allowed |
Violation |
Data Collected at the SML |
Data Collected in the Westlake |
|
(EPA’s MCLG) |
(EPA’s MCL) |
Water Treatment Facility |
Area Water System |
|||
|
|
|
|
||||
|
|
|
|
|
|
|
|
Regulated Substances |
|
|
|
|
|
|
|
|
|
|
|
|
|
|
|
Barium |
|
ppm |
2 |
2 |
no |
0.03 |
|
|
|
|
|
|
|
|
|
Fluoride |
|
ppm |
4 |
4 |
no |
(0.6 - 0.96) 0.8 |
|
|
|
|
|
|
|
|
|
Total Nitrate & Nitrite |
|
ppm |
10 |
10 |
no |
0.3 |
|
(as N) |
|
|
|||||
|
|
|
|
|
|
|
|
Turbidity |
|
NTU |
TT |
0.3 |
no |
(0.05 - 0.18) 0.05 |
|
Radioactive Contaminants |
|
|
|
|
|
|
|
|
|
|
|
|
|
|
|
Gross Alpha |
|
pCi/L |
0 |
15 |
no |
0.28 |
|
|
|
|
|
|
|
|
|
Gross Beta |
|
pCi/L |
0 |
50 |
no |
n/a |
|
|
|
|
|
|
|
|
|
Combined Radium |
|
pCi/L |
0 |
5 |
no |
0.58 |
|
Lead and Copper Testing |
|
|
|
|
|
|
|
|
|
|
|
|
|
|
|
Lead |
|
ppb |
0 ppb |
AL = 15 |
no |
|
0 of 15 samples exceeded AL |
|
|
90th percentile = 3.5 ppb |
|||||
|
|
|
|
|
|
|
|
Copper |
|
ppm |
1.3 ppm |
AL = 1.3 |
no |
|
0 of 15 samples exceeded AL |
|
|
90th percentile = 0.372 ppm |
|||||
|
|
|
|
|
|
|
|
Disinfectants and Disinfection |
|
|
|
|
|||
|
|
|
|
|
|
|
|
Chlorine |
|
ppm |
|
4 |
no |
(0.09 - 1.71) 1.7 |
|
|
|
|
|
|
|
|
|
HAA5s |
|
ppb |
0 |
60 |
no |
|
LRAA ( 33 - 42) |
|
|
Site Range (9.3 - 67) |
|||||
|
|
|
|
|
|
|
|
TTHMs |
|
ppb |
0 |
80 |
no |
|
LRAA (52 - 57) |
|
|
Site Range (37 - 69.7) |
|||||
|
|
|
|
|
|
|
|
Microbiological Substances |
|
|
|
|
|
|
|
|
|
|
|
|
|
|
|
Total Coliforms |
|
P/A |
0 |
Presence of coliform bacteria |
no |
0 |
0 |
|
in >5% of monthly samples |
||||||
|
|
|
|
|
|
|
|
|
|
|
|
|
|
|
|
|
|
|
|
A routine and a repeat |
|
|
|
E. coli |
|
P/A |
0 |
sample are total coliform |
no |
0 |
0 |
|
positive, and one is also fecal |
||||||
|
|
|
|
|
|
|
|
|
|
|
|
coliform or E. coli positive. |
|
|
|
|
|
|
|
|
|
|
|
Unregulated and Secondary Substances |
|
|
|
|
|
||
|
|
|
|
|
|
|
|
Alkalinity |
|
ppm |
unregulated |
|
n/a |
(65- 116) 87 |
|
|
|
|
|
|
|
|
|
Conductivity |
|
μmhos/cm |
unregulated |
|
n/a |
215 |
|
|
|
|
|
|
|
|
|
Hardness (Total) |
|
ppm |
unregulated |
|
n/a |
(58 - 109 )87 |
|
|
|
|
|
|
|
|
|
Iron |
|
ppm |
|
0.3 |
n/a |
(0 - 0.4) 0.01 |
|
Manganese |
|
ppm |
|
0.05 |
n/a |
(0 - 0.005) 0.02 |
|
|
|
|
|
|
|
|
|
Orthophosphate as P |
|
ppm |
unregulated |
|
n/a |
<0.05 |
|
|
|
|
|
|
|
|
|
pH |
|
pH units |
|
6.5 - 8.5 |
no |
(7.2 - 8.1) 7.6 |
|
|
|
|
|
|
|
|
|
Sodium |
|
ppm |
unregulated |
|
n/a |
8.64 |
|
Zinc |
|
ppm |
|
5 |
n/a |
ND |
|
|
|
|
|
|
|
|
|
25
Franklin County Systems
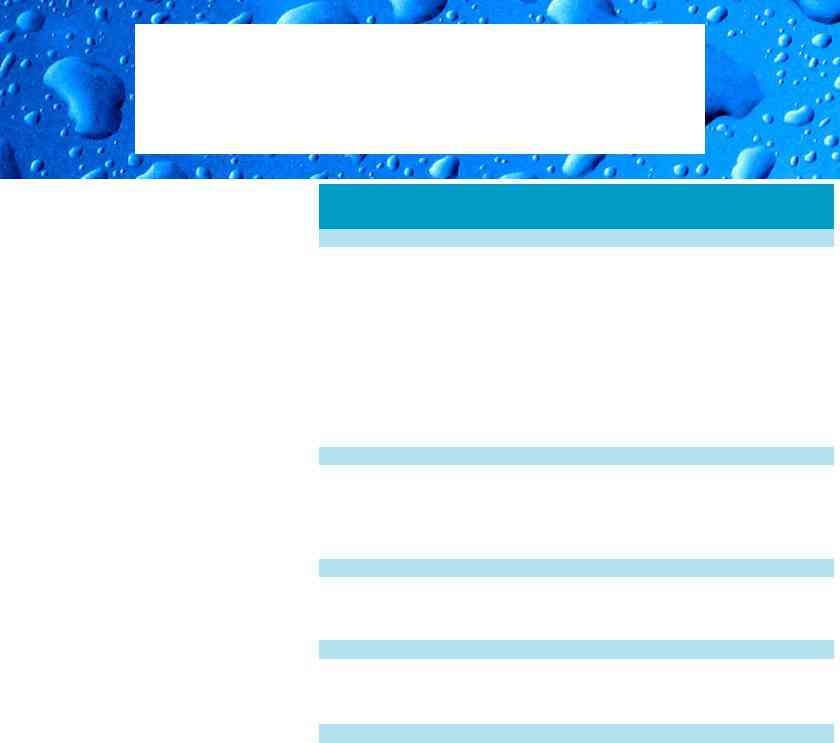
Alton Park Water System
The Alton Park Water System is served by two groundwater wells and related storage facility. The Western Virginia Water Authority is pleased to report that this water meets all requirements, and there were no drinking water violations in calendar year 2020.
The Western Virginia Water Authority has worked with the Virginia Department of Health to determine our water sources susceptibility to contaminants. The assessment is a requirement of the Virginia Department of Health’s (VDH) Source Water Assessment Program (SWAP) in accordance with the 1996 Amendments of the Safe Drinking Water Act. More specific information about these reports may be obtained by contacting the Western Virginia Water Authority’s Water Quality Division at 540.853.5700.
Data collected during calendar year 2020 or most recent testing period.
Data presented as (range) average.
PWSID# 5067020
|
|
|
Ideal Goals |
Highest Level |
|
Alton Park System Data |
Substance |
Units |
|
(EPA’s |
Allowed |
Violation |
|
|
(range) average |
|||||
|
|
|
MCLG) |
(EPA’s MCL) |
|
|
|
|
|
|
|
||
Regulated Substances |
|
|
|
|
|
|
|
|
|
|
|
|
|
Arsenic |
ppm |
|
0 |
0.01 |
no |
0.00013 |
|
|
|
|
|
|
|
Barium |
ppm |
|
2 |
2 |
no |
0.011 |
|
|
|
|
|
|
|
Cadmium |
ppm |
|
0.005 |
0.005 |
no |
0.00014 |
|
|
|
|
|
|
|
Chromium |
ppm |
|
0.1 |
0.1 |
no |
0.00197 |
|
|
|
|
|
|
|
Ethylbenzene |
ppb |
|
|
700 |
no |
5.5 |
|
|
|
|
|
|
|
Fluoride |
ppm |
|
4 |
4 |
no |
0.096 |
|
|
|
|
|
|
|
Thalium |
ppm |
|
0.0005 |
0.002 |
no |
0.00002 |
|
|
|
|
|
|
|
Total Nitrate & Nitrite |
ppm |
|
10 |
10 |
no |
0.12 |
(as N) |
|
|||||
|
|
|
|
|
|
|
Turbidity |
NTU |
|
TT |
0.3 |
no |
0.13 |
|
|
|
|
|
|
|
Xylene |
ppb |
|
|
10,000 |
no |
13.7 |
|
|
|
|
|
|
|
Radioactive Contaminants |
|
|
|
|
|
|
|
|
|
|
|
|
|
Gross Alpha |
pCi/L |
|
0 |
15 |
no |
3.1 |
|
|
|
|
|
|
|
Gross Beta |
pCi/L |
|
0 |
50 |
no |
4.7 |
|
|
|
|
|
|
|
Radium 226 |
pCi/L |
|
0 |
5 |
no |
0.23 |
|
|
|
|
|
|
|
Radium 228 |
pCi/L |
|
0 |
5 |
no |
0.36 |
|
|
|
|
|
|
|
Combined Radium |
pCi/L |
|
0 |
5 |
no |
0.59 |
|
|
|
|
|
|
|
Lead and Copper Testing |
|
|
|
|
|
|
|
|
|
|
|
|
|
Lead |
ppb |
|
0 ppb |
AL = 15 |
no |
0 of 5 samples exceeded AL |
|
90th percentile = 1.4 ppb |
|||||
|
|
|
|
|
|
|
Copper |
ppm |
|
1.3 ppm |
AL = 1.3 |
no |
0 of 5 samples exceeded AL |
|
90th percentile = 0.134 ppm |
|||||
|
|
|
|
|
|
|
Disinfectants and Disinfection |
|
|
|
|
||
|
|
|
|
|
|
|
Chlorine |
ppm |
|
|
4 |
no |
n/a |
|
|
|
|
|
|
|
HAA5s |
ppb |
|
0 |
60 |
no |
n/a |
|
|
|
|
|
|
|
TTHMs |
ppb |
|
0 |
80 |
no |
n/a |
|
|
|
|
|
|
|
Unregulated and Secondary Substances |
|
|
|
|
||
|
|
|
|
|
|
|
Alkalinity |
ppm |
|
unregulated |
|
n/a |
96 |
|
|
|
|
|
|
|
Conductivity |
μmhos/cm |
|
unregulated |
|
n/a |
192 |
Hardness (Total) |
ppm |
|
unregulated |
|
n/a |
90 |
|
|
|
|
|
|
|
Iron |
ppm |
|
|
0.3 |
n/a |
ND |
Manganese |
ppm |
|
|
0.05 |
n/a |
0.0006 |
Orthophosphate as P |
ppm |
|
unregulated |
|
n/a |
ND |
pH |
pH units |
|
|
6.5 - 8.5 |
no |
7.28 |
Sodium |
ppm |
|
unregulated |
|
n/a |
2 |
Zinc |
ppm |
|
|
5 |
n/a |
0.525 |
|
|
|
|
|
|
|
Microbiological Substances |
Units |
EPA’s MCLG |
Highest Level Allowed - EPA’s MCL |
Violation |
Level Detected |
|
Total Coliforms |
P/A |
0 |
Presence of coliform bacteria in >5% of monthly samples |
no |
0 |
|
|
|
|
|
|
|
|
E. coli |
P/A |
0 |
A routine and a repeat sample are total coliform positive, and one |
no |
0 |
|
is also fecal coliform or E. coli positive. |
||||||
|
|
|
|
|
26
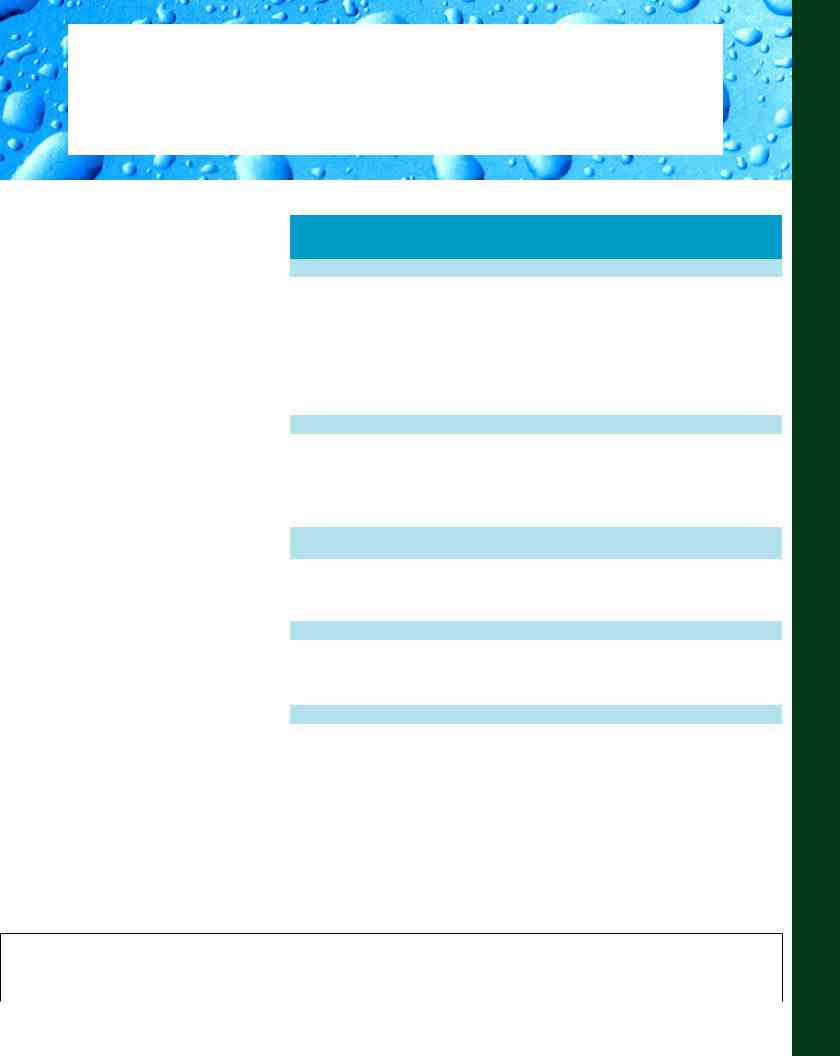
Burnt Chimney Water System
In 2018, the Authority combined four existing waterworks (Boxwood Green, Fox Chase, Royal Estates and Dam Shores) to form the Burnt Chimney Water System to serve these communities.
The system consists of five drilled groundwater wells and related storage facilities.
Greensand filters are used to remove iron and manganese from the drinking water. Soda ash is used for pH adjustment and chlorine is used for disinfection of the water. The Western Virginia Water Authority is pleased to report that this water meets all requirements, and there were no drinking water violations in calendar year 2020.
The Western Virginia Water Authority has worked with the Virginia Department of Health to determine our water sources susceptibility to contaminants. The assessment is a requirement of the Virginia Department of Health’s (VDH) Source Water Assessment Program (SWAP) in accordance with the 1996 Amendments of the Safe Drinking Water Act. More specific information about these reports may be obtained by contacting the Western Virginia Water Authority’s Water Quality Division at 540.853.5700.
Data collected during calendar year 2020 or most recent testing period.
Data presented as (range) average.
PWSID# 5067042
|
|
|
Ideal Goals |
Highest Level |
|
Burnt Chimney System Data |
Substance |
|
Units |
Allowed |
Violation |
||
|
(EPA’s MCLG) |
(range) average |
||||
|
|
|
(EPA’s MCL) |
|
||
|
|
|
|
|
|
|
Regulated Substances |
|
|
|
|
|
|
|
|
|
|
|
|
|
Barium |
|
ppm |
2 |
2 |
no |
0.019 |
|
|
|
|
|
|
|
Chromium |
|
ppm |
0.1 |
0.1 |
no |
0.0011 |
|
|
|
|
|
|
|
Fluoride |
|
ppm |
4 |
4 |
no |
ND |
|
|
|
|
|
|
|
Total Nitrate & |
|
ppm |
10 |
10 |
no |
0.4 |
Nitrite (as N) |
|
|||||
|
|
|
|
|
|
|
Total Organic |
|
ppm |
TT |
N/A |
no |
n/a |
Carbon |
|
|||||
|
|
|
|
|
|
|
Turbidity |
|
NTU |
TT |
0.3 |
no |
(0.42 - 19.8) 2.18 |
|
|
|
|
|
|
|
Radioactive Contaminants |
|
|
|
|
||
|
|
|
|
|
|
|
Gross Alpha |
|
pCi/L |
0 |
15 |
no |
0.53 |
|
|
|
|
|
|
|
Gross Beta |
|
pCi/L |
0 |
50 |
no |
2.4 |
|
|
|
|
|
|
|
Radium 226 |
|
pCi/L |
0 |
5 |
no |
0.45 |
|
|
|
|
|
|
|
Radium 228 |
|
pCi/L |
0 |
5 |
no |
0.74 |
|
|
|
|
|
|
|
Combined Radium |
|
pCi/L |
0 |
5 |
no |
1.19 |
|
|
|
|
|
|
|
Lead and Copper |
|
|
|
|
|
|
Testing |
|
|
|
|
|
|
Lead |
|
ppb |
0 ppb |
AL = 15 |
no |
0 of 11 samples exceeded AL |
|
90th percentile = 5.0 ppb |
|||||
|
|
|
|
|
|
|
Copper |
|
ppm |
1.3 ppm |
AL = 1.3 |
no |
0 of 11 samples exceeded AL |
|
90th percentile = 0.74 ppm |
|||||
|
|
|
|
|
|
|
Disinfectants and Disinfection |
|
|
|
|||
|
|
|
|
|
|
|
Chlorine |
|
ppm |
|
4 |
no |
(0.89 - 1.2) 1.02 |
|
|
|
|
|
|
|
HAA5s |
|
ppb |
0 |
60 |
no |
1.1 |
|
|
|
|
|
|
|
TTHMs |
|
ppb |
0 |
80 |
no |
2.8 |
|
|
|
|
|
|
|
Unregulated and Secondary Substances |
|
|
|
|||
|
|
|
|
|
|
|
Alkalinity |
|
ppm |
unregulated |
|
n/a |
(66 - 94) 83 |
|
|
|
|
|
|
|
Hardness (Total) |
|
ppm |
unregulated |
|
n/a |
(33 - 62) 41 |
|
|
|
|
|
|
|
Iron |
|
ppm |
|
0.3 |
n/a |
0.021 |
Manganese |
|
ppm |
|
0.05 |
n/a |
ND |
|
|
|
|
|
|
|
Orthophosphate |
|
ppm |
unregulated |
|
n/a |
ND |
as P |
|
|
||||
|
|
|
|
|
|
|
pH |
|
pH units |
|
6.5 - 8.5 |
no |
(7.1 - 7.8) 7.6 |
Sodium |
|
ppm |
unregulated |
|
n/a |
18 |
Zinc |
|
ppm |
|
5 |
n/a |
0.16 |
|
|
|
|
|
|
|
Franklin County
Microbiological Substances |
Units |
EPA’s MCLG |
Highest Level Allowed - EPA’s MCL |
Violation |
Level Detected |
|
Total Coliforms |
P/A |
0 |
Presence of coliform bacteria in >5% of monthly samples |
no |
0 |
|
|
|
|
|
|
|
|
E. coli |
P/A |
0 |
A routine and a repeat sample are total coliform positive, and one is |
no |
0 |
|
also fecal coliform or E. coli positive. |
||||||
|
|
|
|
|
Systems
27
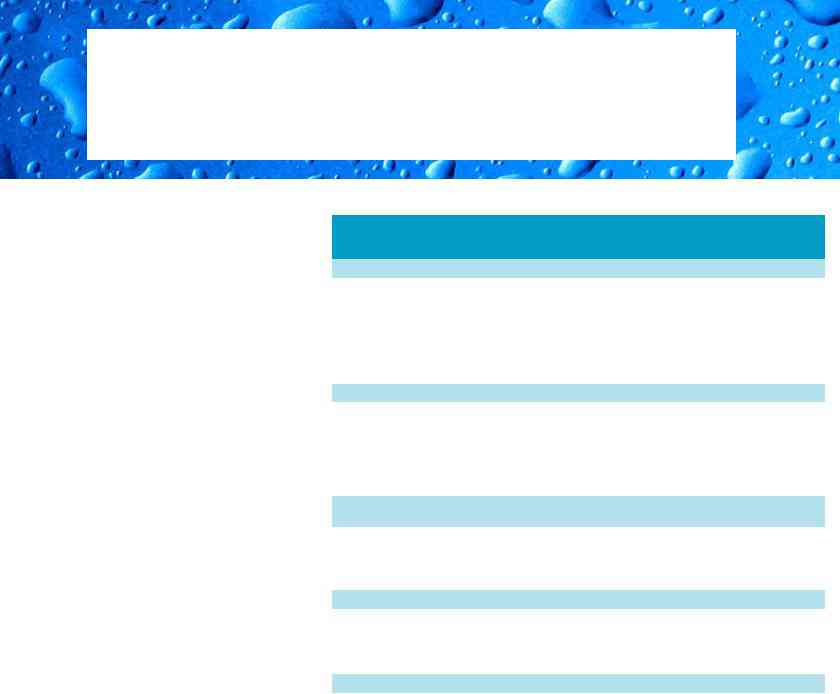
Cherokee Hills Water System
The Cherokee Hills community’s waterworks consists of two drilled wells and a storage tank. Treatment included sequestration for iron and manganese and chlorination. The Western Virginia Water Authority is pleased to report that this water meets all requirements, and there were no drinking water violations in calendar year 2020.
The level of Iron detected (1.26 ppm) is above the EPA’s recommended secondary maximum contaminant levels or (SMCLs) of 0.3 ppm for Iron. There are currently no known adverse health effects associated with the presence of iron at this level; however, it can result in aesthetic problems such as staining or discoloration of clothes and fixtures, as well as the impairment of taste of beverages made with the water.
The Western Virginia Water Authority has worked with the Virginia Department of Health to determine our water sources susceptibility to contaminants. The assessment is a requirement of the Virginia Department of Health’s (VDH) Source Water Assessment Program (SWAP) in accordance with the 1996 Amendments of the Safe Drinking Water Act. More specific information about these reports may be obtained by contacting the Western Virginia Water Authority’s Water Quality Division at 540.853.5700.
Data collected during calendar year 2020 or most recent testing period.
Data presented as (range) average.
PWSID# 5067070
|
|
|
Ideal Goals |
Highest Level |
|
Cherokee Hills System Data |
Substance |
|
Units |
Allowed |
Violation |
||
|
(EPA’s MCLG) |
(range) average |
||||
|
|
|
(EPA’s MCL) |
|
||
|
|
|
|
|
|
|
Regulated Substances |
|
|
|
|
|
|
|
|
|
|
|
|
|
Antimony |
|
ppm |
0.006 |
0.006 |
no |
0.0005 |
|
|
|
|
|
|
|
Barium |
|
ppm |
2 |
2 |
no |
0.0131 |
|
|
|
|
|
|
|
Fluoride |
|
ppm |
4 |
4 |
no |
0.09 |
|
|
|
|
|
|
|
Total Nitrate & |
|
ppm |
10 |
10 |
no |
0.084 |
Nitrite (as N) |
|
|||||
|
|
|
|
|
|
|
Turbidity |
|
NTU |
TT |
0.3 |
no |
2.17 |
|
|
|
|
|
|
|
Radioactive Contaminants |
|
|
|
|
||
|
|
|
|
|
|
|
Gross Alpha |
|
pCi/L |
0 |
15 |
no |
4.2 |
|
|
|
|
|
|
|
Gross Beta |
|
pCi/L |
0 |
50 |
no |
7.5 |
|
|
|
|
|
|
|
Radium 226 |
|
pCi/L |
0 |
5 |
no |
1.4 |
|
|
|
|
|
|
|
Radium 228 |
|
pCi/L |
0 |
5 |
no |
2.8 |
|
|
|
|
|
|
|
Combined Radium |
|
pCi/L |
0 |
5 |
no |
4.2 |
|
|
|
|
|
|
|
Lead and Copper |
|
|
|
|
|
|
Testing |
|
|
|
|
|
|
Lead |
|
ppb |
0 ppb |
AL = 15 |
no |
0 of 6 samples exceeded AL |
|
90th percentile = 3.2 ppb |
|||||
|
|
|
|
|
|
|
Copper |
|
ppm |
1.3 ppm |
AL = 1.3 |
no |
0 of 6 samples exceeded AL |
|
90th percentile = 0.444 ppm |
|||||
|
|
|
|
|
|
|
Disinfectants and Disinfection |
|
|
|
|||
|
|
|
|
|
|
|
Chlorine |
|
ppm |
|
4 |
no |
(ND - 2.18) 0.69 |
|
|
|
|
|
|
|
HAA5s |
|
ppb |
0 |
60 |
no |
ND |
|
|
|
|
|
|
|
TTHMs |
|
ppb |
0 |
80 |
no |
5.6 |
|
|
|
|
|
|
|
Unregulated and Secondary Substances |
|
|
|
|||
|
|
|
|
|
|
|
Alkalinity |
|
ppm |
unregulated |
|
n/a |
44.1 |
|
|
|
|
|
|
|
Conductivity |
|
μmhos/cm |
unregulated |
|
n/a |
159 |
|
|
|
|
|
|
|
Hardness (Total) |
|
ppm |
unregulated |
|
n/a |
36.5 |
|
|
|
|
|
|
|
Iron |
|
ppm |
|
0.3 |
n/a |
1.26 |
Manganese |
|
ppm |
|
0.05 |
n/a |
0.0296 |
|
|
|
|
|
|
|
Orthophosphate |
|
ppm |
unregulated |
|
n/a |
ND |
as P |
|
|
||||
|
|
|
|
|
|
|
pH |
|
pH units |
|
6.5 - 8.5 |
no |
5.75 |
Sodium |
|
ppm |
unregulated |
|
n/a |
13.9 |
Zinc |
|
ppm |
|
5 |
n/a |
0.037 |
|
|
|
|
|
|
|
Microbiological Substances |
Units |
EPA’s MCLG |
Highest Level Allowed - EPA’s MCL |
Violation |
Level Detected |
|
Total Coliforms |
P/A |
0 |
Presence of coliform bacteria in >5% of monthly samples |
no |
0 |
|
|
|
|
|
|
|
|
E. coli |
P/A |
0 |
A routine and a repeat sample are total coliform positive, and one |
no |
0 |
|
is also fecal coliform or E. coli positive. |
||||||
|
|
|
|
|
28
Compass Cove Water System
This water system supplies water to the Compass Cove and Sunset Point Subdivisions. The waterworks consists of three drilled wells and a storage tank. Treatment includes iron and manganese removal.The Western Virginia Water Authority is pleased to report that this water meets all requirements, and there were no drinking water violations in calendar year 2020.
There is no State or Federal MCL for sodium. Monitoring is required to provide information to consumers and health officials that are concerned about sodium intake due to dietary restrictions. The sodium level in the water was measured at 39.4 ppm in 2018. This is more than the EPA recommended optimal level of less than 20 ppm, established for people on a “strict” sodium intake diet.
The Western Virginia Water Authority has worked with the Virginia Department of Health to determine our water sources susceptibility to contaminants. The assessment is a requirement of the Virginia Department of Health’s (VDH) Source Water Assessment Program (SWAP) in accordance with the 1996 Amendments of the Safe Drinking Water Act. More specific information about these reports may be obtained by contacting the Western Virginia Water Authority’s Water Quality Division at 540.853.5700.
Data collected during calendar year 2020 or most recent testing period.
Data presented as (range) average.
PWSID# 5067083
|
|
|
Ideal Goals |
Highest Level |
|
Compass Cove System Data |
Substance |
|
Units |
Allowed |
Violation |
||
|
(EPA’s MCLG) |
(range) average |
||||
|
|
|
(EPA’s MCL) |
|
||
|
|
|
|
|
|
|
Regulated Substances |
|
|
|
|
|
|
|
|
|
|
|
|
|
Barium |
|
ppm |
2 |
2 |
no |
0.0463 |
|
|
|
|
|
|
|
Fluoride |
|
ppm |
4 |
4 |
no |
0.07 |
|
|
|
|
|
|
|
Total Nitrate & |
|
ppm |
10 |
10 |
no |
ND |
Nitrite (as N) |
|
|||||
|
|
|
|
|
|
|
Turbidity |
|
NTU |
TT |
0.3 |
no |
ND |
|
|
|
|
|
|
|
Radioactive Contaminants |
|
|
|
|
||
|
|
|
|
|
|
|
Gross Alpha |
|
pCi/L |
0 |
15 |
no |
1.8 |
|
|
|
|
|
|
|
Gross Beta |
|
pCi/L |
0 |
50 |
no |
13.3 |
|
|
|
|
|
|
|
Radium 226 |
|
pCi/L |
0 |
5 |
no |
1.5 |
|
|
|
|
|
|
|
Radium 228 |
|
pCi/L |
0 |
5 |
no |
1.5 |
|
|
|
|
|
|
|
Combined Radium |
|
pCi/L |
0 |
5 |
no |
3.3 |
|
|
|
|
|
|
|
Lead and Copper |
|
|
|
|
|
|
Testing |
|
|
|
|
|
|
Lead |
|
ppb |
0 ppb |
AL = 15 |
no |
0 of 5 samples exceeded AL |
|
90th percentile = 6.9 ppb |
|||||
|
|
|
|
|
|
|
Copper |
|
ppm |
1.3 ppm |
AL = 1.3 |
no |
0 of 5 samples exceeded AL |
|
90th percentile = 0.079 ppm |
|||||
|
|
|
|
|
|
|
Disinfectants and Disinfection |
|
|
|
|||
|
|
|
|
|
|
|
Chlorine |
|
ppm |
|
4 |
no |
(0.7 - 1.08) 0.92 |
|
|
|
|
|
|
|
HAA5s |
|
ppb |
0 |
60 |
no |
1.05 |
|
|
|
|
|
|
|
TTHMs |
|
ppb |
0 |
80 |
no |
7.38 |
|
|
|
|
|
|
|
Unregulated and Secondary Substances |
|
|
|
|||
|
|
|
|
|
|
|
Alkalinity |
|
ppm |
unregulated |
|
n/a |
159 |
|
|
|
|
|
|
|
Hardness (Total) |
|
ppm |
unregulated |
|
n/a |
89.4 |
|
|
|
|
|
|
|
Iron |
|
ppm |
|
0.3 |
n/a |
ND |
Manganese |
|
ppm |
|
0.05 |
n/a |
ND |
|
|
|
|
|
|
|
Orthophosphate |
|
ppm |
unregulated |
|
n/a |
ND |
as P |
|
|
||||
|
|
|
|
|
|
|
pH |
|
pH units |
|
6.5 - 8.5 |
no |
(7.5 - 7.8) 7.6 |
Sodium |
|
ppm |
unregulated |
|
n/a |
39.4 |
Zinc |
|
ppm |
|
5 |
n/a |
0.214 |
|
|
|
|
|
|
|
|
|
|
|
|
|
Franklin County |
|
Microbiological Substances |
Units |
EPA’s MCLG |
Highest Level Allowed - EPA’s MCL |
Violation |
Level Detected |
||
Systems |
|||||||
E. coli |
P/A |
0 |
A routine and a repeat sample are total coliform positive, and one is |
no |
0 |
||
Total Coliforms |
P/A |
0 |
Presence of coliform bacteria in >5% of monthly samples |
no |
2 |
|
|
|
|
|
also fecal coliform or E. coli positive. |
|
|
|
|
|
|
|
|
|
|
|
29
Dillards Hill Water System
The Dillards Hill Water System consists of nine drilled wells (Contentment Island wells 1, 2,
-
and 4, Highland Lake well 2, Kennedy Shores wells 1 and 2 and Lands End Wells 1 and 2) and related storage facility.
Pre-treatment of the water includes the addition of soda ash, potassium permanganate and sodium hypochlorite solutions, and greensand filters are used to remove iron and manganese from the drinking water.
There is no State or Federal MCL for sodium. Monitoring is required to provide information to consumers and health officials that are concerned about sodium intake due to dietary restrictions. The sodium level in the water was measured at 38 ppm in 2020. This is more than the EPA recommended optimal level of less than 20 ppm, established for people on a “strict” sodium intake diet. This elevated level of sodium could be caused by the addition of soda ash.
The Western Virginia Water Authority (WVWA) has worked with the Virginia Department of Health (VDH) to determine our water sources susceptibility to contaminants. The assessment is a requirement of VDH Source Water Assessment Program (SWAP) in accordance with the 1996 Amendments of the Safe Drinking Water Act. More specific information about these reports may be obtained by contacting the Authority’s Water Quality Division at 540.853.5700.
Data collected during calendar year 2020 or most recent testing period.
Data presented as (range) average.
PWSID# 5067415
|
|
|
Ideal Goals |
Highest Level |
|
Dillard’s Hill System Data |
Substance |
|
Units |
Allowed |
Violation |
||
|
(EPA’s MCLG) |
(range) average |
||||
|
|
|
(EPA’s MCL) |
|
||
|
|
|
|
|
|
|
Regulated Substances |
|
|
|
|
|
|
|
|
|
|
|
|
|
Barium |
|
ppm |
2 |
2 |
no |
0.02 |
|
|
|
|
|
|
|
Fluoride |
|
ppm |
4 |
4 |
no |
0.1 |
|
|
|
|
|
|
|
Total Nitrate & |
|
ppm |
10 |
10 |
no |
0.3 |
Nitrite (as N) |
|
|||||
|
|
|
|
|
|
|
Turbidity |
|
NTU |
TT |
0.3 |
no |
ND |
|
|
|
|
|
|
|
Radioactive Contaminants |
|
|
|
|
||
|
|
|
|
|
|
|
Gross Alpha |
|
pCi/L |
0 |
15 |
no |
(1.3 - 5.5) |
|
|
|
|
|
|
|
Gross Beta |
|
pCi/L |
0 |
50 |
no |
(3.6 - 9.3) |
|
|
|
|
|
|
|
Radium 226 |
|
pCi/L |
0 |
5 |
|
0.57 |
|
|
|
|
|
|
|
Radium 228 |
|
pCi/L |
0 |
5 |
|
(0.89 - 1.3) |
|
|
|
|
|
|
|
Combined Radium |
|
pCi/L |
0 |
5 |
no |
(1.46 - 2.6) |
|
|
|
|
|
|
|
Lead and Copper |
|
|
|
|
|
|
Testing |
|
|
|
|
|
|
Lead |
|
ppb |
0 ppb |
AL = 15 |
no |
0 of 21 samples exceeded AL |
|
90th percentile = 3 ppb |
|||||
|
|
|
|
|
|
|
Copper |
|
ppm |
1.3 ppm |
AL = 1.3 |
no |
0 of 21 samples exceeded AL |
|
90th percentile = 0.84 ppm |
|||||
|
|
|
|
|
|
|
Disinfectants and Disinfection |
|
|
|
|||
|
|
|
|
|
|
|
Chlorine |
|
ppm |
|
4 |
no |
(1.04 - 1.36) 1.2 |
|
|
|
|
|
|
|
HAA5s |
|
ppb |
0 |
60 |
no |
ND |
|
|
|
|
|
|
|
TTHMs |
|
ppb |
0 |
80 |
no |
3.3 |
|
|
|
|
|
|
|
Unregulated and Secondary Substances |
|
|
|
|||
|
|
|
|
|
|
|
Alkalinity |
|
ppm |
unregulated |
|
n/a |
119 |
|
|
|
|
|
|
|
Conductivity |
|
μmhos/cm |
unregulated |
|
n/a |
270 |
|
|
|
|
|
|
|
Hardness (Total) |
|
ppm |
unregulated |
|
n/a |
53 |
|
|
|
|
|
|
|
Iron |
|
ppm |
|
0.3 |
n/a |
ND |
Manganese |
|
ppm |
|
0.05 |
n/a |
ND |
|
|
|
|
|
|
|
Orthophosphate |
|
ppm |
unregulated |
|
n/a |
ND |
as P |
|
|
||||
|
|
|
|
|
|
|
pH |
|
pH units |
|
6.5 - 8.5 |
no |
(7.3 - 7.8) 7.6 |
Sodium |
|
ppm |
unregulated |
|
n/a |
38 |
Zinc |
|
ppm |
|
5 |
n/a |
0.18 |
|
|
|
|
|
|
|
Microbiological Substances |
Units |
EPA’s MCLG |
Highest Level Allowed - EPA’s MCL |
Violation |
Level Detected |
|
Total Coliforms |
P/A |
0 |
Presence of coliform bacteria in >5% of monthly samples |
no |
0 |
|
|
|
|
|
|
|
|
E. coli |
P/A |
0 |
A routine and a repeat sample are total coliform positive, and one |
no |
0 |
|
is also fecal coliform or E. coli positive. |
||||||
|
|
|
|
|
30
Frederick Acres Water System
A groundwater well provides water for the Frederick Acres community. A
The Western Virginia Water Authority is pleased to report that this water meets all requirements, and there were no drinking water violations in calendar year 2020.
A source water assessment for Frederick Acres has been conducted by the Virginia Department of Health. Well(s) serving this community were determined to be of high susceptibility to contamination using the criteria developed by the state in its approved Source Water Assessment Program. The assessment determined that these wells might be susceptible to contamination because they are located in areas that promote migration of contaminants from land use activities of concern. More specific information about these reports may be obtained by contacting the Authority’s Water Quality Division at 540.853.5700.
Manganese (0.0567 ppm) is above the EPA’s recommended secondary maximum contaminant levels or (SMCLs) of 0.05 ppm for Manganese. There are currently no known adverse health effects associated with the presence of manganese at this level; however, it can result in aesthetic problems such as staining or discoloration of clothes and fixtures, as well as the impairment of taste of beverages made with the water.
Data collected during calendar year 2020 or most recent testing period.
Data presented as (range) average.
PWSID# #5067160
|
|
|
Ideal Goals |
Highest Level |
|
Frederick Acres System Data |
Substance |
|
Units |
Allowed |
Violation |
||
|
(EPA’s MCLG) |
(range) average |
||||
|
|
|
(EPA’s MCL) |
|
||
|
|
|
|
|
|
|
Regulated Substances |
|
|
|
|
|
|
|
|
|
|
|
|
|
Antimony |
|
ppm |
0.006 |
0.006 |
no |
0.0007 |
|
|
|
|
|
|
|
Arsenic |
|
ppm |
0 |
0.01 |
no |
0.001 |
|
|
|
|
|
|
|
Barium |
|
ppm |
2 |
2 |
no |
0.0603 |
|
|
|
|
|
|
|
Fluoride |
|
ppm |
4 |
4 |
no |
0.08 |
|
|
|
|
|
|
|
Total Nitrate & |
|
ppm |
10 |
10 |
no |
ND |
Nitrite (as N) |
|
|||||
|
|
|
|
|
|
|
Turbidity |
|
NTU |
TT |
0.3 |
no |
2.51 |
|
|
|
|
|
|
|
Ethylbenzene |
|
ppb |
|
700 |
no |
(ND - 2.19) |
|
|
|
|
|
|
|
Vinyl Chloride |
|
ppb |
|
200 |
no |
|
|
|
|
|
|
|
|
Total Xylene |
|
ppb |
|
10,000 |
no |
(ND - 21.4) |
|
|
|
|
|
|
|
Radioactive Contaminants |
|
|
|
|
||
|
|
|
|
|
|
|
Gross Alpha |
|
pCi/L |
0 |
15 |
no |
1.2 |
|
|
|
|
|
|
|
Gross Beta |
|
pCi/L |
0 |
50 |
no |
6.9 |
|
|
|
|
|
|
|
Radium 226 |
|
pCi/L |
0 |
5 |
no |
|
|
|
|
|
|
|
|
Radium 228 |
|
pCi/L |
0 |
5 |
no |
0.22 |
|
|
|
|
|
|
|
Combined Radium |
|
pCi/L |
0 |
5 |
no |
1.42 |
|
|
|
|
|
|
|
Lead and Copper |
|
|
|
|
|
|
Testing |
|
|
|
|
|
|
Lead |
|
ppb |
0 ppb |
AL = 15 |
no |
0 of 5 samples exceeded AL |
|
90th percentile = 9.7 ppb |
|||||
|
|
|
|
|
|
|
Copper |
|
ppm |
1.3 ppm |
AL = 1.3 |
no |
0 of 5 samples exceeded AL |
|
90th percentile = 0.219 ppm |
|||||
|
|
|
|
|
|
|
Disinfectants and Disinfection |
|
|
|
|||
Chlorine |
|
ppm |
|
4 |
no |
(0.35 - 1.1) 0.56 |
|
|
|
|
|
|
|
HAA5s |
|
ppb |
0 |
60 |
no |
ND |
|
|
|
|
|
|
|
TTHMs |
|
ppb |
0 |
80 |
no |
2.2 |
|
|
|
|
|
|
|
Unregulated and Secondary Substances |
|
|
|
|||
|
|
|
|
|
|
|
Alkalinity |
|
ppm |
unregulated |
|
n/a |
55.7 |
|
|
|
|
|
|
|
Hardness (Total) |
|
ppm |
unregulated |
|
n/a |
47.3 |
|
|
|
|
|
|
|
Iron |
|
ppm |
|
0.3 |
n/a |
0.252 |
Manganese |
|
ppm |
|
0.05 |
n/a |
0.0567 |
|
|
|
|
|
|
|
Orthophosphate |
|
ppm |
unregulated |
|
n/a |
ND |
as P |
|
|
||||
|
|
|
|
|
|
|
pH |
|
pH units |
|
6.5 - 8.5 |
no |
6.86 |
Sodium |
|
ppm |
unregulated |
|
n/a |
3.65 |
Zinc |
|
ppm |
|
5 |
n/a |
0.0171 |
|
|
|
|
|
|
|
Franklin County
Microbiological Substances |
Units |
EPA’s MCLG |
Highest Level Allowed - EPA’s MCL |
Violation |
Level Detected |
|
Total Coliforms |
P/A |
0 |
Presence of coliform bacteria in >5% of monthly samples |
no |
0 |
|
|
|
|
|
|
|
|
E. coli |
P/A |
0 |
A routine and a repeat sample are total coliform positive, and one is |
no |
0 |
|
also fecal coliform or E. coli positive. |
||||||
|
|
|
|
|
Systems
31
The Retreat Water System
In 2018, the Authority interconnected the Retreat’s distribution system to provide potable water to Cedar Ridge, Lake Forest, The Coves and The Retreat. Groundwater from wells located in Lake Forest and The Retreat is pumped to The Retreat where
The Western Virginia Water Authority is pleased to report that the Retreat water system meets all requirements, and there were no drinking water violations in calendar year 2020.
The Western Virginia Water Authority has worked with the Virginia Department of Health to determine our water sources susceptibility to contaminants. The assessment is a requirement of the Virginia Department of Health’s (VDH) Source Water Assessment Program (SWAP) in accordance with the 1996 Amendments of the Safe Drinking Water Act. More specific information about these reports may be obtained by contacting the Authority’s Water Quality Division at 540.853.5700.
Data collected during calendar year 2020 or most recent testing period.
Data presented as (range) average.
PWSID# 5067786
|
|
|
Ideal Goals |
Highest Level |
|
The Retreat System Data |
Substance |
|
Units |
Allowed |
Violation |
||
|
(EPA’s MCLG) |
(range) average |
||||
|
|
|
(EPA’s MCL) |
|
||
|
|
|
|
|
|
|
Regulated Substances |
|
|
|
|
|
|
|
|
|
|
|
|
|
Barium |
|
ppm |
2 |
2 |
no |
0.041 |
|
|
|
|
|
|
|
Fluoride |
|
ppm |
4 |
4 |
no |
0.1 |
|
|
|
|
|
|
|
Total Nitrate & Nitrite |
|
ppm |
10 |
10 |
no |
ND |
(as N) |
|
|||||
|
|
|
|
|
|
|
Turbidity |
|
NTU |
TT |
0.3 |
no |
ND |
|
|
|
|
|
|
|
Radioactive Contaminants |
|
|
|
|
||
|
|
|
|
|
|
|
Gross Alpha |
|
pCi/L |
0 |
15 |
no |
(<2.92 - 4.8) 2.85 |
|
|
|
|
|
|
|
Gross Beta |
|
pCi/L |
0 |
50 |
no |
(3.24 - 6.3) 4.88 |
|
|
|
|
|
|
|
Radium 226 |
|
pCi/L |
0 |
5 |
no |
(0.96 - 1.6) 1.7 |
|
|
|
|
|
|
|
Radium 228 |
|
pCi/L |
0 |
5 |
no |
(0.59 - 1.12) 0.86 |
|
|
|
|
|
|
|
Combined Radium |
|
pCi/L |
0 |
5 |
no |
(1.36 - 2.46) 1.79 |
|
|
|
|
|
|
|
Lead and Copper Testing |
|
|
|
|
|
|
|
|
|
|
|
|
|
Lead |
|
ppb |
0 ppb |
AL = 15 |
no |
0 of 5 samples exceeded AL |
|
90th percentile = 5.0 ppb |
|||||
|
|
|
|
|
|
|
Copper |
|
ppm |
1.3 ppm |
AL = 1.3 |
no |
0 of 5 samples exceeded AL |
|
90th percentile = 0.57 ppm |
|||||
|
|
|
|
|
|
|
|
|
|
|
|
|
|
Disinfectants and Disinfection |
|
|
|
|||
|
|
|
|
|
|
|
Chlorine |
|
ppm |
|
4 |
no |
(0.65 - 1.0) 0.85 |
|
|
|
|
|
|
|
HAA5s |
|
ppb |
0 |
60 |
no |
3.2 |
|
|
|
|
|
|
|
TTHMs |
|
ppb |
0 |
80 |
no |
5.1 |
|
|
|
|
|
|
|
Unregulated and Secondary Substances |
|
|
|
|||
|
|
|
|
|
|
|
Alkalinity |
|
ppm |
unregulated |
|
n/a |
67.9 |
|
|
|
|
|
|
|
Conductivity |
|
μmhos/cm |
unregulated |
|
n/a |
190 |
|
|
|
|
|
|
|
Hardness (Total) |
|
ppm |
unregulated |
|
n/a |
64 |
|
|
|
|
|
|
|
Iron |
|
ppm |
|
0.3 |
n/a |
ND |
Manganese |
|
ppm |
|
0.05 |
n/a |
ND |
|
|
|
|
|
|
|
Orthophosphate as P |
|
ppm |
unregulated |
|
n/a |
ND |
pH |
|
pH units |
|
6.5 - 8.5 |
no |
(6.6 - 7.1) 6.8 |
Sodium |
|
ppm |
unregulated |
|
n/a |
11 |
Zinc |
|
ppm |
|
5 |
n/a |
0.17 |
|
|
|
|
|
|
|
Microbiological Substances |
Units |
EPA’s MCLG |
Highest Level Allowed - EPA’s MCL |
Violation |
Level Detected |
|
Total Coliforms |
P/A |
0 |
Presence of coliform bacteria in >5% of monthly samples |
no |
0 |
|
|
|
|
|
|
|
|
E. coli |
P/A |
0 |
A routine and a repeat sample are total coliform positive, and one |
no |
0 |
|
is also fecal coliform or E. coli positive. |
||||||
|
|
|
|
|
32
Ridgecrest Water System
The Ridgecrest Water System is served by a groundwater well and related storage facility.
Treatment consists of the addition of polyphosphate for removal of iron and manganese.
The Western Virginia Water Authority is pleased to report that this water meets all requirements, and there were no drinking water violations in calendar year 2020.
Manganese (0.22 ppm) and Iron levels (0.33 ppm) are above the EPA’s recommended secondary maximum contaminant levels or (SMCLs) of 0.05 ppm for Manganese and 0.3 for Iron. There are currently no known adverse health effects associated with the presence of manganese or iron at this level; however, it can result in aesthetic problems such as staining or discoloration of clothes and fixtures, as well as the impairment of taste of beverages made with the water.
The Western Virginia Water Authority has worked with the Virginia Department of Health to determine our water sources susceptibility to contaminants. The assessment is a requirement of the Virginia Department of Health’s (VDH) Source Water Assessment Program (SWAP) in accordance with the 1996 Amendments of the Safe Drinking Water Act. More specific information about these reports may be obtained by contacting the Western Virginia Water Authority’s Water Quality Division at 540.853.5700.
Data collected during calendar year 2020 or most recent testing period.
Data presented as (range) average.
PWSID# 5067785
|
|
|
Ideal Goals |
Highest Level |
|
Ridgecrest System Data |
Substance |
|
Units |
Allowed |
Violation |
||
|
(EPA’s MCLG) |
(range) average |
||||
|
|
|
(EPA’s MCL) |
|
||
|
|
|
|
|
|
|
Regulated Substances |
|
|
|
|
|
|
|
|
|
|
|
|
|
Barium |
|
ppm |
2 |
2 |
no |
0.012 |
|
|
|
|
|
|
|
Fluoride |
|
ppm |
4 |
4 |
no |
ND |
|
|
|
|
|
|
|
Total Nitrate & |
|
ppm |
10 |
10 |
no |
ND |
Nitrite (as N) |
|
|||||
|
|
|
|
|
|
|
Turbidity |
|
NTU |
TT |
0.3 |
no |
1.8 |
|
|
|
|
|
|
|
Radioactive Contaminants |
|
|
|
|
||
|
|
|
|
|
|
|
Gross Alpha |
|
pCi/L |
0 |
15 |
no |
4.3 |
|
|
|
|
|
|
|
Gross Beta |
|
pCi/L |
0 |
50 |
no |
3.5 |
|
|
|
|
|
|
|
Radium 226 |
|
pCi/L |
0 |
5 |
no |
1.9 |
|
|
|
|
|
|
|
Radium 228 |
|
pCi/L |
0 |
5 |
no |
1.5 |
|
|
|
|
|
|
|
Combined Radium |
|
pCi/L |
0 |
5 |
no |
3.4 |
|
|
|
|
|
|
|
Lead and Copper |
|
|
|
|
|
|
Testing |
|
|
|
|
|
|
Lead |
|
ppb |
0 ppb |
AL = 15 |
no |
0 of 6 samples exceeded AL |
|
90th percentile = ND |
|||||
|
|
|
|
|
|
|
Copper |
|
ppm |
1.3 ppm |
AL = 1.3 |
no |
0 of 6 samples exceeded AL |
|
90th percentile = 0.087 ppm |
|||||
|
|
|
|
|
|
|
|
|
|
|
|
|
|
Disinfectants and Disinfection |
|
|
|
|||
|
|
|
|
|
|
|
Chlorine |
|
ppm |
|
4 |
no |
N/A |
|
|
|
|
|
|
|
HAA5s |
|
ppb |
0 |
60 |
no |
N/A |
|
|
|
|
|
|
|
TTHMs |
|
ppb |
0 |
80 |
no |
N/A |
|
|
|
|
|
|
|
Unregulated and Secondary Substances |
|
|
|
|||
|
|
|
|
|
|
|
Alkalinity |
ppm |
unregulated |
|
n/a |
75.1 |
|
|
|
|
|
|
|
|
Conductivity |
μmhos/cm |
unregulated |
|
n/a |
190 |
|
|
|
|
|
|
|
|
Hardness (Total) |
ppm |
unregulated |
|
n/a |
84 |
|
|
|
|
|
|
|
|
Iron |
ppm |
|
0.3 |
n/a |
0.33 |
|
Manganese |
ppm |
|
0.05 |
n/a |
0.22 |
|
|
|
|
|
|
|
|
Orthophosphate |
ppm |
unregulated |
|
n/a |
0.76 |
|
as P |
|
|||||
|
|
|
|
|
||
pH |
pH units |
|
6.5 - 8.5 |
no |
7.6 |
|
|
|
|
|
|
|
|
Sodium |
ppm |
unregulated |
|
n/a |
5.4 |
|
Zinc |
ppm |
|
5 |
n/a |
0.056 |
|
Franklin County
Microbiological Substances |
Units |
EPA’s MCLG |
Highest Level Allowed - EPA’s MCL |
Violation |
Level Detected |
|
Total Coliforms |
P/A |
0 |
Presence of coliform bacteria in >5% of monthly samples |
no |
0 |
|
|
|
|
|
|
|
|
E. coli |
P/A |
0 |
A routine and a repeat sample are total coliform positive, and one is |
no |
0 |
|
also fecal coliform or E. coli positive. |
||||||
|
|
|
|
|
Systems
33

StarOverLake Water System
The Western Virginia Water Authority began operating Staroverlake Water System in January, 2020 and assumed ownership on October 19, 2020. The StarOverLake Water System is served by a three groundwater wells (wells 5, 7 and 8) and related storage facility.
The Western Virginia Water Authority is pleased to report that the StarOverLake water system meets all requirements, and there were no drinking water violations in calendar year 2020.
There is no State or Federal MCL for sodium. Monitoring is required to provide information to consumers and health officials that are concerned about sodium intake due to dietary restrictions. The sodium level in the water was measured at 61.5 ppm in 2020. This is more than the EPA recommended optimal level of less than 20 ppm, established for people on a “strict” sodium intake diet.
The Western Virginia Water Authority has worked with the Virginia Department of Health to determine our water sources susceptibility to contaminants. The assessment is a requirement of the Virginia Department of Health’s (VDH) Source Water Assessment Program (SWAP) in accordance with the 1996 Amendments of the Safe Drinking Water Act. More specific information about these reports may be obtained by contacting the Authority’s Water Quality Division at 540.853.5700.
Data collected during calendar year 2020 or most recent testing period.
Data presented as (range) average.
PWSID# 5067359
|
|
|
Ideal Goals |
Highest Level |
|
StarOverLake System Data |
Substance |
|
Units |
Allowed |
Violation |
||
|
(EPA’s MCLG) |
(range) average |
||||
|
|
|
(EPA’s MCL) |
|
||
|
|
|
|
|
|
|
Regulated Substances |
|
|
|
|
|
|
|
|
|
|
|
|
|
Barium |
|
ppm |
2 |
2 |
no |
0.12 |
|
|
|
|
|
|
|
Fluoride |
|
ppm |
4 |
4 |
no |
ND |
|
|
|
|
|
|
|
Total Nitrate & Nitrite |
|
ppm |
10 |
10 |
no |
1.5 |
(as N) |
|
|||||
|
|
|
|
|
|
|
Turbidity |
|
NTU |
TT |
0.3 |
no |
|
|
|
|
|
|
|
|
Radioactive Contaminants |
|
|
|
|
||
|
|
|
|
|
|
|
Gross Alpha |
|
pCi/L |
0 |
15 |
no |
ND |
|
|
|
|
|
|
|
Gross Beta |
|
pCi/L |
0 |
50 |
no |
3.3 |
|
|
|
|
|
|
|
Radium 226 |
|
pCi/L |
0 |
5 |
no |
|
|
|
|
|
|
|
|
Radium 228 |
|
pCi/L |
0 |
5 |
no |
ND |
|
|
|
|
|
|
|
Combined Radium |
|
pCi/L |
0 |
5 |
no |
0.2 |
|
|
|
|
|
|
|
Lead and Copper Testing |
|
|
|
|
|
|
|
|
|
|
|
|
|
Lead |
|
ppb |
0 ppb |
AL = 15 |
no |
0 of 5 samples exceeded AL |
|
90th percentile = 2.8 ppb |
|||||
|
|
|
|
|
|
|
|
|
|
|
|
|
|
Copper |
|
ppm |
1.3 ppm |
AL = 1.3 |
no |
0 of 5 samples exceeded AL |
|
90th percentile = 0.0454 ppm |
|||||
|
|
|
|
|
|
|
Disinfectants and Disinfection |
|
|
|
|||
Chlorine |
|
ppm |
|
4 |
no |
n/a |
|
|
|
|
|
|
|
HAA5s |
|
ppb |
0 |
60 |
no |
n/a |
|
|
|
|
|
|
|
TTHMs |
|
ppb |
0 |
80 |
no |
n/a |
|
|
|
|
|
|
|
Unregulated and Secondary Substances |
|
|
|
|||
|
|
|
|
|
|
|
Alkalinity |
|
ppm |
unregulated |
|
n/a |
|
|
|
|
|
|
|
|
Conductivity |
|
μmhos/cm |
unregulated |
|
n/a |
|
|
|
|
|
|
|
|
Hardness (Total) |
|
ppm |
unregulated |
|
n/a |
53 |
|
|
|
|
|
|
|
Iron |
|
ppm |
|
0.3 |
n/a |
ND |
Manganese |
|
ppm |
|
0.05 |
n/a |
0.0011 |
|
|
|
|
|
|
|
Orthophosphate as P |
|
ppm |
unregulated |
|
n/a |
|
pH |
|
pH units |
|
6.5 - 8.5 |
no |
(7.1 - 7.9) 7.6 |
Sodium |
|
ppm |
unregulated |
|
n/a |
61.5 |
Zinc |
|
ppm |
|
5 |
n/a |
ND |
|
|
|
|
|
|
|
Microbiological Substances |
Units |
EPA’s MCLG |
Highest Level Allowed - EPA’s MCL |
Violation |
Level Detected |
|
Total Coliforms |
P/A |
0 |
Presence of coliform bacteria in >5% of monthly samples |
no |
1 |
|
|
|
|
|
|
|
|
E. coli |
P/A |
0 |
A routine and a repeat sample are total coliform positive, and one |
no |
0 |
|
is also fecal coliform or E. coli positive. |
||||||
|
|
|
|
|
34
Striper’s Landing Water System
The Western Virginia Water Authority began operating the Striper’s Landing Water System on October 1, 2019 and assumed ownership on February 21, 2020. The Striper’s Landing Water System is served by five groundwater wells (wells 1, 10,11,12 and 13) and related storage facility. Continuous chlorination treatment is used for disinfection.
The Western Virginia Water Authority is pleased to report that this water meets all requirements, and there were no drinking water violations in calendar year 2020.
The Western Virginia Water Authority has worked with the Virginia Department of Health to determine our water sources susceptibility to contaminants. The assessment is a requirement of the Virginia Department of Health’s (VDH) Source Water Assessment Program (SWAP) in accordance with the 1996 Amendments of the Safe Drinking Water Act. More specific information about these reports may be obtained by contacting the Western Virginia Water Authority’s Water Quality Division at 540.853.5700.
Data collected during calendar year 2020 or most recent testing period.
Data presented as (range) average.
PWSID# 5067937
|
|
|
Ideal Goals |
Highest Level |
|
Striper’s Landing |
Substance |
|
Units |
Allowed |
Violation |
System Data |
|
|
(EPA’s MCLG) |
|||||
|
|
|
(EPA’s MCL) |
|
(range) average |
|
|
|
|
|
|
||
Regulated Substances |
|
|
|
|
|
|
|
|
|
|
|
|
|
Barium |
|
ppm |
2 |
2 |
no |
0.036 |
|
|
|
|
|
|
|
Fluoride |
|
ppm |
4 |
4 |
no |
ND |
|
|
|
|
|
|
|
Total Nitrate & |
|
ppm |
10 |
10 |
no |
1.1 - 1.2 |
Nitrite (as N) |
|
|||||
|
|
|
|
|
|
|
Turbidity |
|
NTU |
TT |
0.3 |
no |
ND |
|
|
|
|
|
|
|
Radioactive Contaminants |
|
|
|
|
||
|
|
|
|
|
|
|
Gross Alpha |
|
pCi/L |
0 |
15 |
no |
3.5 |
|
|
|
|
|
|
|
Gross Beta |
|
pCi/L |
0 |
50 |
no |
13.1 |
|
|
|
|
|
|
|
Radium 226 |
|
pCi/L |
0 |
5 |
no |
1.2 |
|
|
|
|
|
|
|
Radium 228 |
|
pCi/L |
0 |
5 |
no |
1.5 |
|
|
|
|
|
|
|
Combined Radium |
|
pCi/L |
0 |
5 |
no |
2.7 |
|
|
|
|
|
|
|
Lead and Copper |
|
|
|
|
|
|
Testing |
|
|
|
|
|
|
Lead |
|
ppb |
0 ppb |
AL = 15 |
no |
0 of 5 samples exceeded AL |
|
90th percentile = 1.3 ppb |
|||||
|
|
|
|
|
|
|
Copper |
|
ppm |
1.3 ppm |
AL = 1.3 |
no |
0 of 5 samples exceeded AL |
|
90th percentile = 0.06 ppm |
|||||
|
|
|
|
|
|
|
|
|
|
|
|
|
|
Disinfectants and Disinfection |
|
|
|
|||
|
|
|
|
|
|
|
Chlorine |
|
ppm |
|
4 |
no |
(0.57 - 1.12) 0.87 |
|
|
|
|
|
|
|
HAA5s |
|
ppb |
0 |
60 |
no |
10.3 |
|
|
|
|
|
|
|
TTHMs |
|
ppb |
0 |
80 |
no |
1.9 |
|
|
|
|
|
|
|
Unregulated and Secondary Substances |
|
|
|
|||
|
|
|
|
|
|
|
Alkalinity |
ppm |
unregulated |
|
n/a |
56.7 |
|
|
|
|
|
|
|
|
Conductivity |
μmhos/cm |
unregulated |
|
n/a |
180 |
|
|
|
|
|
|
|
|
Hardness (Total) |
ppm |
unregulated |
|
n/a |
66 |
|
|
|
|
|
|
|
|
Iron |
ppm |
|
0.3 |
n/a |
0.078 |
|
Manganese |
ppm |
|
0.05 |
n/a |
0.012 |
|
|
|
|
|
|
|
|
Orthophosphate |
ppm |
unregulated |
|
n/a |
ND |
|
as P |
|
|||||
|
|
|
|
|
||
pH |
pH units |
|
6.5 - 8.5 |
no |
6.8 |
|
Sodium |
ppm |
unregulated |
|
n/a |
6.3 |
|
Zinc |
ppm |
|
5 |
n/a |
0.11 |
|
Franklin
Microbiological Substances |
Units |
EPA’s MCLG |
Highest Level Allowed - EPA’s MCL |
Violation |
Level Detected |
|
Total Coliforms |
P/A |
0 |
Presence of coliform bacteria in >5% of monthly samples |
no |
0 |
|
|
|
|
|
|
|
|
E. coli |
P/A |
0 |
A routine and a repeat sample are total coliform positive, and one is |
no |
0 |
|
also fecal coliform or E. coli positive. |
||||||
|
|
|
|
|
County Systems
35
Timberlake Crossing Water System
The Timberlake Crossing Water System is served by a groundwater well and related storage facility.
Treatment consists of the addition of soda ash, sodium hypochlorite and potassium permanganate for disinfection and removal of iron and manganese.
There is no State or Federal MCL for sodium. Monitoring is required to provide information to consumers and health officials that are concerned about sodium intake due to dietary restrictions. The sodium level in the water was measured at 23.3 ppm in 2018. This is more than the EPA recommended optimal level of less than 20 ppm, established for people on a “strict” sodium intake diet. This elevated level of sodium could be caused by the addition of soda ash for pH adjustment.
The Western Virginia Water Authority is pleased to report that this water meets all requirements and there were no drinking water violations in calendar year 2020.
The Western Virginia Water Authority has worked with the Virginia Department of Health to determine our water sources susceptibility to contaminants. The assessment is a requirement of the Virginia Department of Health’s (VDH) Source Water Assessment Program (SWAP) in accordance with the 1996 Amendments of the Safe Drinking Water Act. More specific information about these reports may be obtained by contacting the Western Virginia Water Authority’s Water Quality Division at 540.853.5700.
Data collected during calendar year 2020 or most recent testing period.
Data presented as (range) average.
PWSID# 5067951
|
|
|
Ideal Goals |
Highest Level |
|
Timberlake Crossing |
Substance |
|
Units |
Allowed |
Violation |
System Data |
|
|
(EPA’s MCLG) |
|||||
|
|
|
(EPA’s MCL) |
|
(range) average |
|
|
|
|
|
|
||
Regulated Substances |
|
|
|
|
|
|
|
|
|
|
|
|
|
Barium |
|
ppm |
2 |
2 |
no |
0.0626 |
|
|
|
|
|
|
|
Fluoride |
|
ppm |
4 |
4 |
no |
0.12 |
|
|
|
|
|
|
|
Total Nitrate & |
|
ppm |
10 |
10 |
no |
ND |
Nitrite (as N) |
|
|||||
|
|
|
|
|
|
|
Turbidity |
|
NTU |
TT |
0.3 |
no |
ND |
|
|
|
|
|
|
|
Radioactive Contaminants |
|
|
|
|
||
|
|
|
|
|
|
|
Gross Alpha |
|
pCi/L |
0 |
15 |
no |
0.44 |
|
|
|
|
|
|
|
Gross Beta |
|
pCi/L |
0 |
50 |
no |
9.2 |
|
|
|
|
|
|
|
Radium 228 |
|
pCi/L |
0 |
5 |
no |
0.05 |
|
|
|
|
|
|
|
Combined Radium |
|
pCi/L |
0 |
5 |
no |
0.49 |
|
|
|
|
|
|
|
Lead and Copper |
|
|
|
|
|
|
Testing |
|
|
|
|
|
|
Lead |
|
ppb |
0 ppb |
AL = 15 |
no |
0 of 5 samples exceeded AL |
|
90th percentile = 5 ppb |
|||||
|
|
|
|
|
|
|
Copper |
|
ppm |
1.3 ppm |
AL = 1.3 |
no |
0 of 5 samples exceeded AL |
|
90th percentile = 0.1 ppm |
|||||
|
|
|
|
|
|
|
Disinfectants and Disinfection |
|
|
|
|||
|
|
|
|
|
|
|
Chlorine |
|
ppm |
|
4 |
no |
(0.69 - 1.19) 0.96 |
|
|
|
|
|
|
|
HAA5s |
|
ppb |
0 |
60 |
no |
2.7 |
|
|
|
|
|
|
|
TTHMs |
|
ppb |
0 |
80 |
no |
7.6 |
|
|
|
|
|
|
|
Unregulated and Secondary Substances |
|
|
|
|||
|
|
|
|
|
|
|
Alkalinity |
|
ppm |
unregulated |
|
n/a |
83.3 |
|
|
|
|
|
|
|
Hardness (Total) |
|
ppm |
unregulated |
|
n/a |
46.6 |
|
|
|
|
|
|
|
Iron |
|
ppm |
|
0.3 |
n/a |
0.013 |
Manganese |
|
ppm |
|
0.05 |
n/a |
0.0021 |
|
|
|
|
|
|
|
Orthophosphate |
|
ppm |
unregulated |
|
n/a |
ND |
as P |
|
|
||||
|
|
|
|
|
|
|
pH |
|
pH units |
|
6.5 - 8.5 |
no |
(7.5 - 7.8) 7.6 |
Sodium |
|
ppm |
unregulated |
|
n/a |
23.3 |
Zinc |
|
ppm |
|
5 |
n/a |
0.048 |
|
|
|
|
|
|
|
Microbiological Substances |
Units |
EPA’s MCLG |
Highest Level Allowed - EPA’s MCL |
Violation |
Level Detected |
|
Total Coliforms |
P/A |
0 |
Presence of coliform bacteria in >5% of monthly samples |
no |
1 |
|
|
|
|
|
|
|
|
E. coli |
P/A |
0 |
A routine and a repeat sample are total coliform positive, and one is |
no |
0 |
|
also fecal coliform or E. coli positive. |
||||||
|
|
|
|
|
36
Walnut Run Water System
Groundwater wells (Wells 1, 2 and 3) provide water for the Walnut Run community. The three drilled wells use sodium hypochlorite and soda ash for chlorine disinfection and pH adjustment.
The Western Virginia Water Authority is pleased to report that this water meets all requirements and there were no drinking water violations in calendar year 2020.
There is no State or Federal MCL for sodium. Monitoring is required to provide information to consumers and health officials that are concerned about sodium intake due to dietary restrictions. The sodium level in the water was measured at 48 ppm in 2020. This is more than the EPA recommended optimal level of less than 20 ppm, established for people on a “strict” sodium intake diet. This elevated level of sodium could be caused by the addition of soda ash for pH adjustment.
A source water assessment for Walnut Run has been conducted by the Virginia Department of Health. Well(s) serving this community were determined to be of high susceptibility to contamination using the criteria developed by the state in its approved Source Water Assessment Program. The assessment report consists of maps showing the source water assessment area, an inventory of known land use activities of concern and documentation of any known contamination within the last five years.
The assessment determined that these wells might be susceptible to contamination because they are located in areas that promote migration of contaminants from land use activities of concern. More specific information about these reports may be obtained by contacting the Western Virginia Water Authority’s Water Quality Division at 540.853.5700.
|
|
|
Ideal Goals |
Highest Level |
|
Walnut Run System Data |
Substance |
|
Units |
Allowed |
Violation |
||
|
(EPA’s MCLG) |
(range) average |
||||
|
|
|
(EPA’s MCL) |
|
||
|
|
|
|
|
|
|
Regulated Substances |
|
|
|
|
|
|
|
|
|
|
|
|
|
Barium |
|
ppm |
2 |
2 |
no |
0.05 |
|
|
|
|
|
|
|
Fluoride |
|
ppm |
4 |
4 |
no |
0.06 |
|
|
|
|
|
|
|
Total Nitrate & |
|
ppm |
10 |
10 |
no |
ND |
Nitrite (as N) |
|
|||||
|
|
|
|
|
|
|
Turbidity |
|
NTU |
TT |
0.3 |
no |
ND |
|
|
|
|
|
|
|
Radioactive Contaminants |
|
|
|
|
||
|
|
|
|
|
|
|
Gross Alpha |
|
pCi/L |
0 |
15 |
no |
2.1 |
|
|
|
|
|
|
|
Gross Beta |
|
pCi/L |
0 |
50 |
no |
7.1 |
|
|
|
|
|
|
|
Radium 228 |
|
pCi/L |
0 |
5 |
no |
1 |
|
|
|
|
|
|
|
Combined Radium |
|
pCi/L |
0 |
5 |
no |
3.1 |
|
|
|
|
|
|
|
Lead and Copper |
|
|
|
|
|
|
Testing |
|
|
|
|
|
|
Lead |
|
ppb |
0 ppb |
AL = 15 |
no |
0 of 6 samples exceeded AL |
|
90th percentile = 1.6 ppb |
|||||
|
|
|
|
|
|
|
Copper |
|
ppm |
1.3 ppm |
AL = 1.3 |
no |
0 of 6 samples exceeded AL |
|
90th percentile = 0.227 ppm |
|||||
|
|
|
|
|
|
|
Disinfectants and Disinfection |
|
|
|
|||
|
|
|
|
|
|
|
Chlorine |
|
ppm |
|
4 |
no |
(0.73 - 1.24) 0.9 |
|
|
|
|
|
|
|
HAA5s |
|
ppb |
0 |
60 |
no |
3.39 |
|
|
|
|
|
|
|
TTHMs |
|
ppb |
0 |
80 |
no |
12.4 |
|
|
|
|
|
|
|
Unregulated and Secondary Substances |
|
|
|
|||
|
|
|
|
|
|
|
Alkalinity |
|
ppm |
unregulated |
|
n/a |
133 |
|
|
|
|
|
|
|
Conductivity |
|
μmhos/cm |
unregulated |
|
n/a |
358 |
|
|
|
|
|
|
|
Hardness (Total) |
|
ppm |
unregulated |
|
n/a |
146 |
|
|
|
|
|
|
|
Iron |
|
ppm |
|
0.3 |
n/a |
0.17 |
Manganese |
|
ppm |
|
0.05 |
n/a |
0.0098 |
|
|
|
|
|
|
|
Orthophosphate |
|
ppm |
unregulated |
|
n/a |
ND |
as P |
|
|
||||
|
|
|
|
|
|
|
pH |
|
pH units |
|
6.5 - 8.5 |
no |
(7.6 - 7.9) 7.6 |
Sodium |
|
ppm |
unregulated |
|
n/a |
48 |
Zinc |
|
ppm |
|
5 |
n/a |
0.14 |
|
|
|
|
|
|
|
Data collected during calendar year 2020 or most recent testing period. Data presented as (range) average. PWSID# 5067957
Franklin County
Microbiological Substances |
Units |
EPA’s MCLG |
Highest Level Allowed - EPA’s MCL |
Violation |
Level Detected |
|
Total Coliforms |
P/A |
0 |
Presence of coliform bacteria in >5% of monthly samples |
no |
0 |
|
|
|
|
|
|
|
|
E. coli |
P/A |
0 |
A routine and a repeat sample are total coliform positive, and one |
no |
0 |
|
is also fecal coliform or E. coli positive. |
||||||
|
|
|
|
|
Systems
37

Water’s Edge Water System
Customers who live in The Water’s Edge community get their drinking water from four groundwater wells (Well No. 3, 4, 11 and 12) that are located throughout the Water’s Edge subdivision. Water from well 4 and 11 go to the treatment plant where three greensand filters are used to remove iron, manganese and radium from the drinking water. An orthophosphate feed system for corrosion control and a sodium hydroxide feed system for pH adjustment has been added at the treatment plant and Well 12. Well 12 is also disinfected with chlorine. No treatment is added to Well No. 3.
There is no State or Federal MCL for sodium. Monitoring is required to provide information to consumers and health officials that are concerned about sodium intake due to dietary restrictions. The sodium level in the water for entry point EP001 (32.1 ppm) and in Well 12, (24.8 pppm) was measured in 2018. This is more than the EPA recommended optimal level of less than 20 ppm, established for people on a “strict” sodium intake diet. This elevated level of sodium could be caused by the sodium hydroxide added to the water for pH adjustment.
A source water assessment for The Water’s Edge has been conducted by the Virginia Department of Health. Well(s) serving this community were determined to be of high susceptibility to contamination using the criteria developed by the state in its approved Source Water Assessment Program. The assessment report consists of maps showing the source water assessment area, an inventory of known land use activities of concern and documentation of any known contamination within the last five years. The assessment determined that these wells might be susceptible to contamination because they are located in areas that promote migration of contaminants from land use activities of concern. More specific information about these reports may be obtained by contacting the Western Virginia Water Authority’s Water Quality Division at 540.853.5700.
|
|
|
Ideal Goals |
Highest Level |
|
Water’s Edge System Data |
Substance |
|
Units |
Allowed |
Violation |
||
|
(EPA’s MCLG) |
(range) average |
||||
|
|
|
(EPA’s MCL) |
|
||
|
|
|
|
|
|
|
Regulated Substances |
|
|
|
|
|
|
|
|
|
|
|
|
|
Barium |
|
ppm |
2 |
2 |
no |
(0.004 - 0.08) 0.04 |
|
|
|
|
|
|
|
Fluoride |
|
ppm |
4 |
4 |
no |
(ND - 0.10) 0.05 |
|
|
|
|
|
|
|
Selenium |
|
ppm |
0.05 |
0.05 |
no |
(ND - 0.0035) 0.0012 |
|
|
|
|
|
|
|
Total Nitrate & |
|
ppm |
10 |
10 |
no |
(ND - 0.8) 0.32 |
Nitrite (as N) |
|
|||||
|
|
|
|
|
|
|
Turbidity |
|
NTU |
TT |
0.3 |
no |
(ND - 0.8) 0.14 |
|
|
|
|
|
|
|
Radioactive Contaminants |
|
|
|
|
||
|
|
|
|
|
|
|
Gross Alpha |
|
pCi/L |
0 |
15 |
no |
|
|
|
|
|
|
|
|
Gross Beta |
|
pCi/L |
0 |
50 |
no |
(2.3 |
|
|
|
|
|
|
|
Radium 228 |
|
pCi/L |
0 |
5 |
no |
(1.4 - 1.9) 1.65 |
|
|
|
|
|
|
|
Combined |
|
pCi/L |
0 |
5 |
no |
(4.9 - 0.94) 2.92 |
Radium |
|
|||||
|
|
|
|
|
|
|
Lead and Copper |
|
|
|
|
|
|
Testing |
|
|
|
|
|
|
Lead |
|
ppb |
0 ppb |
AL = 15 |
no |
0 of 20 samples exceeded AL |
|
90th percentile = 0.94 ppb |
|||||
|
|
|
|
|
|
|
Copper |
|
ppm |
1.3 ppm |
AL = 1.3 |
no |
0 of 20 samples exceeded AL |
|
90th percentile = 0.293 ppm |
|||||
|
|
|
|
|
|
|
Disinfectants and Disinfection |
|
|
|
|||
|
|
|
|
|
|
|
Chlorine |
|
ppm |
|
4 |
no |
(0.46 - 1.67) 1.04 |
|
|
|
|
|
|
|
HAA5s |
|
ppb |
0 |
60 |
no |
ND |
|
|
|
|
|
|
|
TTHMs |
|
ppb |
0 |
80 |
no |
2.7 |
|
|
|
|
|
|
|
Unregulated and Secondary Substances |
|
|
|
|||
|
|
|
|
|
|
|
Alkalinity |
|
ppm |
unregulated |
|
n/a |
(69.3 - 200) 134 |
|
|
|
|
|
|
|
Hardness (Total) |
|
ppm |
unregulated |
|
n/a |
(25.3 - 130) 92 |
|
|
|
|
|
|
|
Iron |
|
ppm |
|
0.3 |
n/a |
(ND - 0.024) 0.003 |
Manganese |
|
ppm |
|
0.05 |
n/a |
(ND - 0.12) 0.004 |
|
|
|
|
|
|
|
Orthophosphate |
|
ppm |
unregulated |
|
n/a |
(ND- 0.35) 0.2 |
as P |
|
|
||||
|
|
|
|
|
|
|
pH |
|
pH units |
|
6.5 - 8.5 |
no |
(7.1 |
Sodium |
|
ppm |
unregulated |
|
n/a |
(11.0 - 32.1) 22.6 |
Zinc |
|
ppm |
|
5 |
n/a |
(ND - 0.14) 0.07 |
|
|
|
|
|
|
|
Data collected during calendar year 2020 or most recent testing period. Data presented as (range) average. PWSID# 5067961
Microbiological Substances |
Units |
EPA’s MCLG |
Highest Level Allowed - EPA’s MCL |
Violation |
Level Detected |
|
Total Coliforms |
P/A |
0 |
Presence of coliform bacteria in >5% of monthly samples |
no |
0 |
|
|
|
|
|
|
|
|
E. coli |
P/A |
0 |
A routine and a repeat sample are total coliform positive, and one is |
no |
0 |
|
also fecal coliform or E. coli positive. |
||||||
|
|
|
|
|
38
Weatherwood Water System
Prior to being connected to the Westlake Water System (see pages
Manganese levels (1.7 ppm) and Iron levels (0.41) are above the EPA’s recommended secondary maximum contaminant levels SMCLs) of 0.05 ppm for Manganese and 0.3 for Iron. There are currently no known adverse health effects associated with the presence of manganese or iron at these levels; however, it can result in aesthetic problems such as staining or discoloration of clothes and fixtures, as well as the taste impairment of beverages made with the water.
There is no State or Federal MCL for sodium. Monitoring is required to provide information to consumers and health officials that are concerned about sodium intake due to dietary restrictions. The sodium level in the water was measured at 82 ppm in 2020. This is more than the EPA recommended optimal level of less than 20 ppm, established for people on a “strict” sodium intake diet. This elevated level of sodium could be caused by the addition of soda ash for pH adjustment.
A source water assessment for the Weatherwood system has been conducted by the Virginia Department of Health. Well(s) serving this community were determined to be of high susceptibility to contamination using the criteria developed by the state in its approved Source Water Assessment Program. The assessment report consists of maps showing the source water assessment area, an inventory of known land use activities of concern and documentation of any known contamination within the last five years. The assessment determined that these wells might be susceptible to contamination because they are located in areas that promote migration of contaminants from land use activities of concern. More specific information about these reports may be obtained by contacting the Authority’s Water Quality Division at 540.853.5700.
|
|
Ideal Goals |
Highest |
|
|
|
|
|
Level |
|
Weatherwood System Data |
||
Substance |
Units |
(EPA’s |
Violation |
|||
Allowed |
(range) average |
|||||
|
|
MCLG) |
|
|||
|
|
(EPA’s MCL) |
|
|
||
|
|
|
|
|
||
Regulated Substances |
|
|
|
|
||
|
|
|
|
|
|
|
Barium |
ppm |
2 |
2 |
no |
0.036 |
|
|
|
|
|
|
|
|
Fluoride |
ppm |
4 |
4 |
no |
0.2 |
|
|
|
|
|
|
|
|
Total Nitrate & |
ppm |
10 |
10 |
no |
ND |
|
Nitrite (as N) |
||||||
|
|
|
|
|
||
Turbidity |
NTU |
TT |
0.3 |
no |
ND |
|
|
|
|
|
|
|
|
Radioactive Contaminants |
|
|
|
|
||
|
|
|
|
|
|
|
Gross Alpha |
pCi/L |
0 |
15 |
no |
3.5 |
|
|
|
|
|
|
|
|
Gross Beta |
pCi/L |
0 |
50 |
no |
3.4 |
|
|
|
|
|
|
|
|
Radium 226 |
pCi/L |
0 |
5 |
no |
0.69 |
|
|
|
|
|
|
|
|
Radium 228 |
pCi/L |
0 |
5 |
no |
0.94 |
|
|
|
|
|
|
|
|
Combined |
pCi/L |
0 |
5 |
no |
1.63 |
|
Radium |
||||||
|
|
|
|
|
||
Lead and Copper Testing |
|
|
|
|
||
|
|
|
|
|
|
|
Lead |
ppb |
0 ppb |
AL = 15 |
no |
0 of 5 samples exceeded AL |
|
90th percentile = 8 ppb |
||||||
|
|
|
|
|
||
Copper |
ppm |
1.3 ppm |
AL = 1.3 |
no |
0 of 5 samples exceeded AL |
|
90th percentile = 0.21 ppm |
||||||
|
|
|
|
|
||
Disinfectants and Disinfection |
|
|
|
|||
|
|
|
|
|
|
|
Chlorine |
ppm |
|
4 |
no |
(0.38 - 0.45) 0.42 |
|
|
|
|
|
|
|
|
HAA5s |
ppb |
0 |
60 |
no |
6.09 |
|
|
|
|
|
|
|
|
TTHMs |
ppb |
0 |
80 |
no |
15.8 |
|
|
|
|
|
|
|
|
Unregulated and Secondary Substances |
|
|
|
|||
|
|
|
|
|
|
|
Alkalinity |
ppm |
unregulated |
|
n/a |
242 |
|
|
|
|
|
|
|
|
Conductivity |
μmhos/ |
unregulated |
|
n/a |
520 |
|
cm |
|
|||||
|
|
|
|
|
||
Hardness (Total) |
ppm |
unregulated |
|
n/a |
86 |
|
|
|
|
|
|
|
|
Iron |
ppm |
|
0.3 |
n/a |
0.41 |
|
Manganese |
ppm |
|
0.05 |
n/a |
1.7 |
|
|
|
|
|
|
|
|
Orthophosphate |
ppm |
unregulated |
|
n/a |
ND |
|
as P |
|
|||||
|
|
|
|
|
||
pH |
pH units |
|
6.5 - 8.5 |
no |
(7.7 - 7.8) 7.8 |
|
Sodium |
ppm |
unregulated |
|
n/a |
82 |
|
Zinc |
ppm |
|
5 |
n/a |
0.85 |
|
|
|
|
|
|
|
|
Data collected during calendar year 2020 or most recent testing period. Data presented as (range) average. PWSID# 5067959
Franklin County
Microbiological Substances |
Units |
EPA’s MCLG |
Highest Level Allowed - EPA’s MCL |
Violation |
Level Detected |
|
Total Coliforms |
P/A |
0 |
Presence of coliform bacteria in >5% of monthly samples |
no |
0 |
|
|
|
|
|
|
|
|
E. coli |
P/A |
0 |
A routine and a repeat sample are total coliform positive, and one |
no |
0 |
|
is also fecal coliform or E. coli positive. |
||||||
|
|
|
|
|
39
Systems

Use Your Water Wisely
Using water wisely in times of drought is critical; however, it is always important to use our natural resource wisely.
Fix leaks in faucets, toilet tanks and outside spigots. Check for a toilet leak by putting some food coloring in your toilet tank. The next morning, if any of the color shows up in the bowl without flushing, you have a leak. A leaky toilet can waste up to 200 gallons of water per day.
In the laundry or kitchen, use full loads in your washing machine and dishwasher to maximize efficiency.
Don’t overwater your lawn. If you water your lawn, it only needs 1 to 1.5 inches of water every week or two. Water outside before 10 AM or after 7 PM when temperatures are cooler to minimize evaporation.
While brushing your teeth, turn off the water and save two gallons of water.
Shorten your shower to five minutes to save water.
Have a leak? Fix it and let us know right away. If your meter records a continuous high flow of consumption, we’ll notify you about a potential leak.
How to Check for a Toilet Leak
Toilets are the number one source of water leaks inside the home so this is the best place to start a leak detection. Because a toilet leak can waste up to 200 gallons of water per day, it is important to regularly test your toilets and quickly repair any leaks you discover.
To determine if a toilet is leaking, place some dye such as food coloring,
If you discover that you have a toilet leak, make sure the lift chain is free of kinks and that you don’t have any mineral buildup around your valves that might prevent them from sealing properly. You can also use the adjustment screw on the overflow pipe to lower the water level in the tank to keep it from flowing into the overflow pipe. Most overflow pipes have a line on the pipe that indicates where the water level needs to be. If the flapper valve or plunger ball isn’t properly sealing at the bottom of the toilet, you will also get leaks. Parts are available at your local hardware store to replace these items.
Learn More
Classroom Presentations
The Authority’s outreach staff is pleased to offer free Standards of Learning (SOL) correlated lessons to students in our service area. During a typical school year, around 11,000 students participate in our outreach programs. These
Guest Speakers
Interested in having a speaker talk to your civic league or community group? We’d be happy to talk to your group about your water source, how we treat your water and improvements we are making to the water and wastewater infrastructure. Contact us at info@westernvawater. org for scheduling and information.
Tours
Tours of our treatment facilities and reservoirs are offered to our customers, students, civic, community groups or other groups of ten or more. You will be amazed to learn what goes on behind the faucet as we treat and deliver the highest quality drinking water to our customers. We’d love to show you how we treat your water. To request a visit, please call 853.5700 or email education@westernvawater.org
Videos
Learn about our water and wastewater treatment processes or explore the science of water without ever leaving your classroom or home. The Water Authority has a collection of videos on our YouTube channel to teach, inspire and amaze. Visit the Western Virginia Water Authority YouTube channel to start exploring.
Dam Inundation Information
The Western Virginia Water Authority utilizes four surface water sources in the Roanoke Valley - Carvins Cove, Spring Hollow, Beaverdam Creek and Falling Creek Reservoirs. Each of these bodies of water is impounded by a dam which is physically inspected annually.
The Western Virginia Water Authority has published this information to inform customers in the unlikely event of a catastrophic dam failure. If this should occur, or if conditions should occur that would increase the likelihood of such an event occurring, the public would be notified through all major media outlets and local emergency centers.
To learn more about the risk of flooding to your property, and to learn how you can protect yourself, please visit the FloodSafe.gov website.
If you have specific questions about the Western Virginia Water Authority dam inundation information or to see if you property is located in an inundation zone, please see www.westernvawater.org/
www.westernvawater.org | info@westernvawater.org
540.853.5700
Connect with us:
Contaminants
Western Virginia Water Authority
EWG's drinking water quality report shows results of tests conducted by the water utility and provided to the Environmental Working Group by the Virginia Department of Health - Office of Drinking Water, as well as information from the U.S. EPA Enforcement and Compliance History database (ECHO). For the latest quarter assessed by the U.S. EPA (January 2019 - March 2019), tap water provided by this water utility was in compliance with federal health-based drinking water standards.
Utility details
- Serves: 155000
- Data available: 2012-2017
- Data Source: Surface water
- Total: 29
Contaminants That Exceed Guidelines
- Arsenic
- Chromium (hexavalent)
- Nitrate and nitrite
- Radium%2C combined (-226 & -228)
- Total trihalomethanes (TTHMs)
Other Detected Contaminants
- 1%2C4-Dioxane
- Aluminum
- Antimony
- Barium
- Benzene
- Beryllium
- Cadmium
- Carbon tetrachloride
- Chlorate
- Chlorite
- Chlorodifluoromethane
- Chromium (total)
- Cobalt
- Ethylbenzene
- Fluoride
- Haloacetic acids (HAA5)
- Manganese
- Molybdenum
- Silver
- Strontium
- Thallium
- Toluene
- Vanadium
- Xylenes (total)
Reminder
Always take extra precautions, the water may be safe to drink when it leaves the sewage treatment plant but it may pick up pollutants during its way to your tap. We advise that you ask locals or hotel staff about the water quality. Also, note that different cities have different water mineral contents.