Table of Contents
Can You Drink Tap Water in Greenwood?
Yes, Greenwood's tap water is generally considered safe to drink as Greenwood has no active health based violations of the Safe Drinking Water Act (SDWA) that we are aware of. Other factors such as lead piping in a home, or low levels of pollutants on immunocompromised individuals, should also be considered, however. To find more recent info we might have, you can check out our boil water notice page, the city's water provider website, or Greenwood's local Twitter account.
According the EPA’s ECHO database, from April 30, 2019 to June 30, 2022, Greenwood's water utility, Indiana American Water - Johnson County, had 0 violations of the Safe Drinking Water Act. For more details on the violations, please see our violation history section below. This assessment is based on the Indiana American Water - Johnson County water system, other water systems in the city may have different results.
While tap water that meets the EPA health guidelines generally won’t make you sick to your stomach, it can still contain regulated and unregulated contaminants present in trace amounts that could potentially cause health issues over the long-run. These trace contaminants may also impact immunocompromised and vulnerable individuals.
The EPA is reviewing if it’s current regulations around pollutant levels in tap water are strict enough, and the health dangers posed by unregulated pollutants, like PFAS.
Water Quality Report for Greenwood Tap Water
The most recent publicly available numbers for measured contaminant levels in Greenwood tap water are in its 2020 Water Quality Report. As you can see, there are levels which the EPA considers to be acceptable, but being below the maximum allowable level doesn’t necessarily mean the water is healthy.
Lead in tap water, for example, is currently allowed at up to 15ppb by the EPA, but it has set the ideal goal for lead at zero. This highlights how meeting EPA standards doesn’t necessarily mean local tap water is healthy.
EPA regulations continue to change as it evaluates the long term impacts of chemicals and updates drinking water acceptable levels. The rules around arsenic, as well as, lead and copper are currently being re-evaluated.
There are also a number of "emerging" contaminants that are not currently. For example, PFAS (Per- and polyfluoroalkyl substances), for which the EPA has issued a health advisory. PFAS are called "forever chemicals" since they tend not to break down in the environment or the human body and can accumulate over time.
We recommend looking at the contaminants present in Greenwood's water quality reports, or getting your home's tap water tested to see if you should be filtering your water.
Greenwood Tap Water Safe Drinking Water Act Violation History - Prior 10 Years
Below is a ten year history of violations for the water system named Indiana American Water - Johnson County for Greenwood in Indiana. For more details please see the "What do these Violations Mean?" section below.
Is there Lead in Greenwood Water?
Based on the EPA’s ECHO Database, 90% of the samples taken from the Greenwood water system, Indiana American Water - Johnson County, between sample start date and sample end date, were at or below, 0.002 mg/L of lead in Greenwood water. This is 13.3% of the 0.015 mg/L action level. This means 10% of the samples taken from Greenwood contained more lead.
While Greenwood water testing may have found 0.002 mg/L of lead in its water, that does not mean your water source has the same amount. The amount of lead in water in a city can vary greatly from neighborhood to neighborhood, or even building to building. Many buildings, particularly older ones, have lead pipes or service lines which can be a source of contamination. To find out if your home has lead, we recommend getting you water tested.
No amount of lead in water is healthy, only less dangerous. As lead accumulates in our bodies over time, even exposure to relatively small amounts can have negative health effects. For more information, please check out our Lead FAQ page.
Are there PFAS in Greenwood Tap Water?
Currently, testing tap water for PFAS isn’t mandated on a national level. We do have a list of military bases where there have been suspected or confirmed leaks. There appears to be at least one military base - Indianapolis - near Greenwood with suspected leaks.
With many potential sources of PFAS in tap water across the US, the best information we currently have about which cities have PFAS in their water is this ewg map, which you can check to see if Greenwood has been evaluated for yet.
Our stance is better safe than sorry, and that it makes sense to try to purify the tap water just in case.
What do these Violations Mean?
Safe Drinking Water Act Violations categories split into two groups, health based, and non-health based. Generally, health based violations are more serious, though non-health based violations can also be cause for concern.
Health Based Violations
- Maximum contaminant levels (MCLs) - maximum allowed contaminant level was exceeded.
- Maximum residual disinfectant levels (MRDLs) - maximum allowed disinfectant level was exceeded.
- Other violations (Other) - the exact required process to reduce the amounts of contaminants in drinking water was not followed.
Non-Health Based Violations
- Monitoring and reporting violations (MR, MON) - failure to conduct the required regular monitoring of drinking water quality, and/or to submit monitoring results on time.
- Public notice violations (Other) - failure to immediately alert consumers if there is a serious problem with their drinking water that may pose a risk to public health.
- Other violations (Other) - miscellaneous violations, such as failure to issue annual consumer confidence reports or maintain required records.
SDWA Table Key
| Field | Description |
|---|---|
| Compliance Period | Dates of the compliance period. |
| Status |
Current status of the violation.
|
| Health-Based? | Whether the violation is health based. |
| Category Code |
The category of violation that is reported.
|
| Code | A full description of violation codes can be accessed in the SDWA_REF_CODE_VALUES (CSV) table. |
| Contaminant Code | A code value that represents a contaminant for which a public water system has incurred a violation of a primary drinking water regulation. |
| Rule Code |
Code for a National Drinking Water rule.
|
| Rule Group Code |
Code that uniquely identifies a rule group.
|
| Rule Family Code |
Code for rule family.
|
For more clarification please visit the EPA's data dictionary.
Greenwood Water - Frequently Asked Questions
| By Mail: | 153 North Emerson Avenue GREENWOOD, IN, 46143 |
Existing customers can login to their Indiana American Water - Johnson County account to pay their Greenwood water bill by clicking here.
If you want to pay your Indiana American Water - Johnson County bill online and haven't made an account yet, you can create an account online. Please click here to create your account to pay your Greenwood water bill.
If you don't want to make an account, or can't remember your account, you can make a one-time payment towards your Greenwood water bill without creating an account using a one time payment portal with your account number and credit or debit card. Click here to make a one time payment.
Moving to a new house or apartment in Greenwood means you will often need to put the water in your name with Indiana American Water - Johnson County. In order to put the water in your name, please click the link to the start service form below. Start service requests for water bills typically take two business days.
Leaving your house or apartment in Greenwood means you will likely need to take your name off of the water bill with Indiana American Water - Johnson County. In order to take your name off the water bill, please click the link to the stop service form below. Stop service for water bills requests typically take two business days.
USER SUBMITTED RATINGS
- Drinking Water Pollution and Inaccessibility
- Water Pollution
- Drinking Water Quality and Accessibility
- Water Quality
The above data is comprised of subjective, user submitted opinions about the water quality and pollution in Greenwood, measured on a scale from 0% (lowest) to 100% (highest).
Related FAQS
Greenwood Water Quality Report (Consumer Confidence Report)
The EPA mandates that towns and cities consistently monitor and test their tap water. They must report their findings in an annual Consumer Confidence Report. Below is the most recent water quality report from Greenwood's Water. If you would like to see the original version of the report, please click here.
2020 Annual
Johnson County Operations
PWS ID: IN5241005

- message from Indiana American Water’s President
Matt Prine
President, Indiana American Water
.
Dear Indiana American Water Customer,
Indiana American Water is proud to be your local water company. Every day, our lives revolve around water. It’s involved in everything we do and everything we use. It is our most precious resource. That’s why it’s important that we provide you with information about our
commitment to providing quality water service at a cost of only about a penny a gallon.
At Indiana American Water, we take great pride in what we do and hold ourselves to high standards in delivering safe, clean, reliable, and affordable drinking water to the people we serve. Our teams consist of
Just as important, we place a strong focus on acting as stewards of our environment. In Indiana, we participate in activities that help communities protect their watershedsand educate customers on how to use water wisely. We are committed to acting sustainably by reducing our greenhouse gas emissions, recycling our precious resources, including water, and protecting the biodiversity of local waterways. You can learn more about these ideas and programs on our website at www.indianaamwater.com.
- am proud to share with you the 2020 annual water quality report with detailed information about the source and quality of your drinking water. We have prepared this report using data from water quality testing conductedfor your local water system through December 2020.
When it comes to complying with strict federal regulations for delivering safe, quality drinking water, we have consistently scoredamong the highest of all water companies. As a subsidiary of American Water, we’re part of a
If you would like more information regarding our commitment to water quality, visit our
website at
We look forward to serving you throughout 2021.
Matt Prine
Indiana American Water
This report contains important information about your drinking water. Translate it or speak with someone who understands it at
-
492-8373,
Monday-Friday, 7 a.m. to 7 p.m.
2
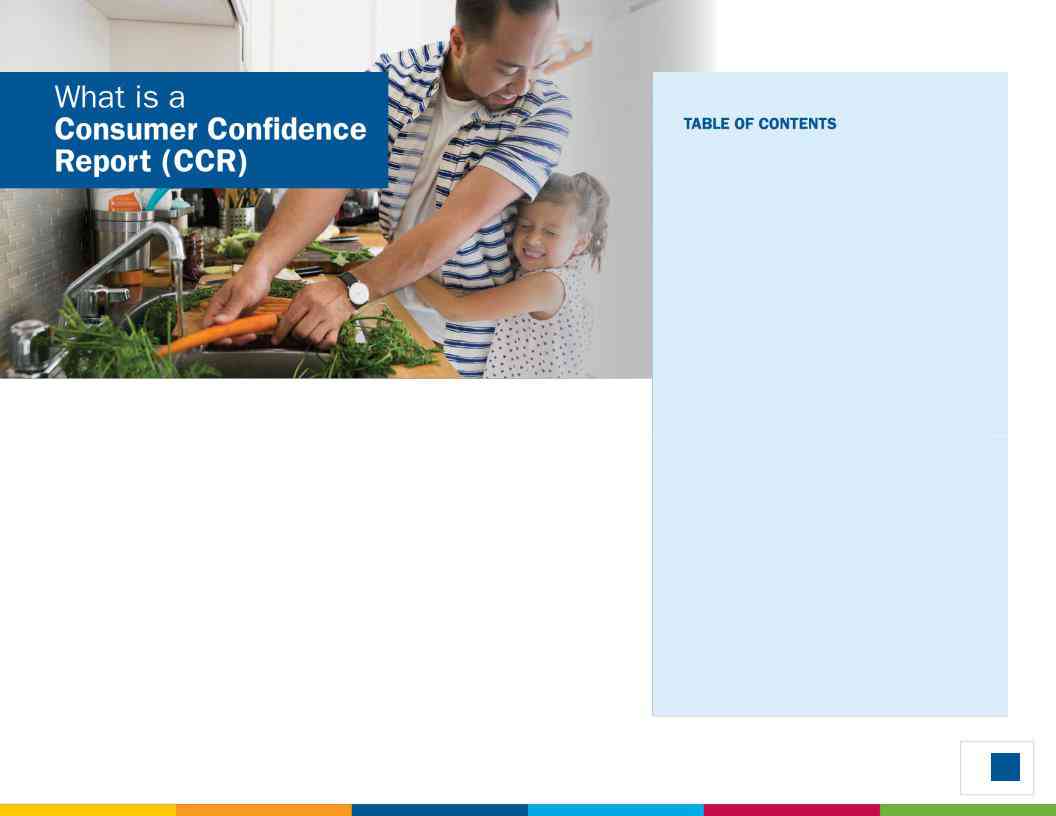
Once again, we proudly present our Annual Water Quality Report, also referredto as a Consumer Confidence Report (CCR). CCRs let consumers know what contaminants, if any, were detected in their drinking water as well as related potential health effects. CCRs also include details about where your water comes from and how it is treated. Additionally, they educate customers on what it takes to deliver safe drinking water and highlight the need to protect drinking water sources.
Indiana American Water is committed to delivering high quality drinking water service. To that end, we remain vigilant in meeting the challenges of source water protection, water conservation, environmental compliance, sustainability and community educationwhile continuing to serve the needs of all our water users.
A message from our President |
2 |
|
What is a Consumer Confidence Report |
3 |
|
Mark of Excellence |
4 |
|
About Your Drinking Water Supply |
5 |
|
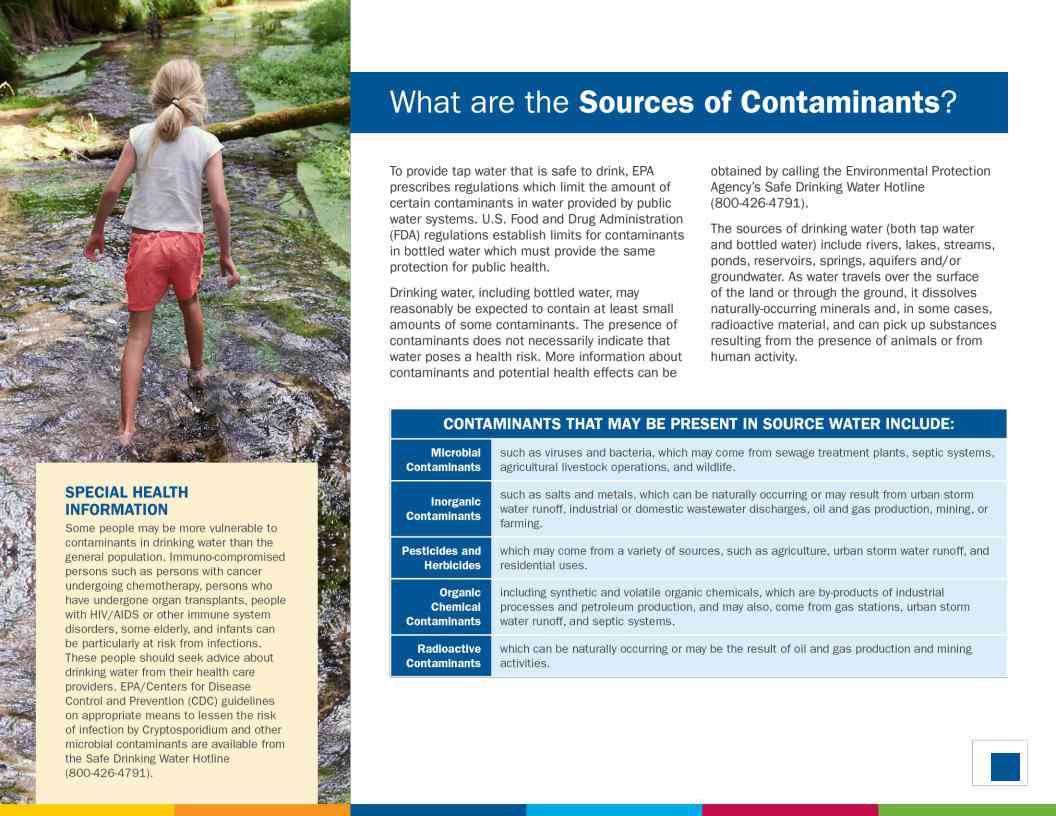
What are the Sources of Contaminants? |
6 |
|
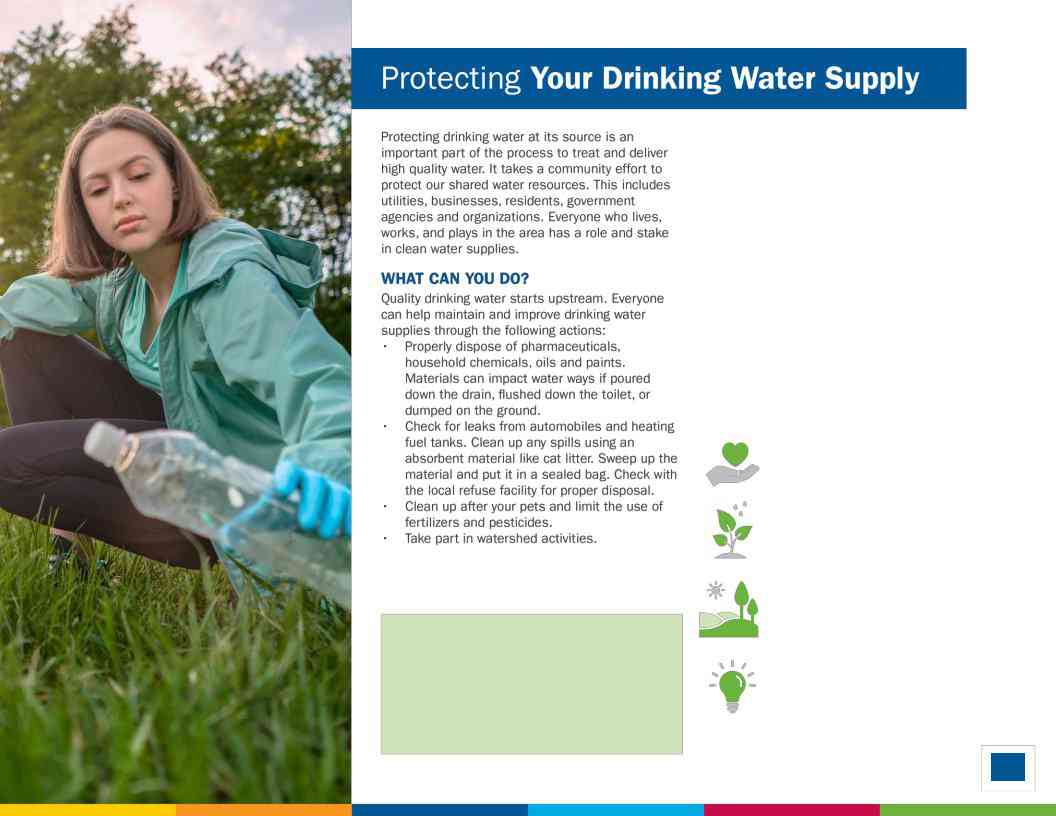
Protecting Your Drinking Water Supply |
7 |
|
About Lead |
8 |
|
Important Information About Your Water |
||
• |
Nitrates |
|
• |
UCMR |
|
• |
PFAS |
|
Water Quality Results |
11 |
|
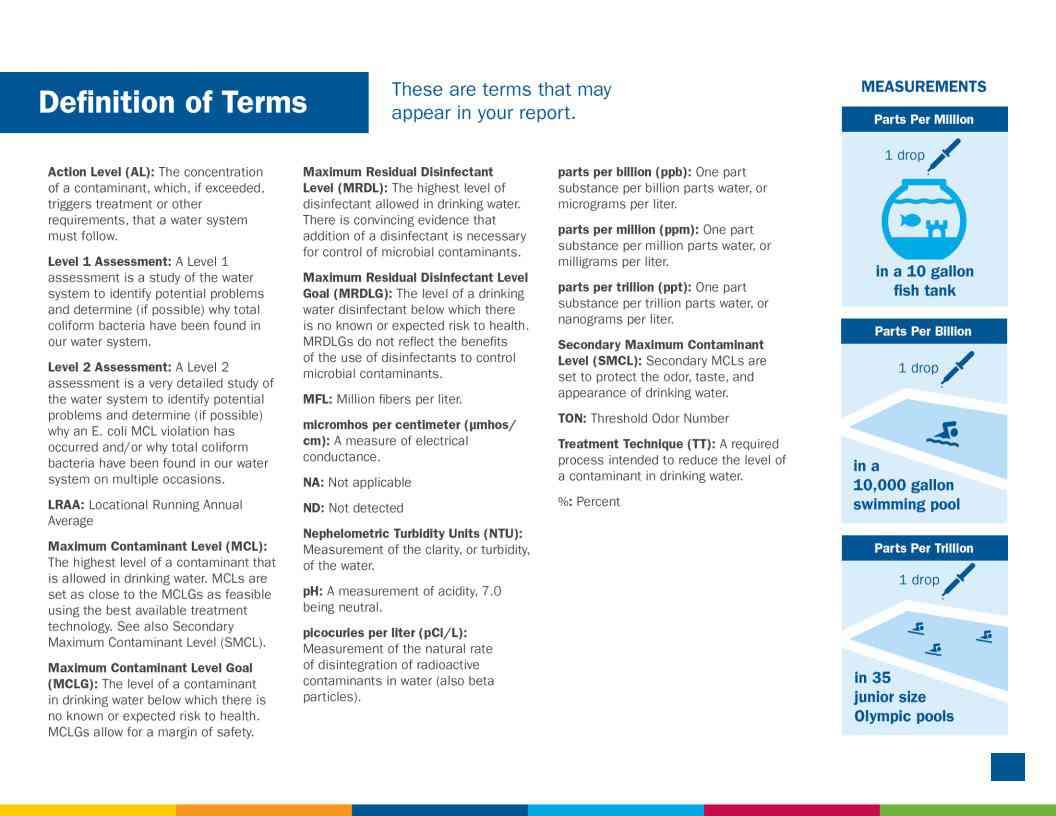
Definitions of Terms Used in Document |
12 |
|
Water Quality Results: Detailed Charts |
||
About Us |
18 |
|
Contact Us |
19 |
|
3
Just as Indiana American Water is investing in research and testing, we also understand the importance of investing in the infrastructure that provides
invested more than $121million to improve our water and wastewater treatment and pipeline systems.
4
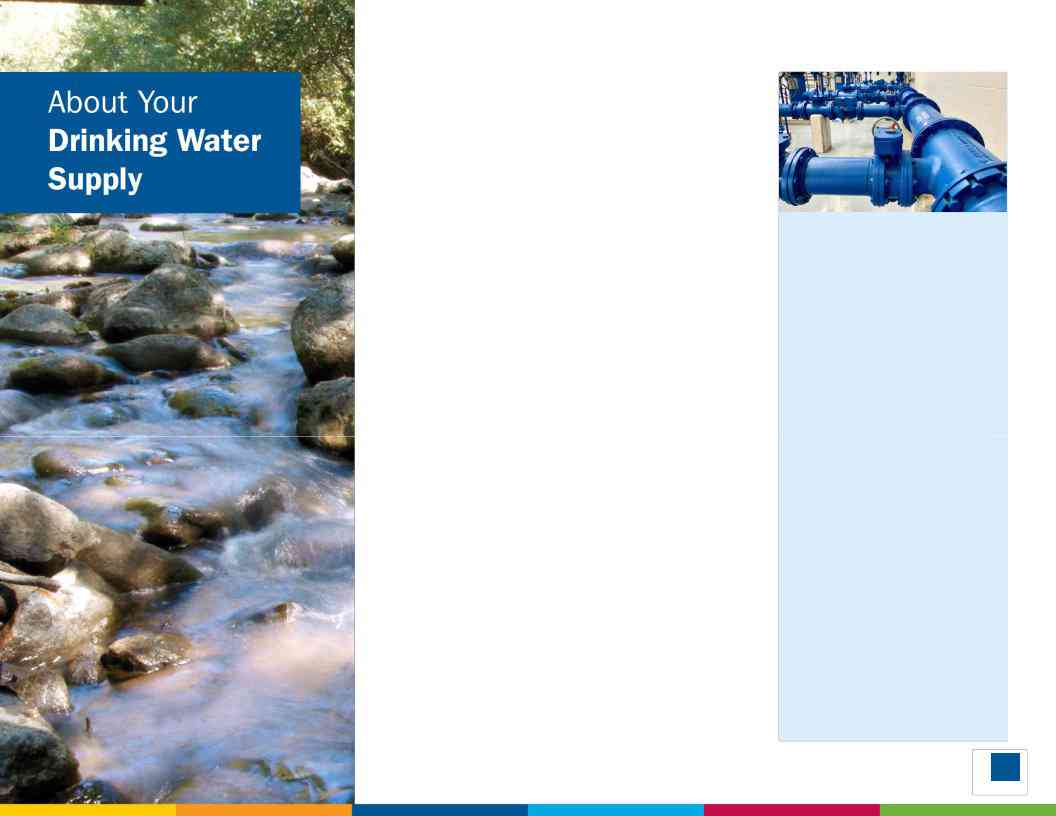
WHERE YOUR WATER COMES FROM
The raw drinking water supply is groundwater obtained from 20 wells in six well fields.
The Indiana Department of Environmental Management (IDEM) has assessed all public surface and groundwater sources throughout the state to identify potential contaminants. The Indiana American
QUICK FACTS ABOUT THE JOHNSON COUNTY OPERATIONS WATER SYSTEM
Communities served:
Greenwood, Franklin, New
Whiteland, Boggstown,
Shelbyville
Water source:
20 groundwater wells
Average amount of water supplied to customers on a daily basis:
8.9 million gallons per day
Disinfection treatment: The groundwater supplies are treated with chlorine to maintain water quality in the distribution system.
5
6
Report any spills, illegal dumping or suspicious activity to the Indiana Department of Environmental Management at
FOR MORE INFORMATION
To learn more about your water supply and local activities, visit us online at indianaamwater.com or contact our
Customer Service Center at
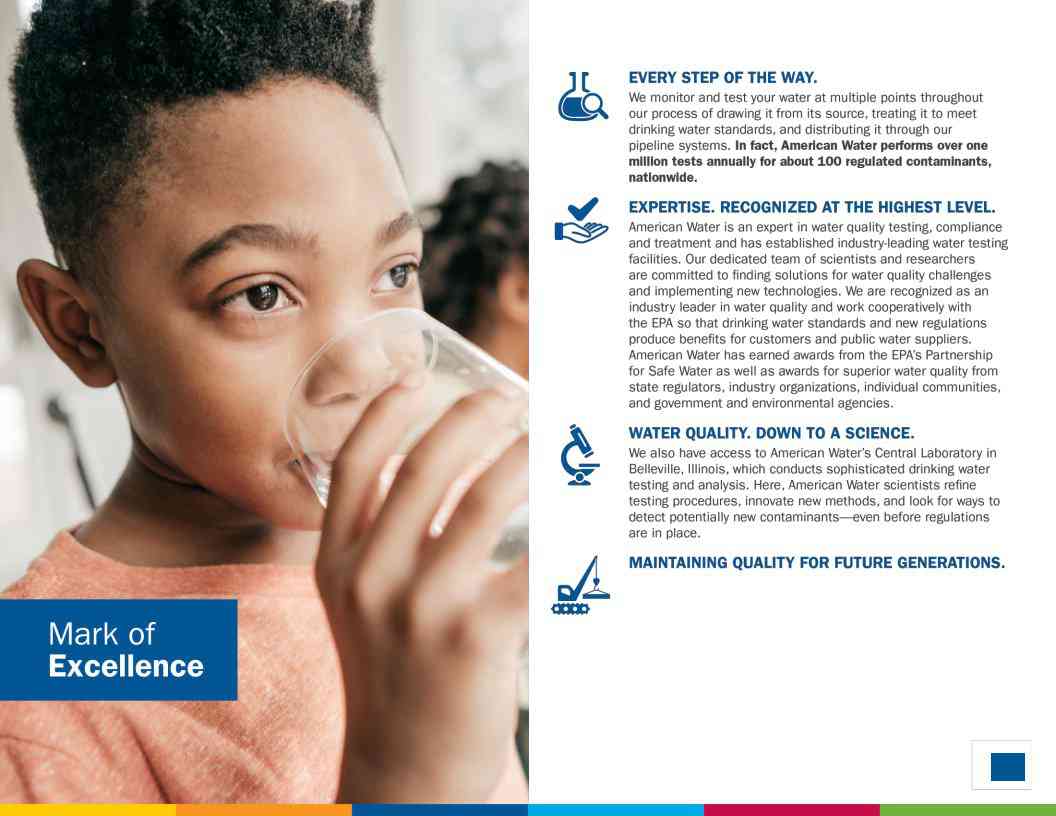
WHAT ARE WE DOING?
Our priorityis to provide reliable, quality drinking water service for our customers. The source of supply is an important part of that mission. We work to
understandandreduce potential risks to your drinking water supply. We have developed Source Water
ProtectionPlans for all our surface and ground water
systems.
Stakeholder involvement is an important part of the program. We partner withmanycommunity members and organizations to host annual wellhead protection meetings to review progress on the plan with stakeholders.
Here are a few of the efforts underway to protect our shared water resources:
Community Involvement: We are involved
in the Pathway to Water Quality exhibit at the Indiana State Fairgrounds. The exhibit has been helping to protect source water since 1993 by providing
Environmental Grant Program: Each year,
we fund projects that improve water resources in our local communities.
Greening our Communities: We have
planted over 20 acres of prairie grassat various locations across Indiana. Prairie grass acts as a habitat for pollinators that have been in rapid decline. Prairie grass also helps
to stabilize soil and improve water quality. Discovering New Opportunities: We
recently begana project with The Nature
Conservancyfundedby the United States
Department of Agriculture under the Farm Bill. The project willdevelop a strategy to
improve water quality at the headwaters 7
of the White River.
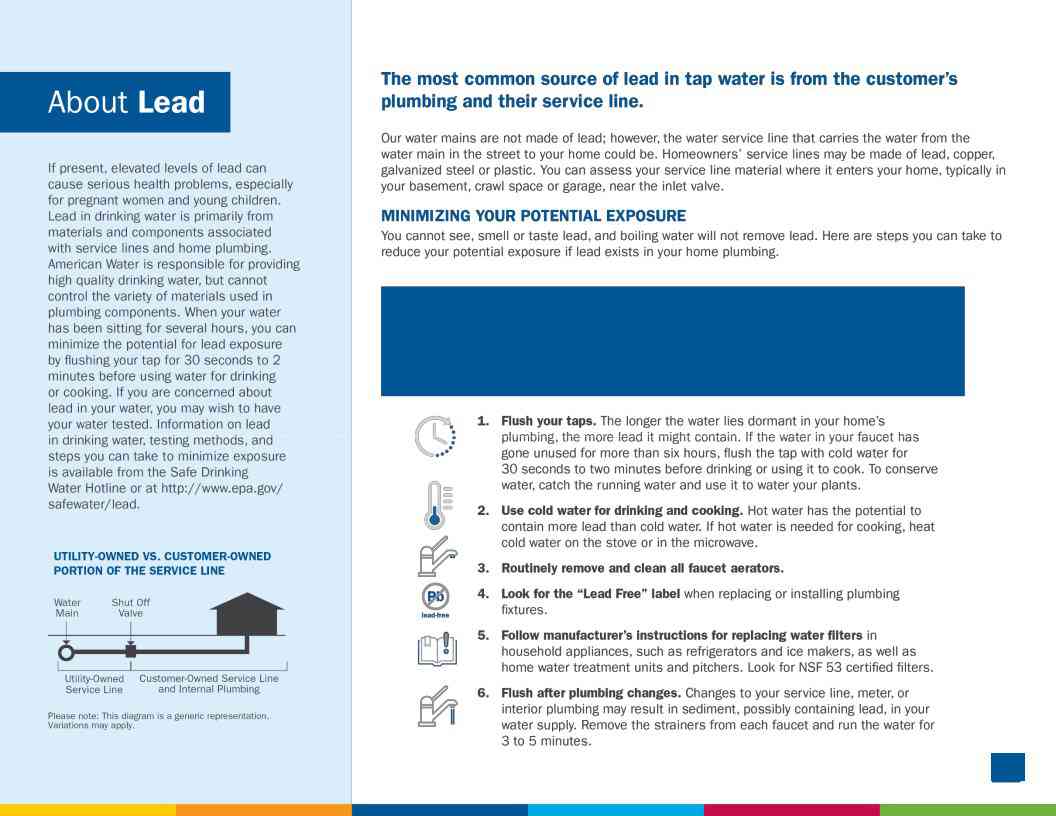
CHECK YOUR PLUMBING AND SERVICE LINE
If you live in an older home, consider having a licensed plumber check your plumbing for lead. If your service line is made of lead, and you’re planning to replace it, be sure to contact us at
8
NITRATES
Nitrate in drinking water at levels above 10 mg/L is
- health risk for infants of less than six months of age. Such nitrate levels in drinking water can interfere with the capacity of the infant’s blood to carry oxygen, resulting in serious illness. Symptoms include shortness of breath and blueness of the skin. Nitrate levels above 10 mg/L may also affect the ability of the blood to carry oxygen in other individuals, such as pregnant women and those with certain specific enzyme deficiencies. Nitrate levels may rise quickly for short periods of time because of rainfall or agricultural activity. If you are caring for an infant or you are pregnant, you should ask for advice from your health care provider.
9
UNREGULATED CONTAMINANT MONITORING RULE (UCMR)
The EPA created the Unregulated Contaminant Monitoring Rule (UCMR) to assist them in determining the occurrence of unregulated contaminants in drinking water and whether new regulations are warranted. The first Unregulated Contaminant Monitoring Rule (UCMR1) testing was completed in 2003 for a list of contaminants specifiedby the EPA. Unregulated contaminants are those for which the EPA has not established drinking water standards. UCMR2 testing was conducted between November 2008 and August 2009, and UCMR3 assessment monitoring was conducted between January 2013 and December 2016. The fourth list of contaminants to monitor as part of the UCMR was publishedby the EPA in December 2016. UCMR4 testing began in 2018 and was completed in 2020. The results from the UCMR monitoring are reported directly to the EPA. The results of this monitoring are incorporated in the data tables in this report as appropriate. For more information, contact our Customer Service Center at
PFAS Monitoring
PFAS refers to per- and polyfluoroalkyl substances, a class of synthetic chemicals, manufactured for industrial applicationsand commercial household products such as:
carpets; firefighting foam and cleaning products. The properties that make these chemicals useful in so many of our every- day products also resist breaking down and therefore persist in the environment. Exposure may be from food, food packaging, consumer products, house dust, indoor and outdoor air, drinking water and at workplaces where PFAS are made or used.
Indiana American Water is currently performing voluntary sampling to better understand certain occurrence of PFAS levels in drinking water sources. This testing allows us to understand how our water compares against the
for a combination of two PFAS compounds, PFOA and
PFOS. Testing also allows Indiana AmericanWater to be better prepared if the USEPA or state environmental regulator develop a drinking water standard for those PFAS for which
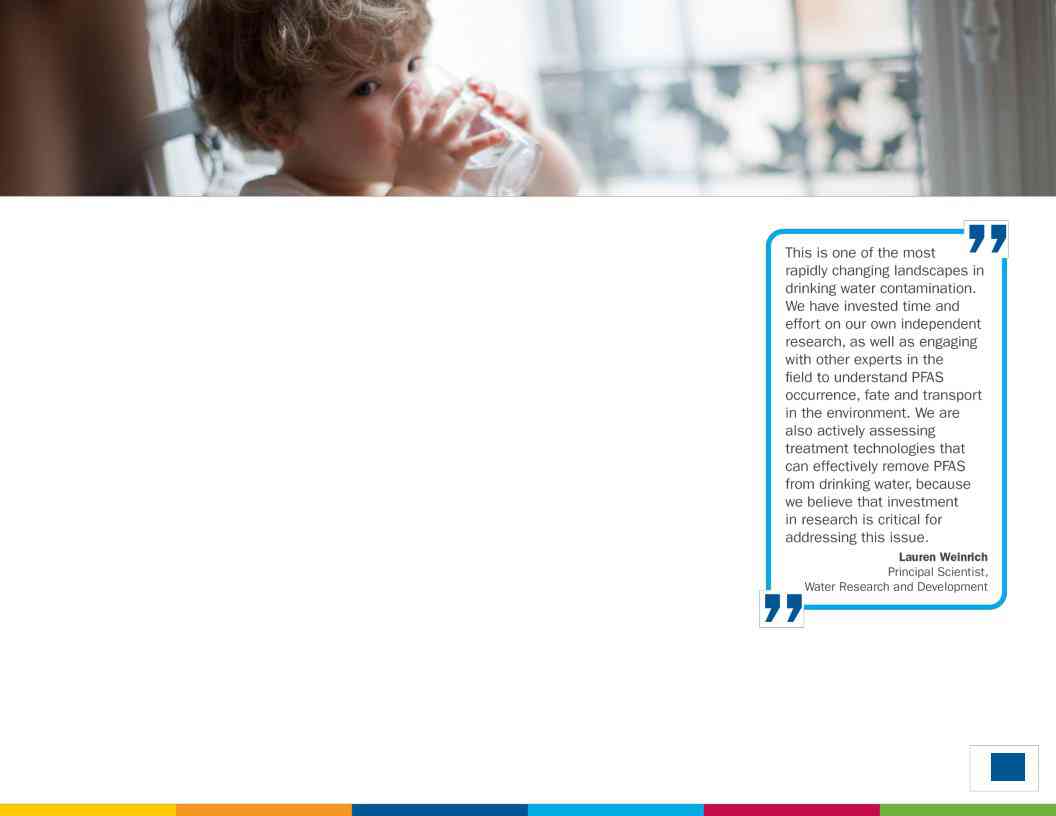
we have USEPA approved testing methods.
The science and regulation of PFAS and other contaminants is always evolving, and Indiana American Water strives to be a leader in research and development. PFAS contamination is one of the most rapidly changing areas in the drinking water field. We have invested in our own independent research, as well as engaging with other experts in the field to understand PFAS occurrence in the environment. We are also actively assessing treatment technologies that can effectively remove PFAS from drinking water, because we believe that investment in research is critically important to addressing this issue.
10
WATER QUALITY STATEMENT
We are pleased to report that during calendar year 2020, the results of testing of your drinking water complied with all state and federal drinking water requirements.
For your information, we have compileda list in the table below showing the testing of your drinking water during 2020. The Indiana Department of Environmental Management allows us to monitor for some contaminants less than once per year because the concentration of the contaminants does not change frequently. Some of our data, though representative, are more than one year old.
11
12
Indiana American Water conducts extensive monitoring to determine if your water meets all water quality standards. The detections of our monitoring are reported in the following tables. While most monitoring was conducted in 2020, certain substances are monitored less than once per year because the levels do not change frequently. For help with interpreting the tables below, see the applicable “Definition of Terms” on the previous page. Some unregulated substances are measured, but maximum contaminant levels have not been established by the government. These contaminants are shown for your information.
NOTE: Regulated contaminants not listed in this table were not found in the treated water supply.
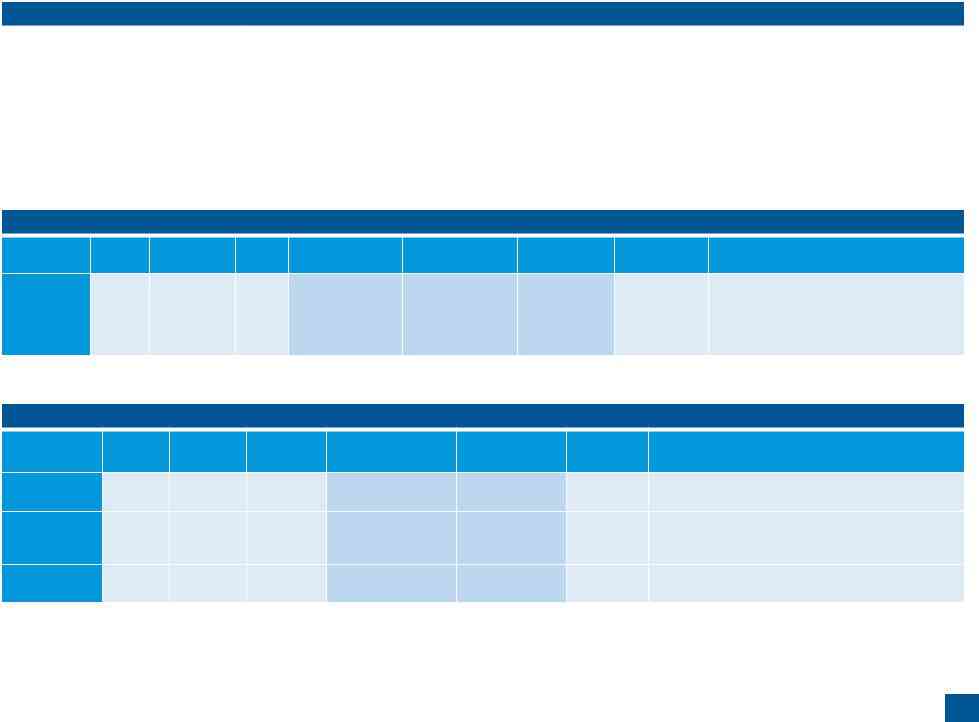
LEAD AND COPPER MONITORING PROGRAM - At least 30 tap water samples collected at customers’ taps every three years
Substance |
Year Sampled |
Compliance |
MCLG |
Action Level |
90th Percentile |
No. of Homes |
Homes Above |
Typical Source |
|
(with units) |
Achieved |
(AL) |
Sampled |
Action Level |
|||||
|
|
|
|
||||||
|
|
|
|
|
|
|
|
|
|
Lead (ppb) |
2018 |
Yes |
0 |
15 |
4 |
30 |
0 |
Corrosion of household plumbing systems. |
|
Copper (ppm) |
2018 |
Yes |
1.3 |
1.3 |
0.336 |
30 |
0 |
Corrosion of household plumbing systems. |
|
|
|
|
|
|
|
|
|
|
TOTAL COLIFORM RULE - At least 80 samples collected each month in the distribution system
Substance |
Year Sampled |
Compliance |
MCLG |
MCL |
Highest Percentage OR Highest |
Typical Source |
|
(with units) |
Achieved |
No. of Samples |
|||||
|
|
|
|
||||
|
|
|
|
*MCL = Less than 5% |
|
|
|
|
|
|
|
OR |
|
|
|
Total Coliform |
2020 |
Yes |
0 |
MCL = No more than |
0% |
Naturally present in the environment. |
|
|
|
|
|
1 positive monthly |
|
|
|
|
|
|
|
sample |
|
|
|
E. Coli |
2020 |
Yes |
0 |
TT = No confirmed |
0 |
Human and animal fecal waste. |
|
samples |
|||||||
|
|
|
|
|
|
NOTE: Coliforms are bacteria that are naturally present in the environment and are used as an indicator of the general bacter iological quality of the water. We are reporting the highest percentage of positive samples / highest number of positive samples in any month.
13
DISINFECTION BYPRODUCTS - Collected in the Distribution System
Substance |
Year |
Compliance |
MCLG |
MCL |
Highest |
Range |
Typical Source |
|
(with units) |
Sampled |
Achieved |
Compliance Result |
Detected |
||||
|
|
|
||||||
Total |
|
|
|
|
|
|
|
|
|
|
|
|
|
|
|
||
Trihalomethanes |
2020 |
Yes |
NA |
80 |
11.9 |
11.6 to 11.9 |
||
(TTHMs) (ppb) |
|
|
|
|
|
|
|
|
Haloacetic Acids |
2020 |
Yes |
NA |
60 |
7.6 |
5.5 to 7.6 |
||
(HAAs) (ppb) |
||||||||
|
|
|
|
|
|
|
||
|
|
|
|
|
|
|
|
NOTE: Compliance is based on the running annual average at each location. The Highest Compliance Result reflects the highest average at any location and the Range Detected reflects all samples from this year used to calculate the running annual average.
DISINFECTANTS - Collected in the Distribution System
Substance |
Year |
Compliance |
MRDLG |
MRDL |
Minimum Chlorine |
Compliance |
Range Detected |
Typical Source |
|
(with units) |
Sampled |
Achieved |
Residual |
Result |
|||||
|
|
|
|
||||||
Distribution |
|
|
|
|
|
|
|
|
|
System |
|
|
|
|
|
|
|
|
|
Chlorine |
2020 |
Yes |
4 |
4 |
0.2 |
0.77 |
0.33 to 1.51 |
Water additive used to control microbes. |
|
Residual |
|
|
|
|
|
|
|
|
|
(ppm)1 |
|
|
|
|
|
|
|
|
1 - Data represents the highest monthly average of chlorine residuals measured throughout our distribution system.
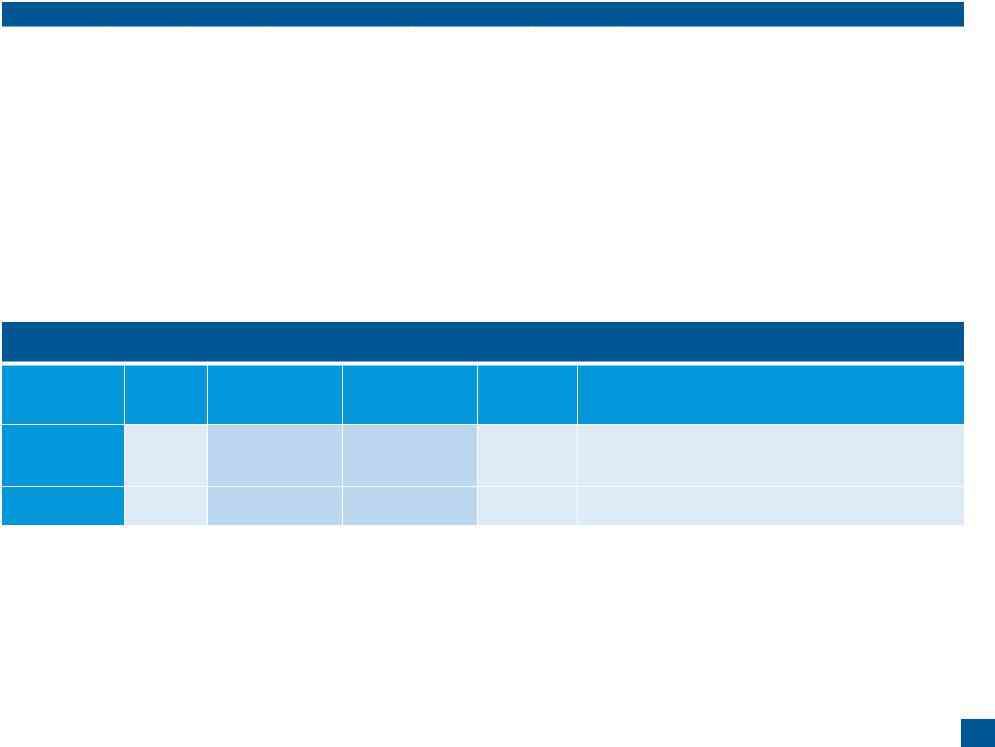
OTHER REGULATED SUBSTANCES - Collected at the Treatment Plant
Substance |
Year |
Compliance |
MCLG |
MCL |
Highest |
Range |
Typical Source |
|
(with units) |
Sampled |
Achieved |
Compliance Result |
Detected |
||||
|
|
|
||||||
Barium (ppm) |
2018 |
Yes |
2 |
2 |
0.3 |
0.1 to 0.3 |
Erosion of natural deposits; discharge of drilling wastes; |
|
discharge from metal refineries |
||||||||
|
|
|
|
|
|
|
||
|
|
|
|
|
|
|
Erosion of natural deposits; water additive which promotes |
|
Fluoride (ppm) |
2018 |
Yes |
4 |
4 |
0.64 |
0.53 to 0.64 |
strong teeth; discharge from fertilizer and aluminum |
|
|
|
|
|
|
|
|
factories. |
|
Nitrate (ppm) |
2020 |
Yes |
10 |
10 |
0.42 |
ND to 0.42 |
Runoff from fertilizer use; industrial or domestic wastewater |
|
discharges; erosion of natural deposits. |
||||||||
|
|
|
|
|
|
|
14
OTHER REGULATED SUBSTANCES - Collected at the Treatment Plant
Substance |
Year |
MCLG |
SMCL |
Level Found |
Range |
Typical Source |
|
(with units) |
Sampled |
Detected |
|||||
|
|
|
|
||||
|
|
|
|
|
|
|
|
Iron (ppm)1 |
2020 |
NA |
0.3 |
0.10 |
0.01 to 0.40 |
Naturally occurring. |
|
Manganese (ppm)1 |
2020 |
NA |
0.05 |
0.04 |
0.005 to 0.40 |
Naturally occurring. |
|
pH 1 |
2020 |
NA |
6.5 - 8.5 |
7.66 |
7.0 to 8.0 |
Naturally occurring. |
|
Sulfate (ppm) 1 |
2018 |
NA |
250 |
59.7 |
39.8 to 59.7 |
Erosion of natural deposits. |
|
|
|
|
|
|
|
|
1 - Substances with Secondary MCLs do not have MCLGs; these limits are primarily established to address aesthetic concerns.
OTHER SUBSTANCES OF INTEREST - Collected at the Treatment Plant
Substance |
Year Sampled |
EPA Guidance Level |
Level Found |
Range Detected |
Typical Source |
|
(with units) |
||||||
|
|
|
|
|
||
Hardness (ppm) |
2020 |
NA |
376 |
292 to 450 |
Naturally occurring. |
|
Sodium (ppm)1 |
2018 |
20 |
37.8 |
9.1 to 37.8 |
Naturally occurring. |
|
|
1 - For healthy individuals the sodium intake from water is not important because a much greater intake of sodium takes place fr om salt in the diet. However, sodium levels above the recommended upper limit may be of concern to individuals on a sodium restricted diet.
15
UNREGULATED CONTAMINANT MONITORING
Unregulated contaminants are those for which the EPA has not established drinking water standards. The purpose of unregulatedcontaminant monitoring is to assist the EPA in determining the occurrence of unregulated contaminants in drinking water and whether future regulation is necessary. Every five years, the EPA issues a new list of no more than 30 unregulated contaminants to be monitored.
ADDITIONAL WATER QUALITY PARAMETERS OF INTEREST– (Water in the Distribution System)
Parameter |
Units |
Year Sampled |
Level Found |
Range Detected |
Typical Source |
|
|
|
|
|
|
Bromochloroacetic Acid |
ppb |
2019 |
2.1 |
1.4 to 2.1 |
|
|
|
|
|
|
|
Bromodichloroacetic acid |
ppb |
2019 |
1.7 |
1.4 to 1.7 |
|
Chlorodibromoacetic acid |
ppb |
2019 |
1.4 |
0.53 to 1.4 |
|
|
|
|
|
|
|
Dibromoacetic Acid |
ppb |
2019 |
1.4 |
0.48 to 1.4 |
|
Dichloroacetic Acid |
ppb |
2019 |
3.2 |
1.8 to 3.2 |
|
|
|
|
|
|
|
Trichloroacetic Acid |
ppb |
2019 |
3.0 |
1.2 to 3.0 |
|
|
|
|
|
|
|
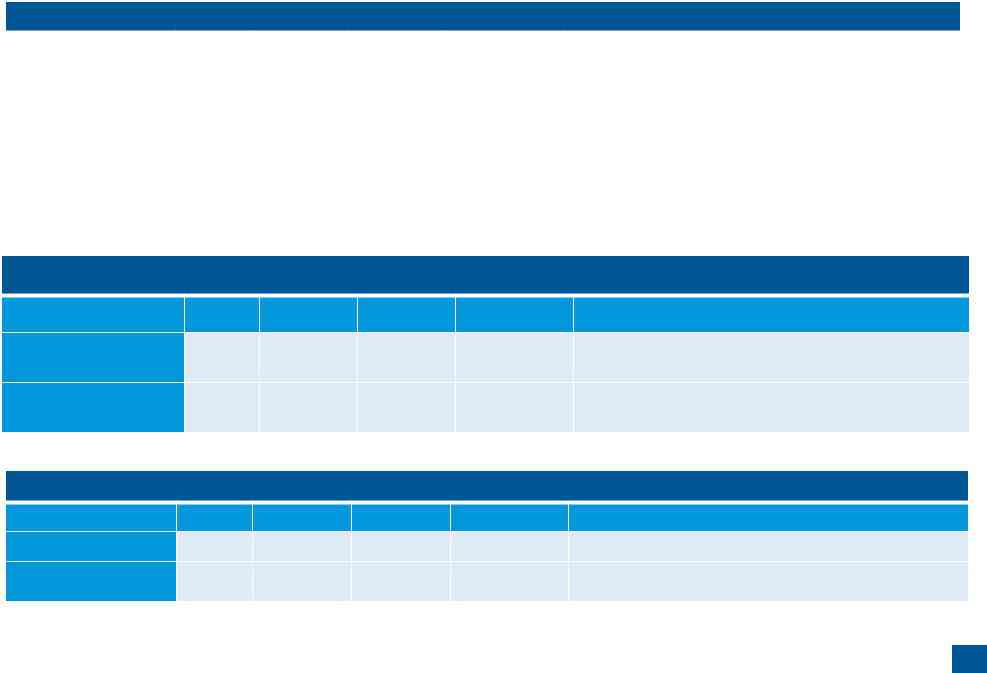
ADDITIONAL WATER QUALITY PARAMETERS OF INTEREST– (Water Leaving the Treatment Facility)
Parameter
Units
Year Sampled
Average Result
Range Detected
Typical Source
Germanium
ppb
2019
0.37
ND to 0.37
Naturally occurring.
Manganese*
ppb
2019
82
0.6 to 82
Naturally occurring.
* Manganese has a Secondary MCL of 50 ppb.
ADDITIONAL WATER QUALITY PARAMETERS OF INTEREST – (Measured in the raw water prior to treatment)
Parameter |
Units |
Year Sampled |
Average Result |
Range Detected |
Typical Source |
Bromide |
ppm |
2019 |
0.05 |
0.03 to 0.05 |
Naturally present in the environment |
Total Organic Carbon |
ppm |
2019 |
1.398 |
0.816 to 1.398 |
Naturally present in the environment |
|
16

UNREGULATED PERFLUORINATED COMPOUNDS
Parameter |
Units |
Year Sampled |
Average Result |
Range |
Typical Source |
|
Detected |
||||||
|
|
|
|
|
||
|
|
|
|
|
|
|
|
|
|
|
|
Used for its emulsifier and surfactant properties in or as fluoropolymers (such as Teflon), |
|
Perfluorooctanoic Acid (PFOA) |
ppt |
2020 |
4.3 |
ND to 4.3 |
fire fighting foams, cleaners, cosmetics, lubricants, paints, polishes, adhesives and |
|
|
|
|
|
|
photographic films |
|
Perfluorooctanesulfonic Acid |
ppt |
2020 |
2.1 |
ND to 2.1 |
Manmade chemical; used in products for stain, grease, heat and water resistance |
|
(PFOS) |
||||||
|
|
|
|
|
17
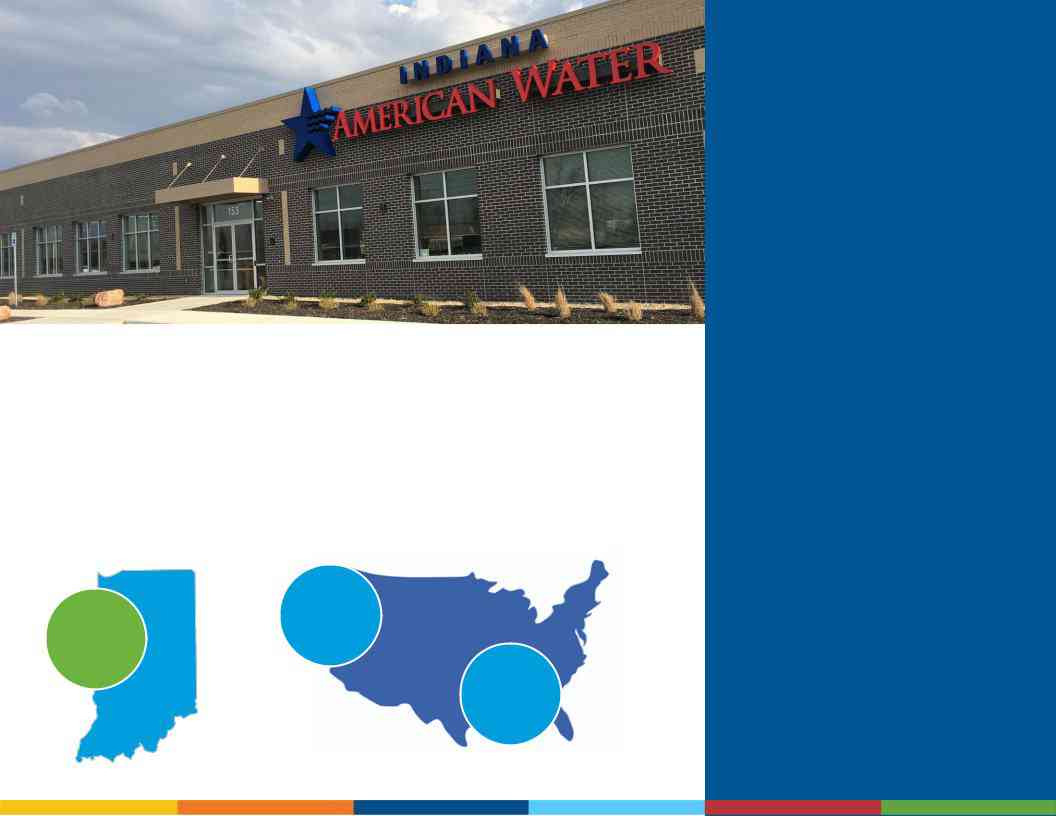
About Us
Indiana American Water, a subsidiary of American Water, is the largest
With a history dating back to 1886, American Water (NYSE:AWK) is the largest and most geographically diverse U.S. publicly traded water and wastewater utility company. The company employs more than 7,000 dedicated professionals who provide regulated and
employing
serving |
7,000 |
|
more than |
||
professionals |
||
1.3 million |
||
|
||
people |
serving |
|
|
||
|
15 million |
|
|
people |
IN DIANA AMERICAN WATER
F ACTS AT A GLANCE
-
C OMMUNITIES SERVED
135 communities served in 22 counties -
PEOPLE SERVED
Approximately 1.32 million people -
EM PLOYEES
Approximately 360 employees -
TREATMENT FACILITIES
36 surface and groundwater treatment plants. Average daily delivery including surface water, groundwater and purchased water is approximately 114 million gallons per day (MGD); 3 wastewater plants and 1 wastewater collection system -
M ILES OF PIPELINE
4,900 miles of water and sewer pipe -
STORAGE AND TRANSMISSION
More than 117 water tanks(with a storage capacity of more than 75 million gallons) and nearly 27,000 fire hydrants help to provide an adequate supply of water for our customers -
SOURCE OF SUPPLY 60% groundwater
40% surface water - PARTNERSHIP FOR SAFE WATER AWARDS All five of our surface water treatment plants received Directors Awardsfor the Partnership for Safe Water for going above what is required in the treatment process.
18

WATER INFORMATION SOURCES
Indiana American Water
Indiana Department of Environmental Management:
United States Environmental Protection Agency (USEPA):
Safe Drinking Water Hotline: (800)
Centers for Disease Control and Prevention: www.cdc.gov
American Water Works Association: www.awwa.org
Water Quality Association: www.wqa.org
National Library of Medicine/National Institute of Health:
19
Contaminants
Indiana American Water - Johnson County
EWG's drinking water quality report shows results of tests conducted by the water utility and provided to the Environmental Working Group by the Indiana Department of Environmental Management, as well as information from the U.S. EPA Enforcement and Compliance History database (ECHO). For the latest quarter assessed by the U.S. EPA (January 2019 - March 2019), tap water provided by this water utility was in compliance with federal health-based drinking water standards.
Utility details
- Serves: 77828
- Data available: 2012-2017
- Data Source: Groundwater
- Total: 11
Contaminants That Exceed Guidelines
- Total trihalomethanes (TTHMs)
Other Detected Contaminants
- 1%2C4-Dioxane
- Barium
- Chlorate
- Fluoride
- Haloacetic acids (HAA5)
- Molybdenum
- Nitrate
- Nitrate and nitrite
- Radium%2C combined (-226 & -228)
- Strontium
Reminder
Always take extra precautions, the water may be safe to drink when it leaves the sewage treatment plant but it may pick up pollutants during its way to your tap. We advise that you ask locals or hotel staff about the water quality. Also, note that different cities have different water mineral contents.