Table of Contents
Can You Drink Tap Water in Glen Burnie?
Yes, Glen Burnie's tap water is generally considered safe to drink as Glen Burnie has no active health based violations of the Safe Drinking Water Act (SDWA) that we are aware of. Other factors such as lead piping in a home, or low levels of pollutants on immunocompromised individuals, should also be considered, however. To find more recent info we might have, you can check out our boil water notice page or the city's water provider website.
According the EPA’s ECHO database, from April 30, 2019 to June 30, 2022, Glen Burnie's water utility, Glen Burnie-Broadneck, had 0 violations of the Safe Drinking Water Act. For more details on the violations, please see our violation history section below. This assessment is based on the Glen Burnie-Broadneck water system, other water systems in the city may have different results.
While tap water that meets the EPA health guidelines generally won’t make you sick to your stomach, it can still contain regulated and unregulated contaminants present in trace amounts that could potentially cause health issues over the long-run. These trace contaminants may also impact immunocompromised and vulnerable individuals.
The EPA is reviewing if it’s current regulations around pollutant levels in tap water are strict enough, and the health dangers posed by unregulated pollutants, like PFAS.
Water Quality Report for Glen Burnie Tap Water
The most recent publicly available numbers for measured contaminant levels in Glen Burnie tap water are in its 2020 Water Quality Report. As you can see, there are levels which the EPA considers to be acceptable, but being below the maximum allowable level doesn’t necessarily mean the water is healthy.
Lead in tap water, for example, is currently allowed at up to 15ppb by the EPA, but it has set the ideal goal for lead at zero. This highlights how meeting EPA standards doesn’t necessarily mean local tap water is healthy.
EPA regulations continue to change as it evaluates the long term impacts of chemicals and updates drinking water acceptable levels. The rules around arsenic, as well as, lead and copper are currently being re-evaluated.
There are also a number of "emerging" contaminants that are not currently. For example, PFAS (Per- and polyfluoroalkyl substances), for which the EPA has issued a health advisory. PFAS are called "forever chemicals" since they tend not to break down in the environment or the human body and can accumulate over time.
We recommend looking at the contaminants present in Glen Burnie's water quality reports, or getting your home's tap water tested to see if you should be filtering your water.
Glen Burnie Tap Water Safe Drinking Water Act Violation History - Prior 10 Years
Below is a ten year history of violations for the water system named Glen Burnie-Broadneck for Glen Burnie in Maryland. For more details please see the "What do these Violations Mean?" section below.
Is there Lead in Glen Burnie Water?
Based on the EPA’s ECHO Database, 90% of the samples taken from the Glen Burnie water system, Glen Burnie-Broadneck, between sample start date and sample end date, were at or below, 0.0 mg/L of lead in Glen Burnie water. This is 0% of the 0.015 mg/L action level. This means 10% of the samples taken from Glen Burnie contained more lead.
While Glen Burnie water testing may have found 0.0 mg/L of lead in its water, that does not mean your water source has the same amount. The amount of lead in water in a city can vary greatly from neighborhood to neighborhood, or even building to building. Many buildings, particularly older ones, have lead pipes or service lines which can be a source of contamination. To find out if your home has lead, we recommend getting you water tested.
No amount of lead in water is healthy, only less dangerous. As lead accumulates in our bodies over time, even exposure to relatively small amounts can have negative health effects. For more information, please check out our Lead FAQ page.
Are there PFAS in Glen Burnie Tap Water?
Currently, testing tap water for PFAS isn’t mandated on a national level. We do have a list of military bases where there have been suspected or confirmed leaks. There appears to be at least one military base - Fort Meade - Phoenix Military Reservation - near Glen Burnie with suspected leaks.
With many potential sources of PFAS in tap water across the US, the best information we currently have about which cities have PFAS in their water is this ewg map, which you can check to see if Glen Burnie has been evaluated for yet.
Our stance is better safe than sorry, and that it makes sense to try to purify the tap water just in case.
What do these Violations Mean?
Safe Drinking Water Act Violations categories split into two groups, health based, and non-health based. Generally, health based violations are more serious, though non-health based violations can also be cause for concern.
Health Based Violations
- Maximum contaminant levels (MCLs) - maximum allowed contaminant level was exceeded.
- Maximum residual disinfectant levels (MRDLs) - maximum allowed disinfectant level was exceeded.
- Other violations (Other) - the exact required process to reduce the amounts of contaminants in drinking water was not followed.
Non-Health Based Violations
- Monitoring and reporting violations (MR, MON) - failure to conduct the required regular monitoring of drinking water quality, and/or to submit monitoring results on time.
- Public notice violations (Other) - failure to immediately alert consumers if there is a serious problem with their drinking water that may pose a risk to public health.
- Other violations (Other) - miscellaneous violations, such as failure to issue annual consumer confidence reports or maintain required records.
SDWA Table Key
| Field | Description |
|---|---|
| Compliance Period | Dates of the compliance period. |
| Status |
Current status of the violation.
|
| Health-Based? | Whether the violation is health based. |
| Category Code |
The category of violation that is reported.
|
| Code | A full description of violation codes can be accessed in the SDWA_REF_CODE_VALUES (CSV) table. |
| Contaminant Code | A code value that represents a contaminant for which a public water system has incurred a violation of a primary drinking water regulation. |
| Rule Code |
Code for a National Drinking Water rule.
|
| Rule Group Code |
Code that uniquely identifies a rule group.
|
| Rule Family Code |
Code for rule family.
|
For more clarification please visit the EPA's data dictionary.
Glen Burnie Water - Frequently Asked Questions
| By Mail: | AADPW WATER UTILITIES LAB 437 MAXWELL FRYE ROAD MILLERSVILLE, MD, 21108 |
Existing customers can login to their Glen Burnie-Broadneck account to pay their Glen Burnie water bill by clicking here.
If you want to pay your Glen Burnie-Broadneck bill online and haven't made an account yet, you can create an account online. Please click here to create your account to pay your Glen Burnie water bill.
If you don't want to make an account, or can't remember your account, you can make a one-time payment towards your Glen Burnie water bill without creating an account using a one time payment portal with your account number and credit or debit card. Click here to make a one time payment.
Moving to a new house or apartment in Glen Burnie means you will often need to put the water in your name with Glen Burnie-Broadneck. In order to put the water in your name, please click the link to the start service form below. Start service requests for water bills typically take two business days.
Leaving your house or apartment in Glen Burnie means you will likely need to take your name off of the water bill with Glen Burnie-Broadneck. In order to take your name off the water bill, please click the link to the stop service form below. Stop service for water bills requests typically take two business days.
USER SUBMITTED RATINGS
- Drinking Water Pollution and Inaccessibility
- Water Pollution
- Drinking Water Quality and Accessibility
- Water Quality
The above data is comprised of subjective, user submitted opinions about the water quality and pollution in Glen Burnie, measured on a scale from 0% (lowest) to 100% (highest).
Related FAQS
Glen Burnie Water Quality Report (Consumer Confidence Report)
The EPA mandates that towns and cities consistently monitor and test their tap water. They must report their findings in an annual Consumer Confidence Report. Below is the most recent water quality report from Glen Burnie's Water. If you would like to see the original version of the report, please click here.
|
Presented By |
Presented ByAnne Arundel County |
|
x |
Department of Public Works |
PWS ID#: 002004, 0020008, 0020013, 0020017, 0020030, 0020044
Few commodities are as precious and vital to the public as an abundant supply of clean, safe drinking water. So, it is with great pleasure that I present to you the 2020 Drinking Water Quality Report for your public water system. This report brings to you a synopsis of thousands of tests and analyses on the more than 12 billion gallons of water produced and distributed by our dedicated Department of Public Works’ Bureau of Utility Operations’ employees. Their dedication is reflected in each and every drop of drinking water that flows from your taps. Once again this year, our public water met all state and federal standards. Although we are indeed blessed to have an abundant supply of clean, safe drinking water, we must be diligent in protecting those supplies and planning for the needs of future generations. Please use water wisely and teach your children the importance of this precious resource. The Department of Public Works and I are proud to present this information about your water system to you. I encourage you to read this report to understand how the Department of Public Works ensures our
county residents have access to the highest quality water.
Lead in Home Plumbing
If present, elevated levels of lead can cause serious health problems, especially for pregnant women and young chil- dren. Lead in drinking water is primarily from materials and components associated with service lines and home plumbing. We are responsible for providing
epa.gov/safewater/lead.
Count on Us
Delivering
a regular basis include:
- Operating and maintaining equipment to purify and clarify water;
- Monitoring and inspecting machinery, meters, gauges, and operating conditions;
- Conducting tests and inspections on water and evaluating the results;
- Maintaining optimal water chemistry;
- Applying data to formulas that determine treatment requirements, flow levels, and concentration levels;
- Documenting and reporting test results and system operations to regulatory agencies; and
- Serving our community through customer support, education, and outreach.
So, the next time you turn on your faucet, think of the skilled professionals who stand behind each drop.
Source Water Assessment
Source Water Assessment is a process for evaluating the vulnerability to contamination of the source of a public drinking water supply. The assessment does not address the treatment or distribution aspects of the water system, which are covered under separate provisions of the Safe Drinking Water Act. The Maryland Department of the Environment is the lead agency in developing these Assessments, which have been completed for all of the County’s water systems. To receive more information, contact the Maryland Department of the Environment, Water Supply Division, at water.supply@
maryland.gov.
Important Health Information
Some people may be more vulnerable to contami- nants in drinking water than the general population.
Immunocompromised persons such as persons with cancer undergoing chemotherapy, persons who have undergone organ transplants, people with HIV/AIDS or other immune system disorders, some elderly, and infants may be particularly at risk from infections. These people should seek advice about drinking water from their
viders. The U.S. EPA/CDC (Centers for Disease Control and Prevention) guidelines on appropriate means to lessen the risk of infection by Cryptosporidium and other micro- bial contaminants are available from the Safe Drinking Water Hotline at
-
426-4791 or http://water. epa.gov/drink/hotline.
Contact DPW
Visit us online at: www.DPWandYou.com
24 Hour Emergency Hotline: (410)
(from South County): (410)
Billing Office: (410)
DPW Customer Relations: (410)
DPW General Information: (410)
2020 CCR URL link:
Substances That Could Be in Water
To ensure that tap water is safe to drink, the U.S. EPA prescribes regulations limiting the amount of certain contaminants in water provided by public
water systems. U.S. Food and Drug Administration regulations establish limits for contaminants in bot- tled water, which must provide the same protection for public health. Drinking water, including bottled water, may reasonably be expected to contain at least small amounts of some contaminants. The presence of these contaminants does not necessarily indicate that the water poses a health risk.
The sources of drinking water (both tap water and bottled water) include rivers, lakes, streams, ponds, reservoirs, springs, and wells. As water travels over the surface of the land or through the ground, it dissolves naturally occurring minerals, in some cases, radioactive material, and substances resulting from the presence of animals or from human activity. Substances that may be present in source water include:
Microbial Contaminants, such as viruses and bacteria, which may come from sewage treatment plants, septic systems, agricultural livestock operations, or wildlife;
Inorganic Contaminants, such as salts and metals, which can be naturally occurring or may result from urban
Pesticides and Herbicides, which may come from a variety of sources such as agriculture, urban
Organic Chemical Contaminants, including synthetic and volatile organic chemicals, which are
Radioactive Contaminants, which can be naturally occurring or may be the result of oil and gas production and mining activities.
For more information about contaminants and potential health effects, call the U.S. EPA’s Safe Drinking Water Hotline at (800)
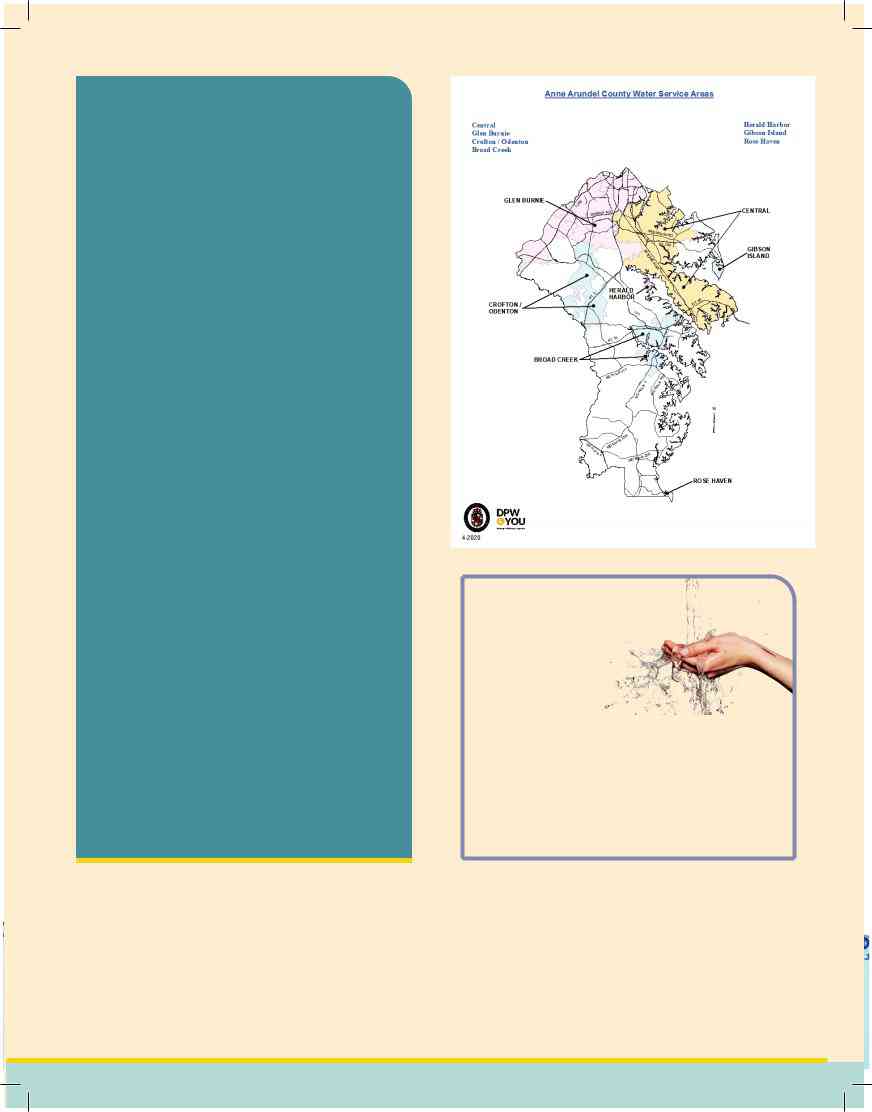
Where Does My
Water Come
From?
Anne Arundel County DPW customers enjoy an abundant water supply
from four deep aquifers. Our 12 water treatment facilities draw water from the Patapsco, Patuxent, and Aquia aquifers. Combined, our treatment facilities provide roughly 12.0 billion gallons of clean drinking water every year.
Test Results
Our water is monitored for many different kinds of substances on a very strict sampling schedule. Also, the water we deliver must meet specific health standards. Here, we show only those substances that were detected in our water. Remember that detecting a substance does not mean the water is unsafe to drink; our goal is to keep all detects below their respec-
tive maximum allowed levels.
The State recommends monitoring for certain substances less than once per year because the concentrations of these substances do not change frequently. In these cases, the most recent sample data are included, along with the year in which the sample was taken.
We participated in the 4th stage of the U.S. EPA’s Unregulated Contaminant Monitoring Rule (UCMR4) program by performing additional tests on our drinking water. UCMR4 sampling benefits the environment and public health by providing the U.S. EPA with data on the occurrence of contaminants suspected to be in drinking water, in order to determine if U.S. EPA needs to introduce new regulatory standards to improve drinking water quality. Unregulated contaminant monitoring data are available to the public, so please feel free to contact us if you are interested in obtaining that information. If you would like more information on the U.S. EPA’s Unregulated Contaminants Monitoring Rule, please call the Safe Drinking Water Hotline at (800)
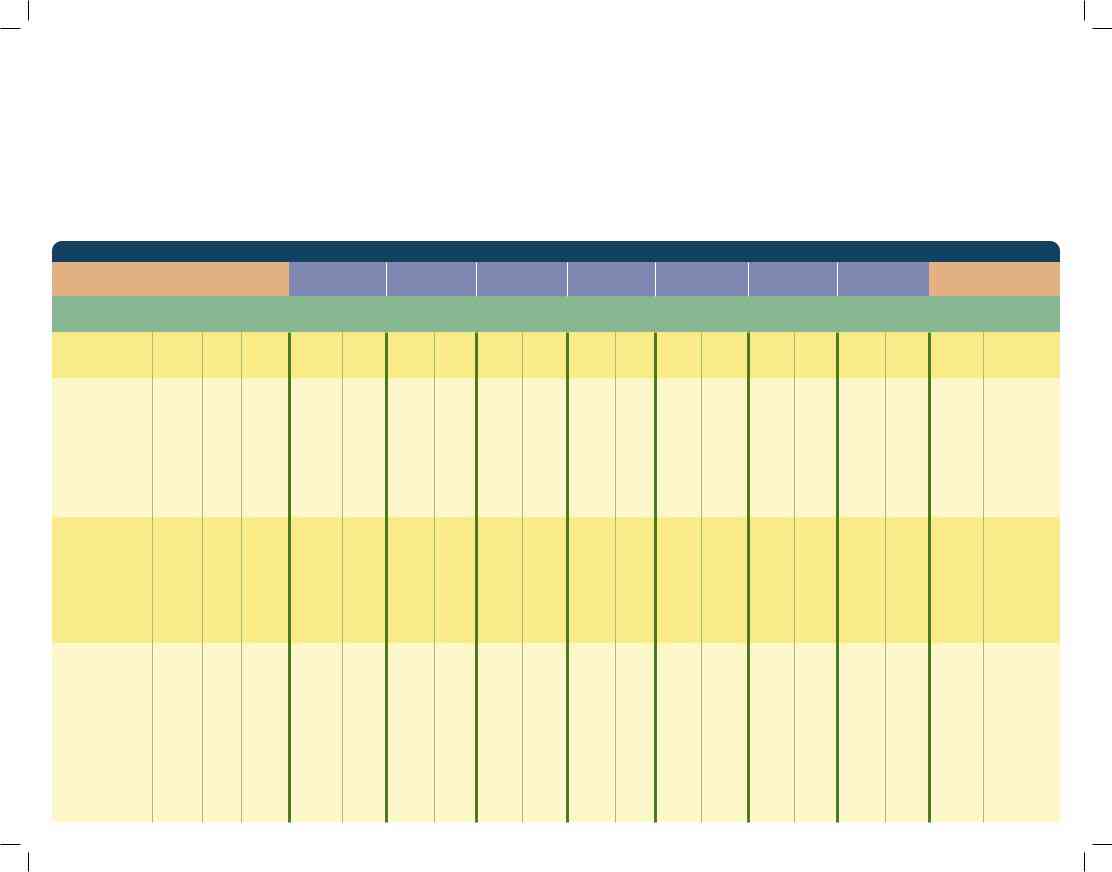
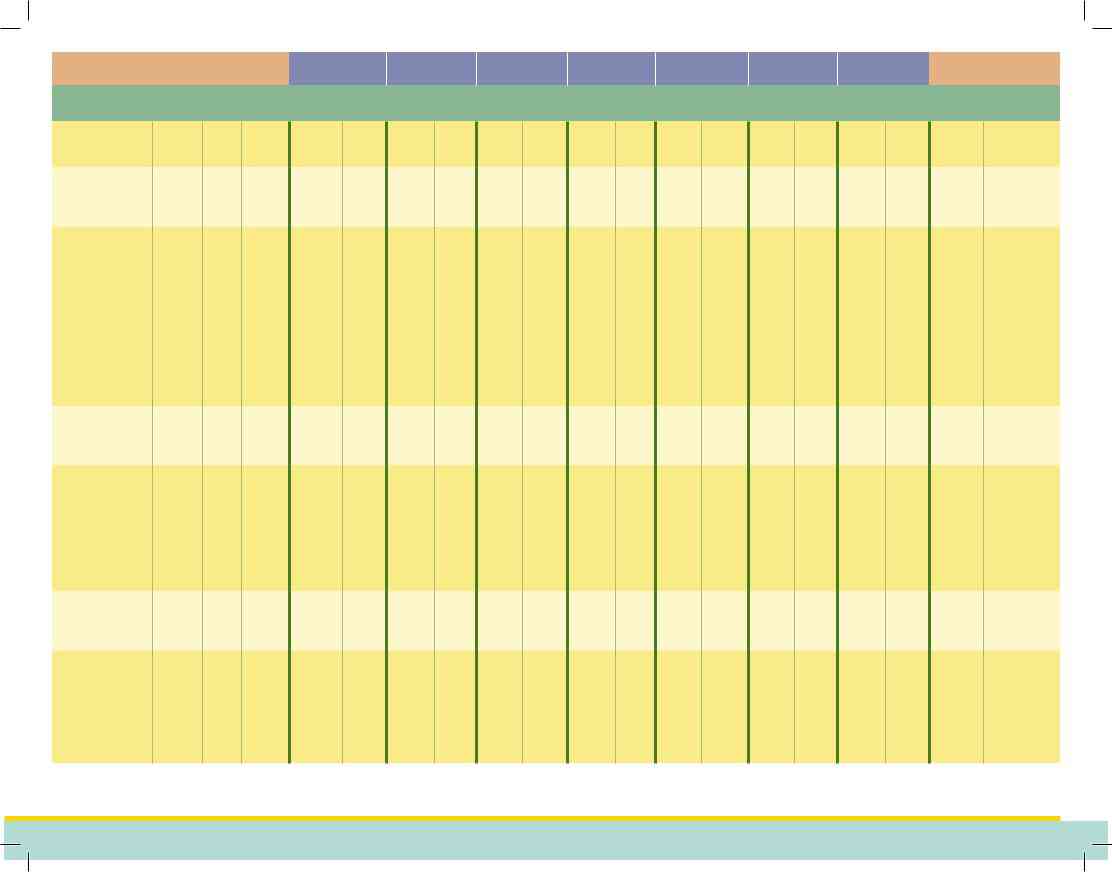
REGULATED SUBSTANCES
Glen Burnie Zone
Central Zone
Crofton/ Odenton
Zone
Broad Creek Zone
Herald Harbor Zone
Gibson Island Zone
Rose Haven Zone
SUBSTANCE
(UNIT OF MEASURE)
Alpha Emitters
(pCi/L)
Arsenic (ppb)
YEAR |
MCL |
MCLG |
HIGHEST |
SAMPLED |
[MRDL] |
[MRDLG] |
LEVEL |
2020 |
15 |
0 |
9.4 |
2019 |
10 |
0 |
NA |
RANGE
1.2–
9.4
NA
HIGHEST |
RANGE |
LOW- |
|
LEVEL |
HIGH |
NA |
NA |
NA |
NA |
HIGHEST RANGE LEVEL
NA |
NA |
NA |
NA |
HIGHEST |
RANGE |
LOW- |
|
LEVEL |
HIGH |
NA |
NA |
NA |
NA |
HIGHEST |
RANGE |
LEVEL |
|
NA |
NA |
NA |
NA |
HIGHEST |
RANGE |
LOW- |
|
LEVEL |
HIGH |
NA |
NA |
NA |
NA |
HIGHEST |
RANGE |
LOW- |
|
LEVEL |
HIGH |
NA |
NA |
1.0 1.0–
1.0
TYPICAL VIOLATION SOURCE
No |
Erosion |
|
of natural |
|
deposits |
No |
Erosion |
|
of natural |
|
deposits; |
|
Runoff from |
|
orchards; |
|
Runoff from |
|
glass and |
|
electronics |
|
production |
|
wastes |
Barium (ppm) |
2020 |
2 |
2 |
0.02 |
0.01– |
|
|
|
|
|
0.02 |
Cadmium (ppb) |
2020 |
5 |
5 |
2.0 |
2.0- |
|
|
|
|
|
2.0 |
0.071 |
0.01– |
|
0.071 |
NA |
NA |
0.011 |
0.01– |
|
0.011 |
NA |
NA |
0.021 |
0.02– |
|
0.021 |
NA |
NA |
11 |
0.001– |
|
0.0011 |
NA |
NA |
0.011 |
0.01– |
|
0.011 |
NA |
NA |
0.071 |
0.07– |
|
0.071 |
NA |
NA |
No |
Discharge |
|
of drilling |
|
wastes; |
|
Discharge |
|
from metal |
|
refineries; |
|
Erosion |
|
of natural |
|
deposits |
No |
Corrosion of |
|
galvanized |
|
pipes; |
|
Erosion |
|
of natural |
|
deposits; |
|
Discharge |
|
from metal |
|
refineries; |
|
Runoff |
|
from waste |
|
batteries and |
|
paints |
SUBSTANCE
(UNIT OF MEASURE)
Glen Burnie Zone
YEAR MCL MCLG HIGHEST RANGE
SAMPLED [MRDL] [MRDLG] LEVEL
Central Zone
RANGE
HIGHEST LOW-
LEVEL HIGH
Crofton/ Odenton
Zone
HIGHEST RANGE LEVEL
Broad Creek Zone
HIGHEST |
RANGE |
LOW- |
|
LEVEL |
HIGH |
Herald Harbor Zone
HIGHEST RANGE LEVEL
Gibson Island Zone
HIGHEST |
RANGE |
LOW- |
|
LEVEL |
HIGH |
Rose Haven Zone
HIGHEST |
RANGE |
LOW- |
|
LEVEL |
HIGH |
TYPICAL VIOLATION SOURCE
Combined
Radium (pCi/L)
Ethylbenzene (ppb)
Fluoride (ppm)
Haloacetic Acids [HAAs] (ppb)
Nitrate (ppm)
2020
2018
2020
2020
2020
5
700
4
60
10
0
700
4
NA
10
3.6
NA
1.03
4.6
1.4
1.8–
3.6
NA
0.10–
1.03
1.0–
4.6
1.4–
1.4
2.4 2.4–
2.4
NA |
NA |
0.97 0.11–
0.97
NA |
NA |
0.12 0.12–
0.12
NA |
NA |
NA |
NA |
0.87 0.21–
0.87
1.13 1.3–
1.3
NA |
NA |
NA |
NA |
NA |
NA |
1.06 0.11–
1.06
NA |
NA |
NA |
NA |
0.6 0.6–
0.6
NA |
NA |
0.99 0.16–
0.99
3.9 3.9–
3.9
NA |
NA |
NA |
NA |
NA |
NA |
1.10 0.08–
1.10
1.1 1.1–
1.1
NA |
NA |
NA |
NA |
0.5 0.5–
0.5
0.98 0.21–
0.98
16.6 16.6–
16.6
NA |
NA |
No |
Erosion |
|
of natural |
|
deposits |
No |
Discharge |
|
from |
|
petroleum |
|
refineries |
No |
Erosion |
|
of natural |
|
deposits; |
|
Water |
|
additive, |
|
which |
|
promotes |
|
strong teeth; |
|
Discharge |
|
from |
|
fertilizer and |
|
aluminum |
|
factories |
No |
|
|
of drinking |
|
water |
|
disinfection |
No |
Runoff from |
|
fertilizer use; |
|
Leaching |
|
from septic |
|
tanks, |
|
sewage; |
|
Erosion |
|
of natural |
|
deposits |
TTHMs [Total Trihalomethanes] (ppb)
Xylenes (ppm)
2020 |
80 |
NA |
8.5 |
0.6– |
|
|
|
|
8.5 |
2020 |
10 |
10 |
NA |
NA |
NA |
NA |
NA |
NA |
2.0 2.0–
2.0
NA |
NA |
7.4 7.4–
7.4
NA |
NA |
3.6 3.6–
3.6
NA |
NA |
3.1 3.1–
3.1
NA |
NA |
-
27.5–
27.5
-
0.62–
0.62
No |
|
|
of drinking |
|
water |
|
disinfection |
No |
Discharge |
|
from |
|
petroleum |
|
factories; |
|
Discharge |
|
from |
|
chemical |
|
factories |
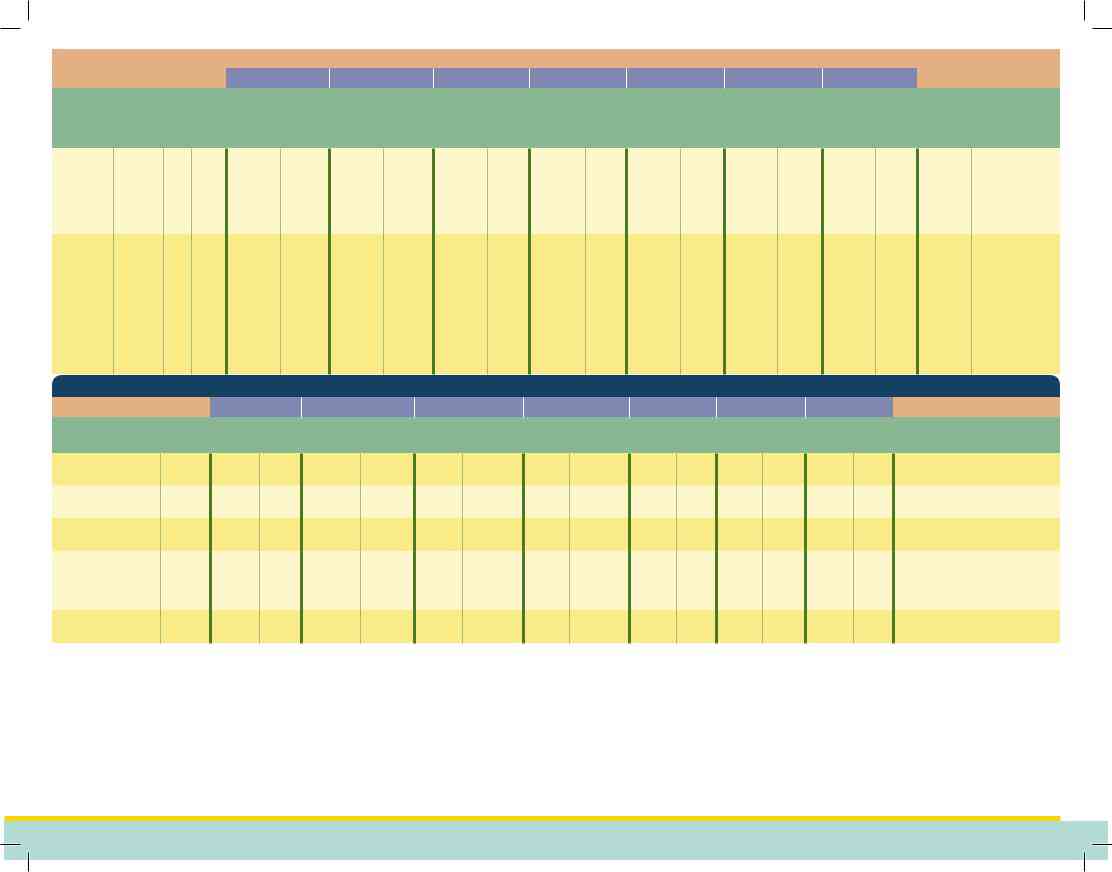
Tap Water Samples Collected for Copper and Lead Analyses from Sample Sites throughout the Community
Glen Burnie Zone
|
|
AMOUNT |
SITES |
SUBSTANCE |
|
DETECTED |
ABOVE |
(UNIT OF |
YEAR |
(90TH |
AL/TOTAL |
MEASURE) |
SAMPLED AL MCLG |
%ILE) |
SITES |
Central Zone |
Crofton/ Odenton Zone |
||
|
|
|
SITES |
AMOUNT |
SITES |
AMOUNT |
ABOVE |
DETECTED |
ABOVE |
DETECTED |
AL/ |
(90TH |
AL/TOTAL |
(90TH |
TOTAL |
%ILE) |
SITES |
%ILE) |
SITES |
Broad Creek Zone
|
SITES |
AMOUNT |
ABOVE |
DETECTED |
AL/ |
(90TH |
TOTAL |
%ILE) |
SITES |
Herald Harbor Zone
|
SITES |
AMOUNT |
ABOVE |
DETECTED |
AL/ |
(90TH |
TOTAL |
%ILE) |
SITES |
Gibson Island Zone
|
SITES |
AMOUNT |
ABOVE |
DETECTED |
AL/ |
(90TH |
TOTAL |
%ILE) |
SITES |
Rose Haven Zone
|
SITES |
AMOUNT |
ABOVE |
DETECTED |
AL/ |
(90TH |
TOTAL |
%ILE) |
SITES |
VIOLATION
TYPICAL SOURCE
Copper |
2019 |
1.3 |
1.3 |
0.06 |
0/50 |
0.061 |
0/501 |
0.021 |
0/301 |
(ppm) |
|
|
|
|
|
|
|
|
|
Lead |
2019 15 0 |
ND |
0/50 |
ND1 |
0/501 |
ND1 0/301 |
(ppb) |
|
|
|
|
|
|
0.0251 |
0/311 |
ND1 0/311
0.1141 |
0/121 |
NA |
NA |
0.011 |
0/101 |
NA |
NA |
0.242 |
0/102 |
NA |
NA |
No
No
Corrosion of household plumbing systems; Erosion of natural deposits
Lead services lines; Corrosion of household plumbing systems, including fittings and fixtures; Erosion of natural deposits
UNREGULATED AND OTHER SUBSTANCES
Glen Burnie Zone
Central Zone
Crofton/ Odenton Zone
Broad Creek Zone
Herald Harbor Zone
Gibson Island Zone
Rose Haven Zone
SUBSTANCE |
YEAR |
HIGHEST |
RANGE |
LOW- |
|||
(UNIT OF MEASURE) |
SAMPLED |
LEVEL |
HIGH |
HIGHEST |
RANGE |
LEVEL |
HIGHEST
LEVEL
RANGE
HIGHEST
LEVEL
RANGE
HIGHEST |
RANGE |
LOW- |
|
LEVEL |
HIGH |
HIGHEST |
RANGE |
LOW- |
|
LEVEL |
HIGH |
HIGHEST |
RANGE |
|
LOW- |
|
|
LEVEL |
HIGH |
TYPICAL SOURCE |
Bromochloroacetic
Acid (ppb)
Dichloroacetic
Acid (ppb)
Manganese (ppb)
Nickel (ppb)
2018
2019
2020
2019
NA
NA
17.0
15.0
NA
NA
1.91–
17.0
NA |
NA |
NA |
NA |
3.3
22.0 22.0-
22.0
0.58
NA
7.452
12.0
NA
1.43–
7.452
3.51
0.87
1.981
NA
1.98–
1.981
NA
NA |
NA |
NA |
NA |
NA |
NA |
1.0 1.0–
1.0
NA |
NA |
NA |
NA |
NA |
NA |
NA |
NA |
NA |
NA |
|
|
|
disinfection |
NA |
NA |
|
|
|
disinfection |
NA |
NA |
Naturally occuring |
NA |
NA |
Nickel is a natural element of |
|
|
the earth’s crust; therefore, small |
|
|
amounts are found in food, |
|
|
water, soil, and air |
Sodium (ppm)
- Sampled in 2019.
- Sampled in 2018.
2019
4.5
4.5–
4.5
6.22 |
6.9
5.2
NA |
NA |
3.5 3.5–
3.5
NA |
NA Naturally occuring |
Definitions
90th %ile: The levels reported for lead and copper represent the 90th percentile of the total |
MRDLG (Maximum Residual Disinfectant Level Goal): The level of a drinking water |
|
disinfectant below which there is no known or expected risk to health. MRDLGs do not reflect |
||
number of sites tested. The 90th percentile is equal to or greater than 90% of our lead and |
||
the benefits of the use of disinfectants to control microbial contaminants. |
||
copper detections. |
||
|
||
AL (Action Level): The concentration of a contaminant which, if exceeded, triggers treatment |
NA: Not applicable. |
|
or other requirements which a water system must follow. |
ND (Not detected): Indicates that the substance was not found by laboratory analysis. |
|
|
||
MCL (Maximum Contaminant Level): The highest level of a contaminant that is allowed |
pCi/L (picocuries per liter): A measure of radioactivity. |
|
in drinking water. MCLs are set as close to the MCLGs as feasible using the best available |
||
ppb (parts per billion): One part substance per billion parts water (or micrograms per liter). |
||
treatment technology. |
||
MCLG (Maximum Contaminant Level Goal): The level of a contaminant in drinking water |
ppm (parts per million): One part substance per million parts water (or milligrams per liter). |
|
below which there is no known or expected risk to health. MCLGs allow for a margin of safety. |
|
|
MRDL (Maximum Residual Disinfectant Level): The highest level of a disinfectant allowed |
|
|
in drinking water. There is convincing evidence that addition of a disinfectant is necessary for |
|
|
control of microbial contaminants. |
|
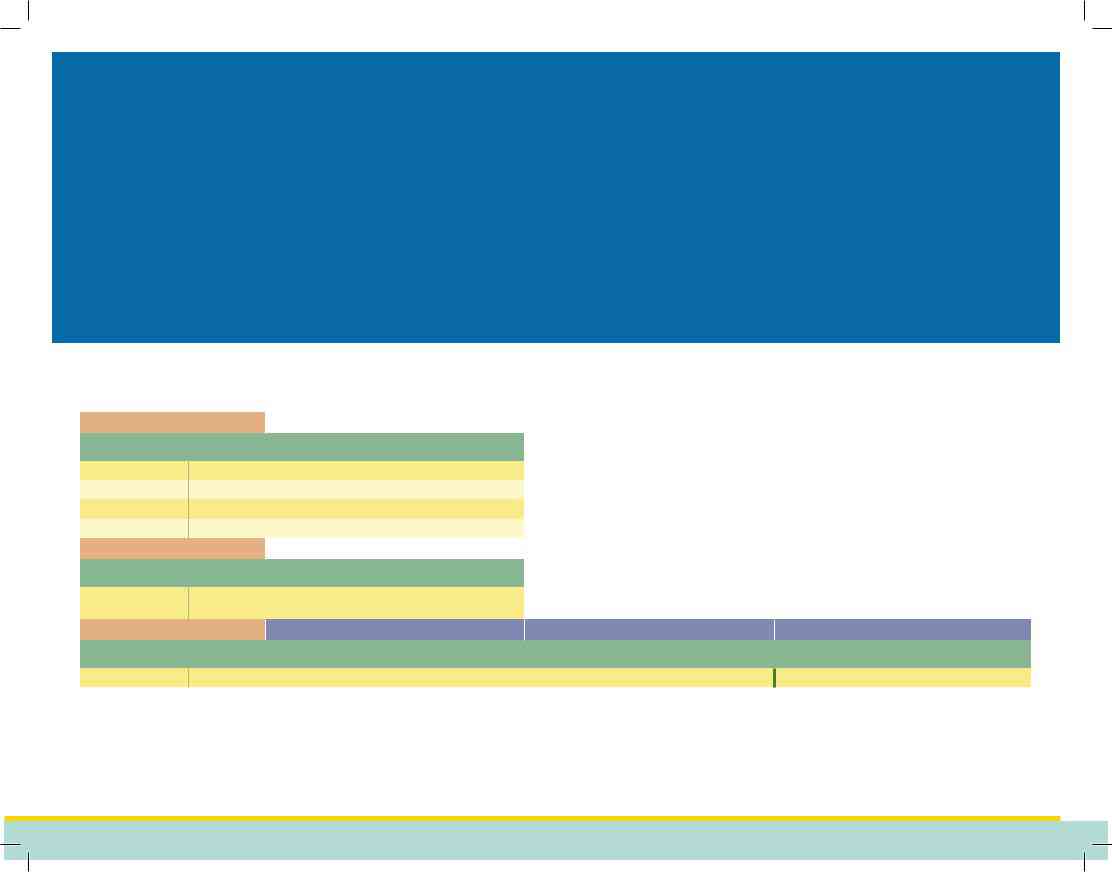
Addendum to the 2020 Printed CCR
SUBSTANCE
(UNIT OF MEASURE)
HAA5 (ppb)
HAA6Br (ppb)
HAA9 (ppb)
Manganese (ppm)
SUBSTANCE
(UNIT OF MEASURE)
Beta/Photon Emitters (pCi/l)
SUBSTANCE
(UNIT OF MEASURE)
Gross Alpha (pCi/l)
YEAR
SAMPLED
2020
2020
2020
2020
YEAR
SAMPLED
2020
YEAR
SAMPLED
2020
|
Glen Burnie/ Broadneck |
|
|
|
AVERAGE |
RANGE |
|
|
0.838 |
|
|
|
0 - 4.323 |
|
|
|
0.167 |
0 - 1.445 |
|
|
0.992 |
0 - 5.555 |
|
|
6.809 |
0.696 - 17.0 |
|
|
Glen Burnie/ Broadneck |
|
|
|
HIGHEST LEVEL |
RANGE |
|
|
|
|
|
|
5.8 |
0 - 5.8 |
|
|
|
|
|
|
Glen Burnie/ Broadneck |
|
|
|
HIGHEST LEVEL |
RANGE |
|
|
|
|
|
|
9.4 |
0 - 9.4 |
|
|
Crofton/ Odenton |
|
HIGHEST LEVEL |
|
RANGE |
1.1 |
|
|
|
1.1 - 1.1 |
|
|
Rose Haven |
|
HIGHEST LEVEL |
|
RANGE |
0.3 |
|
|
|
0.3 - 0.3 |
|
Contaminants
Glen Burnie-Broadneck
EWG's drinking water quality report shows results of tests conducted by the water utility and provided to the Environmental Working Group by the Maryland Department of the Environment, as well as information from the U.S. EPA Enforcement and Compliance History database (ECHO). For the latest quarter assessed by the U.S. EPA (January 2019 - March 2019), tap water provided by this water utility was in compliance with federal health-based drinking water standards.
Utility details
- Serves: 290606
- Data available: 2012-2017
- Data Source: Groundwater
- Total: 11
Contaminants That Exceed Guidelines
- Radium%2C combined (-226 & -228)
- Total trihalomethanes (TTHMs)
Other Detected Contaminants
- Barium
- Chlorate
- Chloroform
- Chromium (hexavalent)
- Cobalt
- Fluoride
- Nitrate
- Strontium
- Vanadium
Reminder
Always take extra precautions, the water may be safe to drink when it leaves the sewage treatment plant but it may pick up pollutants during its way to your tap. We advise that you ask locals or hotel staff about the water quality. Also, note that different cities have different water mineral contents.