Table of Contents
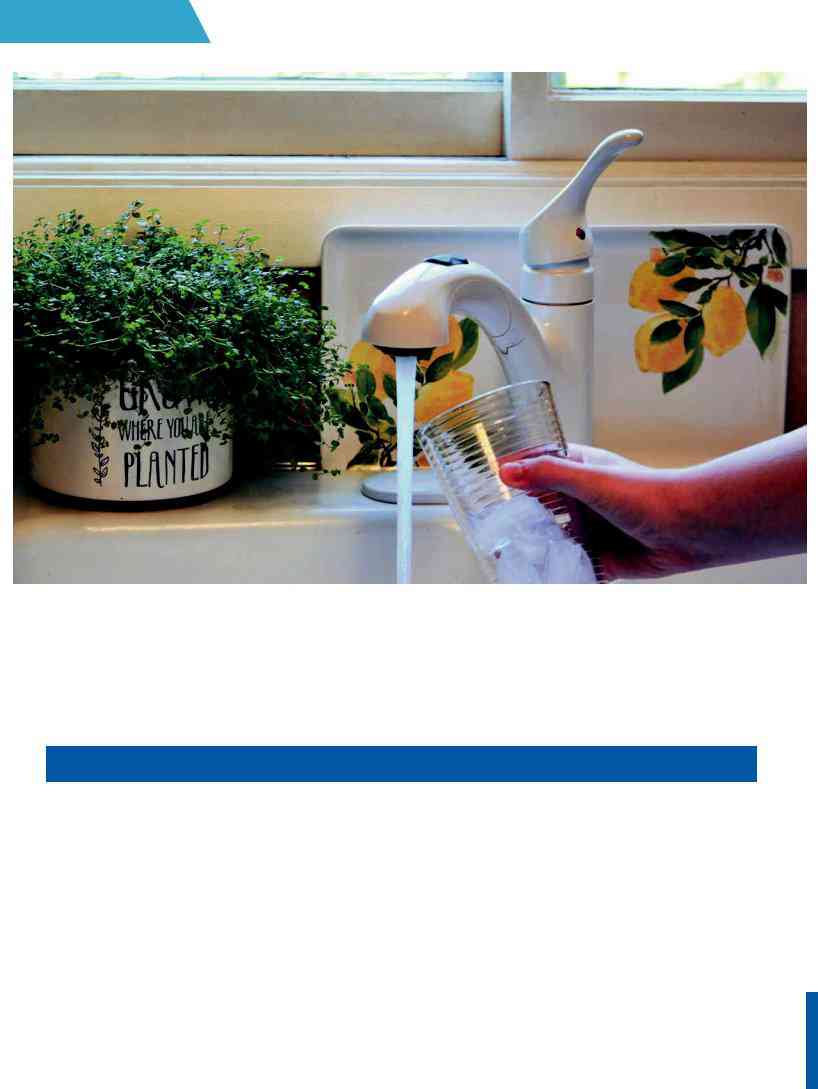
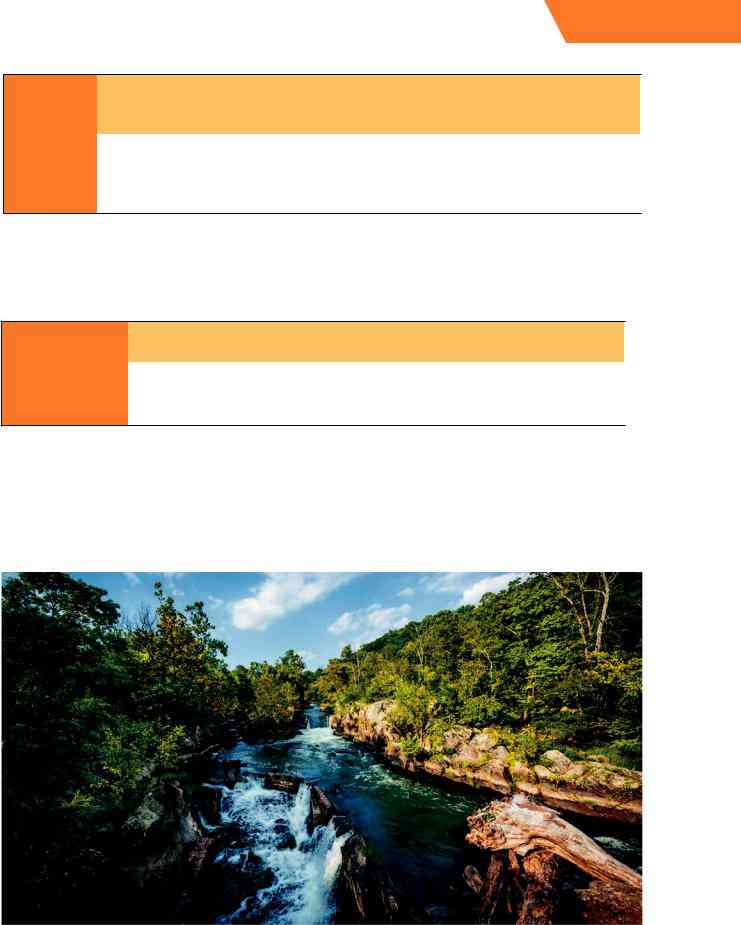
Can You Drink Tap Water in Fairfax?
Yes, Fairfax's tap water is generally considered safe to drink as Fairfax has no active health based violations of the Safe Drinking Water Act (SDWA) that we are aware of. Other factors such as lead piping in a home, or low levels of pollutants on immunocompromised individuals, should also be considered, however. To find more recent info we might have, you can check out our boil water notice page, the city's water provider website, or Fairfax's local Twitter account.
According the EPA’s ECHO database, from April 30, 2019 to June 30, 2022, Fairfax's water utility, Fairfax County Water Authority, had 0 violations of the Safe Drinking Water Act. For more details on the violations, please see our violation history section below. This assessment is based on the Fairfax County Water Authority water system, other water systems in the city may have different results.
While tap water that meets the EPA health guidelines generally won’t make you sick to your stomach, it can still contain regulated and unregulated contaminants present in trace amounts that could potentially cause health issues over the long-run. These trace contaminants may also impact immunocompromised and vulnerable individuals.
The EPA is reviewing if it’s current regulations around pollutant levels in tap water are strict enough, and the health dangers posed by unregulated pollutants, like PFAS.
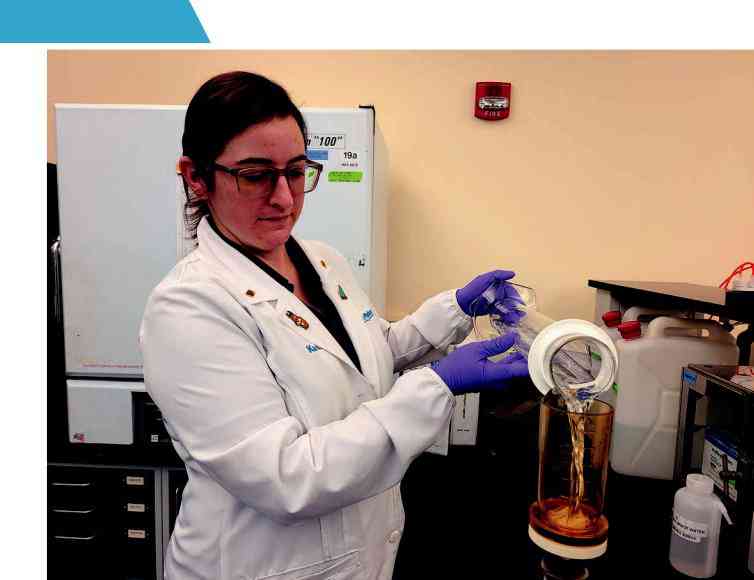
Water Quality Report for Fairfax Tap Water
The most recent publicly available numbers for measured contaminant levels in Fairfax tap water are in its 2020 Water Quality Report. As you can see, there are levels which the EPA considers to be acceptable, but being below the maximum allowable level doesn’t necessarily mean the water is healthy.
Lead in tap water, for example, is currently allowed at up to 15ppb by the EPA, but it has set the ideal goal for lead at zero. This highlights how meeting EPA standards doesn’t necessarily mean local tap water is healthy.
EPA regulations continue to change as it evaluates the long term impacts of chemicals and updates drinking water acceptable levels. The rules around arsenic, as well as, lead and copper are currently being re-evaluated.
There are also a number of "emerging" contaminants that are not currently. For example, PFAS (Per- and polyfluoroalkyl substances), for which the EPA has issued a health advisory. PFAS are called "forever chemicals" since they tend not to break down in the environment or the human body and can accumulate over time.
We recommend looking at the contaminants present in Fairfax's water quality reports, or getting your home's tap water tested to see if you should be filtering your water.
Fairfax Tap Water Safe Drinking Water Act Violation History - Prior 10 Years
Below is a ten year history of violations for the water system named Fairfax County Water Authority for Fairfax in Virginia. For more details please see the "What do these Violations Mean?" section below.
Is there Lead in Fairfax Water?
Based on the EPA’s ECHO Database, 90% of the samples taken from the Fairfax water system, Fairfax County Water Authority, between sample start date and sample end date, were at or below, 0.001 mg/L of lead in Fairfax water. This is 6.7% of the 0.015 mg/L action level. This means 10% of the samples taken from Fairfax contained more lead.
While Fairfax water testing may have found 0.001 mg/L of lead in its water, that does not mean your water source has the same amount. The amount of lead in water in a city can vary greatly from neighborhood to neighborhood, or even building to building. Many buildings, particularly older ones, have lead pipes or service lines which can be a source of contamination. To find out if your home has lead, we recommend getting you water tested.
No amount of lead in water is healthy, only less dangerous. As lead accumulates in our bodies over time, even exposure to relatively small amounts can have negative health effects. For more information, please check out our Lead FAQ page.
Are there PFAS in Fairfax Tap Water?
Currently, testing tap water for PFAS isn’t mandated on a national level. We do have a list of military bases where there have been suspected or confirmed leaks. There appears to be at least one military base - NAVSURFWARCEN WBETH DD - near Fairfax with suspected leaks.
With many potential sources of PFAS in tap water across the US, the best information we currently have about which cities have PFAS in their water is this ewg map, which you can check to see if Fairfax has been evaluated for yet.
Our stance is better safe than sorry, and that it makes sense to try to purify the tap water just in case.
What do these Violations Mean?
Safe Drinking Water Act Violations categories split into two groups, health based, and non-health based. Generally, health based violations are more serious, though non-health based violations can also be cause for concern.
Health Based Violations
- Maximum contaminant levels (MCLs) - maximum allowed contaminant level was exceeded.
- Maximum residual disinfectant levels (MRDLs) - maximum allowed disinfectant level was exceeded.
- Other violations (Other) - the exact required process to reduce the amounts of contaminants in drinking water was not followed.
Non-Health Based Violations
- Monitoring and reporting violations (MR, MON) - failure to conduct the required regular monitoring of drinking water quality, and/or to submit monitoring results on time.
- Public notice violations (Other) - failure to immediately alert consumers if there is a serious problem with their drinking water that may pose a risk to public health.
- Other violations (Other) - miscellaneous violations, such as failure to issue annual consumer confidence reports or maintain required records.
SDWA Table Key
| Field | Description |
|---|---|
| Compliance Period | Dates of the compliance period. |
| Status |
Current status of the violation.
|
| Health-Based? | Whether the violation is health based. |
| Category Code |
The category of violation that is reported.
|
| Code | A full description of violation codes can be accessed in the SDWA_REF_CODE_VALUES (CSV) table. |
| Contaminant Code | A code value that represents a contaminant for which a public water system has incurred a violation of a primary drinking water regulation. |
| Rule Code |
Code for a National Drinking Water rule.
|
| Rule Group Code |
Code that uniquely identifies a rule group.
|
| Rule Family Code |
Code for rule family.
|
For more clarification please visit the EPA's data dictionary.
Fairfax Water - Frequently Asked Questions
| By Mail: | 1295 FRED MORIN ROAD HERNDON, VA, 20170 |
Existing customers can login to their Fairfax County Water Authority account to pay their Fairfax water bill by clicking here.
If you want to pay your Fairfax County Water Authority bill online and haven't made an account yet, you can create an account online. Please click here to create your account to pay your Fairfax water bill.
If you don't want to make an account, or can't remember your account, you can make a one-time payment towards your Fairfax water bill without creating an account using a one time payment portal with your account number and credit or debit card. Click here to make a one time payment.
Moving to a new house or apartment in Fairfax means you will often need to put the water in your name with Fairfax County Water Authority. In order to put the water in your name, please click the link to the start service form below. Start service requests for water bills typically take two business days.
Leaving your house or apartment in Fairfax means you will likely need to take your name off of the water bill with Fairfax County Water Authority. In order to take your name off the water bill, please click the link to the stop service form below. Stop service for water bills requests typically take two business days.
The estimated price of bottled water
$1.5 in USD (1.5-liter)
USER SUBMITTED RATINGS
- Drinking Water Pollution and Inaccessibility
- Water Pollution
- Drinking Water Quality and Accessibility
- Water Quality
The above data is comprised of subjective, user submitted opinions about the water quality and pollution in Fairfax, measured on a scale from 0% (lowest) to 100% (highest).
Related FAQS
Fairfax Water Quality Report (Consumer Confidence Report)
The EPA mandates that towns and cities consistently monitor and test their tap water. They must report their findings in an annual Consumer Confidence Report. Below is the most recent water quality report from Fairfax's Water. If you would like to see the original version of the report, please click here.
2 |
2021 Annual Water Quality Report |
|
“ We are, all of us, water beings on a water planet. Water is life. Without it, all living things die. Our dependence on water is absolute; our psyches
know this and signal us in myriad ways of water’s elemental importance and significance. That is why we love the water and remember experiences associated with it.
“Of the earth’s vast resources of water, only a small fraction is fresh and drinkable. A few people among the globe’s billions have been charged with the task of ensuring everyone else has a reliable supply of safe water. Supplying potable water is an essential”human activity, a great responsibility, and a vocation of distinction.
J.B. Mannion
Former Executive Director
American Water Works Association
This report contains very important information about your drinking water. Please translate it or speak with someone who understands it. If you are a landlord, please share a copy of this report with your tenants.

2021 Annual Water Quality Report |
3 |
|
TABLE OF CONTENTS
|
|
LETTERS FROM OUR EXECUTIVE LEADERS |
4 |
|
|
|
|
|
|
UNDERSTANDING YOUR WATER QUALITY |
6 |
|
|
|
|
|
|
FINDING YOUR WATER QUALITY |
8 |
|
|
||
|
|
|
|
|
|
INFORMATION ABOUT SOURCE (RAW) WATER |
9 |
|
|
|
|
|
|
REDUCING EXPOSURE TO LEAD |
10 |
|
|
|
|
|
|
UNDERSTANDING WATER QUALITY TEST RESULTS |
12 |
|
|
|
|
|
|
KEY TERMINOLOGY AND ABBREVIATIONS |
13 |
|
|
|
|
|
|
FAIRFAX WATER LEGACY AND CITY OF FAIRFAX SERVICE AREA RESULTS |
14 |
|
|
|
|
|
|
CITY OF FALLS CHURCH SERVICE AREA RESULTS |
18 |
|
|
|
|
|
|
ARLINGTON SPECIAL SERVICE AREA RESULTS |
22 |
|
|
|
|
|
|
2020 CRYPTOSPORIDIUM MONITORING STATEMENT |
26 |
|
|
|
|
|
|
2020 UNREGULATED CONTAMINANT MONITORING (UCMR 4) RULE DATA |
28 |
|
|
|
|
|
|
FACTS ABOUT PFAS |
30 |
|
|
|
|
|
|
BE WINTER SALT SMART: LEARN HOW TO PROTECT OUR SOURCE WATER |
31 |
|
|
|
|
|
|
|
|
|
|
|
|
|
|
|
|

4 |
2021 Annual Water Quality Report |
|
Letter From the
Chairman
June 2021
My fellow Fairfax Water customers,
With all that happened in 2020, I am proud to report to you that your Water Quality is Excellent. Despite the complexities we all faced last year, Fairfax Water staff more than met the challenge of the uncertain and evolving threat of
Once again this year, Fairfax Water has met and surpassed standards set forth by the Environmental Protection Agency (EPA) and the Virginia Department of Health (VDH). The Board and employees of Fairfax Water all know the importance of the essential service that we provide. That focus will not change, and it is what drives our organization to consistently surpass water quality standards while keeping water rates at one of the lowest levels in the region.
We hope you enjoy reading this year’s report. Rest assured Fairfax Water is ready and resilient, and our team is working hard every day so that you can have complete faith in the quality of your water.
Philip W. Allin
Chairman of the Board
Fairfax Water

2021 Annual Water Quality Report |
5 |
|
Letter From the
General Manager
June 2021
Dear Fairfax Water customers,
Even with the challenges that came with the pandemic, our Fairfax Water team continued to work tirelessly last year to treat and deliver water to your home. It’s not a stretch to say that this past year has been unlike any other. At the start of 2020, we knew that whatever the pandemic might bring, we would stick to our mission: to provide our customers with reliable and abundant water of exceptional quality at a reasonable price. I am pleased to say that this year’s water quality report shows the outstanding quality of our water once again.
Our team recognized from the start that our customers would want an extra layer of safety in our interactions with them, and we immediately took steps to make that happen. Staff and crews in the field took all necessary safety precautions while being accessible to our customers. We’ve received many compliments this year from customers about how our employees helped answer their questions and make them feel at ease. This dedication is the kind of service that makes our efficient, highly trained, and resilient team among the best in the industry.
While you read this year’s report on your water quality, please keep in mind the essential workers who’ve worked so hard to keep our region going during a difficult time. Be sure to thank them for their commitment to the community they serve.
Stay safe, and thank you for your continued support!
Steven T. Edgemon
General Manager
Fairfax Water

6 |
2021 Annual Water Quality Report |
|
UNDERSTANDING YOUR WATER QUALITY
HOW IS MY WATER QUALITY?
Your water quality is excellent. As a Fairfax Water customer, you drink water that consistently surpasses all federal and state standards. Of the 286 compounds we tested for, very few were found in our drinking water. Those we found were in negligible amounts well below the EPA’s maximum contaminant levels.
HOW IS THE WATER TESTED AND BY WHOM?
Fairfax Water’s
2021 Annual Water Quality Report |
7 |
|
How Is Your Water Treated?
Fairfax Water provides water that is treated at four treatment plants. The James J. Corbalis Jr. and the Frederick P. Griffith Jr. treatment plants are owned and operated by Fairfax Water. The Dalecarlia and McMillan treatment plants, part of the Washington Aqueduct, are owned and operated by the U.S. Army Corps of Engineers. All four plants use advanced technologies and practices in drinking water treatment, which is the process of cleaning raw water to make it safe for you to drink. When untreated water enters the treatment plant, coagulants are added to cause small particles to adhere to one another, become heavy, and settle in a sedimentation basin.
The water is then filtered through carbon and sand to remove any remaining fine particles. It is disinfected with chlorine to kill harmful bacteria and viruses. A corrosion inhibitor is added to help prevent leaching of lead and copper that might be in household plumbing. Fluoride is added to protect teeth. Powdered activated carbon and potassium permanganate may also be added to the treatment process to remove taste and
THE WATER TREATMENT PROCESS
Throughout this report, you will find many references to water in different stages of the treatment process.
Raw Water Source |
Process |
Finished Water |
Distribution |
Water in its natural |
Water at various |
Water leaving the |
Treated water piped |
state that feeds into |
points during the |
treatment plant |
from our facilities |
our treatment plants. |
treatment process. |
for distribution or |
to your home or |
|
|
storage. |
business. |
NOTE ABOUT MEETINGS OF THE FAIRFAX WATER BOARD
Fairfax Water’s Board typically meets the first and third Thursday of each month at 6:30 p.m. in the Board room of the Fairfax Water offices at 8570 Executive Park Avenue in Fairfax. Notices of public hearings and other opportunities for public participation are posted in the lobby and on the website at fairfaxwater.org.
If you plan to attend a meeting or need more information, contact Fairfax Water at
8 |
2021 Annual Water Quality Report |
|
FINDING YOUR WATER QUALITY
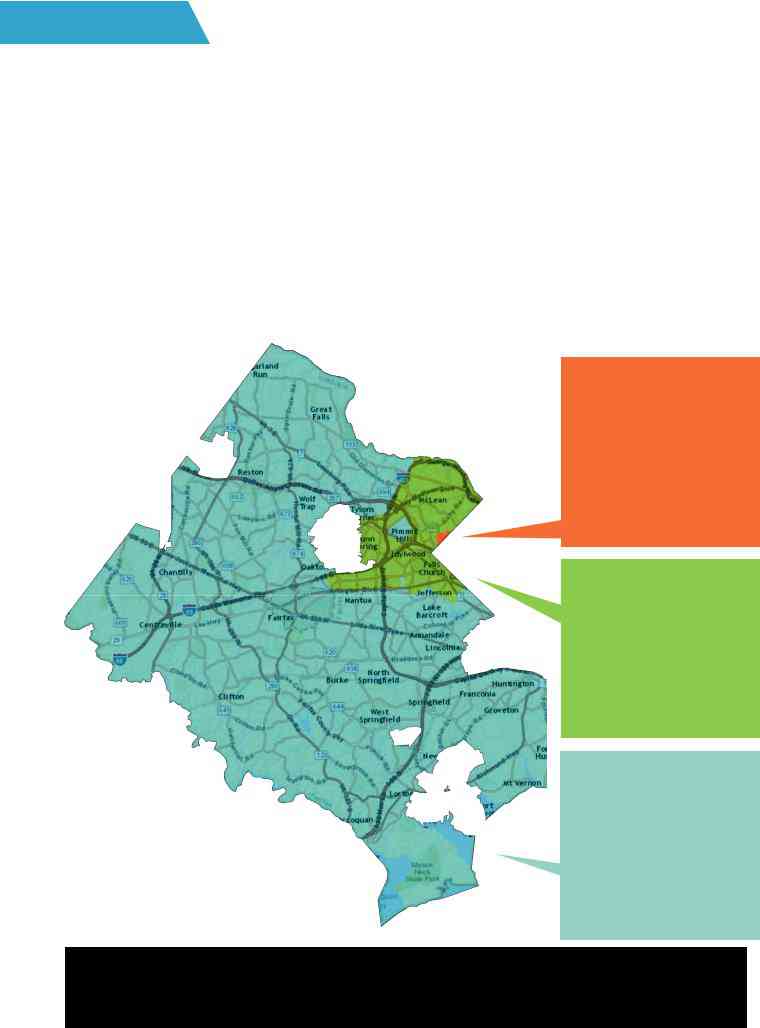
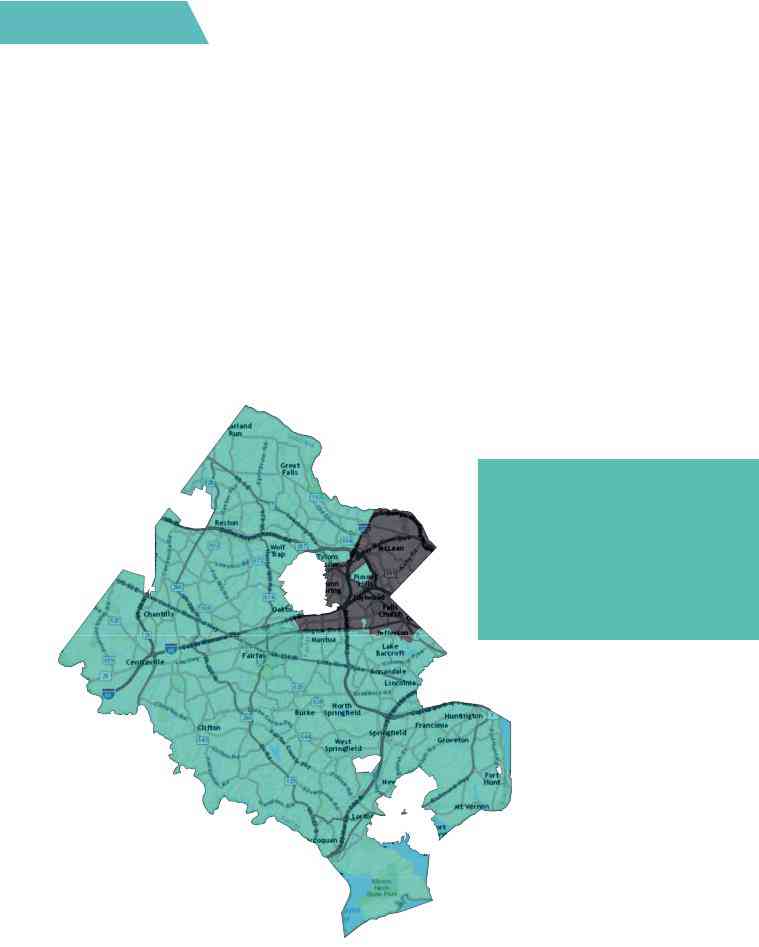
This water quality report provides information for all customers whose drinking water is provided by Fairfax Water. Our raw water comes from two sources and is treated at four treatment plants. You can use the map shown here to determine where your water comes from and what water quality data applies to your drinking water.
Note the color of the map in the area where you live. Use this color coding throughout the report to identify the information that relates to your drinking water. If you are still uncertain which service area is yours, or if you have additional questions, visit fairfaxwater.org or call
Customers in this service area receive water from the Potomac River that is treated at the Dalecarlia and McMillan water treatment plants, part of the Washington Aqueduct system, which are owned and operated by the U.S. Army Corps of Engineers. See report on page 22.
Customers in this service area receive water from the Potomac River that is treated at the Dalecarlia and McMillan water treatment plants, part of the Washington Aqueduct system, which are owned and operated by the U.S. Army Corps of Engineers. See report on page 18.
Customers in this service area receive water from the Potomac River and Occoquan Reservoir that is treated at the James J. Corbalis Jr.
or Frederick P. Griffith Jr. treatment plants, which are owned and operated by Fairfax Water. See report on page 14.
This report covers contaminants as required by the U.S. Environmental Protection Agency. For information on additional measurements, please refer to the “additional data” links on each of the service area pages.

2021 Annual Water Quality Report |
9 |
|
INFORMATION ABOUT SOURCE (RAW) WATER
SOURCES OF DRINKING WATER
The sources of all drinking water, both tap water and bottled water, include rivers, lakes, streams, ponds, reservoirs, springs, and groundwater. As water travels over the surface of the land or through the ground, it dissolves naturally occurring minerals and, in some cases, radioactive material. It can also pick up substances resulting from the presence of animals or from human activity. Contaminants that could be present in source water include:
- Microbial contaminants, such as viruses and bacteria that can come from sewage treatment plants, septic systems, agricultural livestock operations, and wildlife.
- Inorganic contaminants, such as salts and metals, that can be naturally occurring or can result from urban stormwater runoff, industrial or domestic wastewater discharges, oil and gas production, mining, or farming.
- Pesticides and herbicides, which can come from a variety of sources, such as agriculture or residential uses and urban stormwater runoff.
- Organic chemical contaminants, including synthetic and volatile organic chemicals, which are byproducts of industrial processes and petroleum production and also come from gas stations, urban stormwater runoff, septic systems, and decaying plants.
- Radioactive contaminants that can be naturally occurring or can be the result of oil and gas production or mining activities.
SOURCES OF YOUR WATER
Fairfax Water draws raw water from two primary sources: the Potomac River and the Occoquan Reservoir, which is fed by the Occoquan River. The Corbalis, Dalecarlia, and McMillan treatment plants treat water from the Potomac River. The Frederick P. Griffith Jr. Treatment Plant treats water from the Occoquan Reservoir. The four facilities that treat your water feed an interconnected distribution system.
SOURCE WATER ASSESSMENT AND PROTECTION
Under the provisions of the federal Safe Drinking Water Act, states are required to develop comprehensive source- water assessment programs that meet the following requirements:
- Identify watersheds that supply public tap water.
- Provide an inventory of contaminants present in the watershed.
- Assess susceptibility to contamination in the watershed.
Drinking water, including bottled water, may reasonably be expected to contain at least small amounts of some contaminants. The presence of contaminants does not necessarily indicate that water poses a health risk. More information about contaminants and potential health effects can be obtained by calling the EPA’s Safe Drinking Water Hotline at
10 |
2021 Annual Water Quality Report |
|
REDUCING EXPOSURE TO LEAD
Fairfax Water’s distribution system does not contain lead pipe because we have made an extensive effort to identify and replace any lead service connections in the older areas of our system. Depending on when it was constructed, your home’s plumbing may contain lead. The level of lead in water can increase when the water stands in contact with
FAIRFAX WATER’S SOURCES
The EPA has established an action level for lead in water of 15 parts per billion (ppb). When lead testing is performed as required by the EPA, 90% of the samples must contain less than 15 ppb. This is usually referred to as the 90th percentile results being less than 15 ppb.
The action level was not designed to measure health risks from water represented by individual samples. Rather, it is a statistical trigger value that, if exceeded, could require more treatment, public education, and possibly lead service line replacement where such lines exist. Fairfax Water does not have any lead service lines in its system.
Fairfax Water has been testing for lead in accordance with the EPA’s Lead and Copper Rule since 1992 and has regularly tested below the action level established in the rule. The next EPA- required monitoring will be conducted in 2023 for the “Legacy Service Areas” and in late summer 2021 for the Arlington special service area.

2021 Annual Water Quality Report |
11 |
|
WHERE DOES LEAD IN DRINKING WATER COME FROM?
The Potomac River and the Occoquan Reservoir (Fairfax Water’s sources) do not contain lead. In 1986, lead was banned from use in pipe and solder in home construction. In older homes where lead is present in pipe and solder connections, lead can dissolve into the water after the water sits for long periods. Some household plumbing components may contain a small amount of lead and can contribute to lead concentrations at the tap. Fairfax Water adds a
WHAT CAN I DO IN MY HOME TO REDUCE EXPOSURE TO LEAD IN MY WATER?
If present, elevated levels of lead can cause serious health problems, especially for pregnant women and young children. Lead in drinking water is primarily from materials and components associated with service lines and home plumbing. Fairfax Water is responsible for providing high- quality drinking water but cannot control the materials used in plumbing components in home construction.
If you are concerned about lead in your water, following these tips can help minimize the potential for lead exposure.
- Use only fresh, cold water for cooking and making baby formula.
- When your water has been sitting for several hours, flush your tap for 30 seconds to two minutes until the water becomes colder or until it reaches a steady temperature before using the water for drinking or cooking.
- Do not boil water to remove lead. Boiling water will not reduce lead.
- Some people choose to install a filter in their home. If you choose a water filter, follow these three rules:
- Choose a filter designed for the specific filtration desired (chlorine, lead, Cryptosporidium, etc.).
- Make sure the filter is approved by NSF International (nsf.org).
- Maintain the filter as directed.
-
Test your water for lead. For information about lead level testing, call the Fairfax Water Customer Service Department at
703-698-5800, TTY 711. - Regularly clean your faucet aerator. This removes particles from your household plumbing that could contain lead.
-
Consider buying
low-lead fixtures. Look for fixtures with the lowest lead content. Visit nsf.org to learn more.
FOR MORE INFORMATION
In addition to the tips above, information about lead in drinking water, testing methods, and steps you can take to minimize exposure can be found at epa.gov/safewater/lead or by calling the Safe Drinking Water Hotline at
12 |
2021 Annual Water Quality Report |
|
UNDERSTANDING WATER QUALITY TEST RESULTS
In general, drinking water standards are regulated by a maximum contaminant level (MCL) or a treatment technique (TT). For parameters with an MCL, the utility must sample at the required frequency, and results must be below the MCL. Depending on the parameter, the MCL could apply to individual results, an average of all results in a calendar year, or an average of all results in a calendar year for a specific site.
For parameters with a TT, the utility must sample at the required frequency and is required to take action (such as a change in treatment) if specified conditions are not met. Specified conditions vary per regulation. For instance, the TT for turbidity requires action to be taken if the percentage of filtered water turbidity results that are less than 0.3 Nephelometric Turbidity Units (NTU) falls below 95%. If this were to occur, the utility must perform corrective action until the specified conditions are met.
In the water quality test results on pages 14 - 25 and elsewhere in this report, you may find terms and abbreviations you are not familiar with. On the next page is a quick reference guide to help you better understand unfamiliar terms and abbreviations.
IMPORTANT INFORMATION FROM THE ENVIRONMENTAL
PROTECTION AGENCY
Drinking Water and People With Weakened Immune Systems
Some people may be more vulnerable to contaminants in drinking water than the general population. Immunocompromised persons such as those with cancer who are undergoing chemotherapy, those who have undergone organ transplants, those with HIV/AIDS or other immune system disorders; some elderly; and infants can be particularly at risk from infections. If you are in this at-risk group, you should seek advice about drinking water from your health care provider. The EPA and the Centers for Disease Control guidelines on appropriate means to lessen the risk of infection from Cryptosporidium and other microbial contaminants are available from the Safe Drinking Water Hotline at 800-426-4791.

2021 Annual Water Quality Report |
13 |
|
KEY TERMINOLOGY AND ABBREVIATIONS
90th percentile – Represents the highest value found out of 90% of the samples taken in a representative group. If the 90th percentile is greater than the action level, it will trigger a treatment or additional requirements that a water system must follow.
AL or action level – The concentration of a contaminant that, if exceeded, requires a water system to carry out an additional treatment or other action.
LRAA or locational running annual average – An ongoing annual average calculation of data at one specific location; not based on individual result.
MCL or maximum contaminant level – The highest level of a contaminant that is allowed in drinking water. MCLs are set as close to the MCLGs as feasible using the best available treatment technology.
MCLG or maximum contaminant level goal – The level of a contaminant in drinking water below which there is no known or expected risk to health. MCLGs allow for a margin of safety.
MRDL or maximum residual disinfectant level – The highest level of a disinfectant allowed in drinking water.
MRDLG or maximum residual disinfectant level goal – The level of a disinfectant in drinking water below which there is no known or expected risk to health.
NA or not applicable – Does not apply to this subject or in this scenario.
ND or non-detect – A level at which there is an inability to detect an analyte because it is indistinguishable from the background signal.
NTU or nephelometric turbidity units – A measure of cloudiness or haziness of water.
pCi/L or picocuries per liter – Radioactivity concentration unit.
ppb or parts per billion – One ppb corresponds to one penny in $10,000,000.
ppm or parts per million – One ppm corresponds to one penny in $10,000.
QRAA or quarterly running annual average – An ongoing annual average calculation of data from the most recent four quarters.
- or treatment technique – A required process intended to reduce the level of a contaminant in drinking water.
14 |
2021 Annual Water Quality Report |
|
2020 WATER QUALITY TABLES
FAIRFAX WATER CUSTOMERS IN THE LEGACY AND CITY OF FAIRFAX SERVICE AREAS
The Water Quality Laboratory at Fairfax Water monitors for more than 286 different parameters, from alkalinity to zinc! Some of the monitoring is required for regulatory purposes, some for process and emerging technology, and even more for customer information. In 2020, some 43,000 data points were gathered from 11,000 samples of water for these 286 parameters. The tables on pages
For more water quality information, visit the Fairfax Water website at fairfaxwater.org/
Customers in this service area receive water from the Potomac River and Occoquan Reservoir that is treated at the James J. Corbalis Jr. or Frederick P. Griffith Jr. treatment plants, which are owned and operated by Fairfax Water.

2021 Annual Water Quality Report |
15 |
|
SUMMARY OF FINISHED WATER CHARACTERISTICS
|
Ideal Goal |
Highest Level |
Range |
|
|
|
Components |
Allowed |
(Individual |
Violation |
Common Sources in Drinking Water |
||
(EPA MCLG*) |
||||||
|
(EPA MCL*) |
Results) |
|
|
||
|
|
|
|
|||
|
|
|
|
|
|
|
Barium (ppm) |
2 |
2 |
0.026 - 0.042 |
No |
Discharge of drilling wastes; discharge |
|
from metal refineries; erosion from natural |
||||||
|
|
|
|
|
deposits |
|
|
|
|
|
|
|
|
Beta/photon particles |
0 |
50 |
ND - 4.78 |
No |
Decay of natural and |
|
(pCi/L) 1 |
||||||
|
|
|
|
|
||
|
|
|
|
|
|
|
Radium 226/228 |
0 |
5 |
ND - 0.19 |
No |
Decay of natural and |
|
(pCi/L ) 1 |
||||||
|
|
|
|
|
||
|
|
|
|
|
|
|
|
|
|
|
|
Water additive that promotes strong |
|
Fluoride (ppm) |
4 |
4 |
0.1 - 0.8 |
No |
teeth; erosion of natural deposits; |
|
discharge from fertilizer and aluminum |
||||||
|
|
|
|
|
||
|
|
|
|
|
factories |
|
|
|
|
|
|
|
|
Nitrite [as Nitrogen] |
|
|
|
|
Runoff from fertilizer use; leaching from |
|
1 |
1 |
ND - 0.013 |
No |
septic tanks, sewage; erosion of natural |
||
(ppm) |
||||||
|
|
|
|
deposits |
||
|
|
|
|
|
||
|
|
|
|
|
|
|
Nitrate [as Nitrogen] |
|
|
|
|
Runoff from fertilizer use; leaching from |
|
10 |
10 |
0.57 - 1.45 |
No |
septic tanks, sewage; erosion of natural |
||
(ppm) |
||||||
|
|
|
|
deposits |
||
|
|
|
|
|
||
|
|
|
|
|
|
|
|
|
|
|
|
Erosion of natural deposits; Runoff from |
|
Sodium (ppm)2 |
NA |
NA |
9.2 - 27.8 |
NA |
road deicing chemicals; Discharge from |
|
industrial sources; Wastewater treatment |
||||||
|
|
|
|
|
||
|
|
|
|
|
plant effluent |
|
|
|
|
|
|
|
|
Uranium (ppb) 1 |
0 |
30 |
ND - 0.09 |
No |
Erosion of natural deposits |
|
|
|
|
|
|
|
*Unless otherwise specified, MCLG and MCL apply to an individual result.
- Results for beta/photon emitters, Radium 226/228, and uranium were below the minimum detection limits prescribed in the EPA Consumer Confidence Rule as stated in 40 CFR 141.151 (d) and are not required for CCR reporting; however, Fairfax Water follows laboratory convention for reporting radiological sample results to the laboratory detection limit.
- There are no regulatory State or Federal limits established for this parameter.
Total Organic
Carbon
Treatment Technique |
Range (Monthly |
Violation |
Common Sources in Drinking Water |
|
(TT) 3 |
Ratio QRAA) |
|||
|
|
|
|
|
Monthly ratio |
1.1 - 1.6 |
No |
Naturally present in the |
|
QRAA > 1 |
environment |
|||
|
|
|||
|
|
|
|
Total organic carbon has no health effects; however it does provide a medium for the formation of disinfection byproducts. These
3 Compliance is based upon a quarterly running annual average (QRAA) of the monthly ratios of actual total organic carbon removal between the source water and the treated water in a calendar year (not based on an individual result).
16 |
2021 Annual Water Quality Report |
|
Turbidity
Highest Level |
Highest Individual |
|
Common Sources in |
|
Allowed |
Violation |
|||
Result for Year |
Drinking Water |
|||
(EPA MCL*) |
|
|||
|
|
|
||
|
|
|
|
|
1 NTU |
0.28 |
No |
Soil runoff |
|
|
|
|
|
|
Treatment Technique |
Lowest Monthly % |
|
|
|
of Samples Meeting |
Violation |
Common Sources in Drinking Water |
||
(TT) |
||||
≤0.3 NTU Limit |
|
|
||
|
|
|
||
|
|
|
|
|
Turbidity of filtered water |
100% |
No |
|
|
must be ≤ 0.3 NTU in |
Soil runoff |
|||
95% or more samples |
|
|
|
|
|
|
|
|
Turbidity levels are measured during the treatment process after the water has been filtered but before disinfection.
- Unless otherwise specified, MCLG and MCL apply to an individual result.
E. coli
Ideal |
Highest Level Allowed |
Number of Positive |
|
|
4 |
Common Sources in |
|
Goal (EPA |
E.coli samples this |
Violation |
Assessment Required |
||||
(EPA MCL*)4 |
Drinking Water |
||||||
MCLG)* |
year |
|
|
||||
|
|
|
|
|
|||
|
|
|
|
|
|
|
|
|
Repeat sample is E.coli positive |
|
|
|
|
|
|
|
OR |
|
|
|
|
|
|
|
Routine sample is E.coli positive |
|
|
|
|
|
|
|
followed by repeat sample that is |
|
|
|
|
|
|
|
total coliform positive |
|
|
|
|
|
|
|
OR |
Routine = 0 |
|
|
|
Human and animal |
|
0 |
System fails to take all required |
|
No |
No |
|
||
|
|
fecal waste |
|||||
|
repeat samples following E.coli |
Repeat = 0 |
|
|
|
||
|
|
|
|
|
|||
|
positive routine sample |
|
|
|
|
|
|
|
OR |
|
|
|
|
|
|
|
System fails to analyze for E.coli |
|
|
|
|
|
|
|
when any repeat sample tested |
|
|
|
|
|
|
|
positive for total coliform |
|
|
|
|
|
|
|
|
|
|
|
|
|
4 If an E. coli MCL violation occurs, an assessment to determine the cause would be performed and corrective action taken.
- Unless otherwise specified, MCLG and MCL apply to an individual result.
Metals |
Action Level § |
90th Percentile |
Number of Sites |
Violation |
Common Sources in Drinking Water |
|
Result |
§ |
Above Action Level § |
||||
|
|
|
|
|
|
Corrosion of household plumbing |
Copper (ppm) |
1.3 |
0.094 |
|
0 |
No |
systems; erosion of natural |
|
|
|
|
|
|
deposits |
|
|
|
|
|
|
|
Lead (ppb) |
15 |
1.00 |
|
1 |
No |
Corrosion of household plumbing systems; |
|
erosion of natural deposits |
|||||
|
|
|
|
|
|
|
|
|
|
|
|
|
|
- Refer to definitions on page 13 for full description of terms.
2021 Annual Water Quality Report |
17 |
|
|
|
|
|
|
Fairfax Water’s Frederick P. Griffith Jr. Water Treatment Plant
Disinfection |
Ideal Goal |
Highest Level |
Highest |
Range |
Violation |
Common Sources in Drinking |
|
Byproducts |
(EPA MCLG*) |
Allowed |
LRAA for |
(Individual |
Water |
||
(EPA MCL*) 5 |
All Sites |
Results) |
|
||||
|
|
|
|
|
|
|
|
Total Trihalomethanes |
0 |
LRAA = 80 |
44.4 |
8.1 - 75.9 |
No |
Byproduct of drinking water |
|
(ppb) |
disinfection |
||||||
|
|
|
|
|
|||
|
|
|
|
|
|
|
|
Haloacetic Acids (5) |
0 |
LRAA = 60 |
31.9 |
3.0 - 54.1 |
No |
Byproduct of drinking water |
|
(ppb) |
disinfection |
||||||
|
|
|
|
|
|||
|
|
|
|
|
|
|
5 Compliance is based on
Total Chlorine (ppm)
Ideal Goal |
Highest Level |
Highest |
Range |
|
|
|
Allowed |
(Individual |
Violation |
Common Sources in Drinking Water |
|||
(EPA MRDLG) |
QRAA |
|||||
(EPA MRDL) 5 |
Results) |
|
|
|||
|
|
|
|
|
|
|
4.0 |
QRAA = 4.0 |
2.9 |
1.0 - 4.0 |
No |
Water additive used to control |
|
microbes |
||||||
|
|
|
|
|
||
|
|
|
|
|
|
5 Compliance is based on a quarterly running annual average (QRAA) of all the regulatory chlorine results in a calendar year (not based on an individual result).
18 |
2021 Annual Water Quality Report |
|
2020 WATER QUALITY TABLES
FAIRFAX WATER CUSTOMERS IN THE CITY OF FALLS CHURCH SERVICE AREA
Even though you are a Fairfax Water customer, your water is supplied by the Washington Aqueduct Division of the U.S. Army Corps of Engineers. The tables on pages
For more information about your water quality, visit nab.usace.army.mil/Missions/Washington-
Customers in this service area receive water from the Potomac River that is treated at the McMillan and Dalecarlia water treatment plants, part of the Washington Aqueduct system, which is owned and operated by the U.S. Army Corps of Engineers.

2021 Annual Water Quality Report |
19 |
|
SUMMARY OF FINISHED WATER CHARACTERISTICS
Components |
Ideal Goal |
Highest Level |
Range |
|
|
|
Allowed |
(Individual |
Violation |
Common Sources in Drinking Water |
|||
(EPA MCLG*) |
||||||
|
(EPA MCL*) |
Results) |
|
|
||
|
|
|
|
|||
|
|
|
|
|
|
|
|
|
|
|
|
Erosion of natural deposits; runoff |
|
Arsenic (ppb) |
0 |
10 |
ND - 0.4 |
No |
from orchards; runoff from glass |
|
|
|
|
|
|
and electronics production wastes |
|
|
|
|
|
|
|
|
Barium (ppm) |
|
|
|
|
Discharge of drilling wastes; |
|
2 |
2 |
0.03 - 0.05 |
No |
discharge from metal refineries; |
||
|
|
|
|
|
erosion from natural deposits |
|
|
|
|
|
|
|
|
Beta/photon particles |
0 |
50 |
ND - 4 |
|
Decay of natural and |
|
(pCi/L) 1 |
No |
deposits |
||||
|
|
|
||||
|
|
|
|
|
|
|
Radium 226/228 |
0 |
5 |
ND - 4 |
No |
Decay of natural and |
|
(pCi/L) 1 |
deposits |
|||||
|
|
|
|
|||
|
|
|
|
|
|
|
|
|
|
|
|
Water additive that promotes strong |
|
Fluoride (ppm) |
4 |
4 |
0.6 - 0.8 |
No |
teeth; erosion of natural deposits; |
|
|
discharge from fertilizer and |
|||||
|
|
|
|
|
||
|
|
|
|
|
aluminum factories |
|
|
|
|
|
|
|
|
Gross Alpha Particles |
0 |
15 |
ND - 6.9 |
No |
Decay of natural and |
|
pCi/L |
deposits |
|||||
|
|
|
|
|||
|
|
|
|
|
|
|
Nitrate [as Nitrogen] |
|
|
|
|
Runoff from fertilizer use; leaching |
|
10 |
10 |
0.5 - 2.0 |
No |
from septic tanks; sewage; erosion of |
||
(ppm) |
||||||
|
|
|
|
natural deposits |
||
|
|
|
|
|
||
|
|
|
|
|
|
|
|
|
|
|
|
Erosion of natural deposits; Runoff from |
|
Sodium (ppm)2 |
NA |
NA |
12 - 43 |
NA |
road deicing chemicals; Discharge from |
|
industrial sources; Wastewater treatment |
||||||
|
|
|
|
|
||
|
|
|
|
|
plant effluent |
|
|
|
|
|
|
|
*Unless otherwise specified, MCLG and MCL apply to an individual result.
- Results for atrazine, beta/photon emitters, and uranium were below the minimum detection limits prescribed in the EPA Consumer Confidence Rule as stated in 40 CFR 141.151 (d) and are not required for CCR reporting; however, Fairfax Water follows laboratory convention for reporting radiological sample results to the laboratory detection limit.
- There are no regulatory State or Federal limits established for this parameter.
Total Organic
Carbon
Treatment Technique |
Range (QRAA of |
Violation |
Common Sources in |
(TT) 3 |
Monthly Ratio) |
Drinking Water |
|
Monthly Ratio QRAA >1 |
1.2 - 1.4 |
No |
Naturally present in the environment |
|
|
|
|
Total organic carbon has no health effects; however, it provides a medium for the formation of disinfection byproducts. These byproducts include trihalomethanes and haloacetic acids.
3 Compliance is based on a quarterly running annual average (QRAA) of the monthly ratios of actual total organic carbon removal between the source water and the treated water in a calendar year (not based on an individual result).
20 |
2021 Annual Water Quality Report |
|
Turbidity
Highest Level |
Highest Individual |
|
|
|
Allowed |
Violation |
Common Sources in Drinking Water |
||
Result for Year |
||||
(EPA MCL*) |
|
|
||
|
|
|
||
|
|
|
|
|
1 NTU |
0.15 |
No |
Soil runoff |
|
|
|
|
|
|
Treatment Technique |
Lowest Monthly % |
|
|
|
of Samples Meeting |
Violation |
Common Sources in Drinking Water |
||
(TT) |
||||
≤0.3 NTU Limit |
|
|
||
|
|
|
||
|
|
|
|
|
Turbidity of filtered |
|
|
|
|
water must be ≤0.3 |
100% |
No |
Soil runoff |
|
NTU in 95% or more |
||||
|
|
|
||
samples |
|
|
|
|
|
|
|
|
Turbidity levels are measured during the treatment process after the water has been filtered but before disinfection.
- Unless otherwise specified, MCLG and MCL apply to an individual result.
Washington Aqueduct Failure to Comply with Turbidity Monitoring Requirements
We are required to monitor your drinking water for specific contaminants on a regular basis. Results of regular monitoring are an indicator of whether or not our drinking water meets health standards. For 17 hours on June
This is not an emergency and you do not need to take any action. Washington Aqueduct has improved its procedures to prevent a similar situation from recurring.
E. coli
Ideal |
|
Number of |
|
|
|
|
Goal |
Highest Level Allowed |
|
Assessment |
Common Sources in |
||
Positive E.coli |
Violation |
|||||
(EPA |
(EPA MCL)* |
Required 4 |
Drinking Water |
|||
samples this year |
|
|||||
MCLG*) |
|
|
|
|
||
|
|
|
|
|
||
|
|
|
|
|
|
|
|
Repeat sample is E. coli positive |
|
|
|
|
|
|
OR |
|
|
|
|
|
|
Routine sample is E. coli |
|
|
|
|
|
|
positive followed by Repeat |
|
|
|
|
|
|
sample that is Total Coliform |
|
|
|
|
|
|
positive |
Routine = 0 |
|
|
|
|
|
OR |
|
|
Human and animal fecal |
||
0 |
|
No |
No |
|||
System fails to take all required |
|
waste |
||||
|
Repeat = 0 |
|
|
|||
|
repeat samples following E. coli |
|
|
|
||
|
|
|
|
|
||
|
positive routine sample |
|
|
|
|
|
|
OR |
|
|
|
|
|
|
System fails to analyze for E. |
|
|
|
|
|
|
coli when any repeat sample |
|
|
|
|
|
|
tested positive for total coliform |
|
|
|
|
|
|
|
|
|
|
|
4 If an E. coli MCL violation occurs, an assessment to determine the cause would be performed and corrective action taken.
- Unless otherwise specified, MCLG and MCL apply to an individual result.

|
2021 Annual Water Quality Report |
21 |
||||
|
|
|
||||
|
|
|
|
|
|
|
Metals |
Action |
90th Percentile |
Number of Sites |
Violation |
Common Sources in |
|
Level § |
Result § |
Above Action Level § |
Drinking Water |
|
||
|
|
|
|
|
|
|
|
|
|
|
|
Corrosion of household |
|
Copper (ppm) |
1.3 |
0.094 |
0 |
No |
plumbing systems; erosion of |
|
|
|
|
|
|
natural deposits |
|
|
|
|
|
|
|
|
|
|
|
|
|
Corrosion of household |
|
Lead (ppb) |
15 |
1.00 |
1 |
No |
plumbing systems; erosion of |
|
|
|
|
|
|
natural deposits |
|
|
|
|
|
|
|
|
§ Refer to definition on page 13 for full description of terms.
Disinfection |
|
Highest |
|
Highest |
Range |
|
|
Ideal Goal |
Level |
|
|
Common Sources in |
|||
|
LRAA for |
(Individual |
Violation |
||||
Byproducts |
(EPA MCLG*) |
Allowed |
|
Drinking Water |
|||
|
All Sites |
Results) |
|
||||
|
|
(EPA MCL*) |
5 |
|
|
||
|
|
|
|
|
|
||
|
|
|
|
|
|
|
|
Total Trihalomethanes |
0 |
LRAA = 80 |
|
44.4 |
8.1 - 75.9 |
No |
Byproduct of drinking water |
(ppb) |
|
disinfection |
|||||
|
|
|
|
|
|
||
|
|
|
|
|
|
|
|
Haloacetic Acids |
0 |
LRAA = 60 |
|
31.9 |
3.0 - 54.1 |
No |
Byproduct of drinking water |
(5) (ppb) |
|
disinfection |
|||||
|
|
|
|
|
|
||
|
|
|
|
|
|
|
|
- Unless otherwise specified, MCLG and MCL apply to an individual result.
5 Compliance is based upon
Total Chlorine (ppm)
Ideal Goal |
Highest Level |
Highest |
Range |
|
Common Sources in |
|
Allowed |
(Individual |
Violation |
||||
(EPA MRDLG) |
QRAA |
Drinking Water |
||||
(EPA MRDL) 6 |
Results) |
|
||||
|
|
|
|
|
|
|
4.0 |
QRAA = 4.0 |
2.9 |
1.0 - 4.0 |
No |
Water additive used to control |
|
microbes |
||||||
|
|
|
|
|
||
|
|
|
|
|
|
6 Compliance is based on a quarterly running annual average (QRAA) of all the regulatory chlorine results in a calendar year (not based on an individual result).

22 |
2021 Annual Water Quality Report |
|
2020 WATER QUALITY TABLES
FAIRFAX WATER CUSTOMERS IN THE ARLINGTON SPECIAL SERVICE AREA
Even though you are a Fairfax Water customer, your water is supplied by the Washington Aqueduct Division of the U.S. Army Corps of Engineers. The tables on pages
For more information about your water quality, visit nab.usace.army.mil/Missions/Washington-
SUMMARY OF FINISHED WATER CHARACTERISTICS
Components |
Ideal Goal |
Highest Level |
Range |
|
|
|
Allowed |
(Individual |
Violation |
Common Sources in Drinking Water |
|||
(EPA MCLG*) |
||||||
|
(EPA MCL*) |
Results) |
|
|
||
|
|
|
|
|||
|
|
|
|
|
|
|
|
|
|
|
|
Discharge of drilling wastes; |
|
Barium (ppm) |
2 |
2 |
0.03 - 0.05 |
No |
discharge from metal refineries; |
|
|
|
|
|
|
erosion from natural deposits |
|
|
|
|
|
|
|
|
Beta/photon particles |
0 |
50 |
ND - 4.0 |
No |
Decay of natural and |
|
(pCi/L) 1 |
deposits |
|||||
|
|
|
|
|||
|
|
|
|
|
|
|
Radium 226/228 |
0 |
5 |
ND - 4.0 |
No |
Decay of natural and |
|
(pCi/L) |
deposits |
|||||
|
|
|
|
|||
|
|
|
|
|
|
|
|
|
|
|
|
Water additive that promotes strong |
|
Fluoride (ppm) |
4 |
4 |
0.06 - 0.8 |
No |
teeth; erosion of natural deposits; |
|
discharge from fertilizer and aluminum |
||||||
|
|
|
|
|
||
|
|
|
|
|
factories |
|
|
|
|
|
|
|
|
Gross Alpha Particles |
0 |
15 |
ND - 6.9 |
No |
Decay of natural and |
|
(pCi/L) |
deposits |
|||||
|
|
|
|
|||
|
|
|
|
|
|
|
Nitrate [as Nitrogen] |
10 |
10 |
|
|
Runoff from fertilizer use; leaching from |
|
0.5 - 2.0 |
No |
septic tanks, sewage; erosion of natural |
||||
(ppm) |
||||||
|
|
|
|
deposits |
||
|
|
|
|
|
||
|
|
|
|
|
|
|
Sodium (ppm)2 |
NA |
NA |
12 - 43 |
NA |
Erosion of natural deposits; Runoff from road |
|
deicing chemicals; Discharge from industrial |
||||||
|
|
|
|
|
sources; Wastewater treatment plant effluent |
|
|
|
|
|
|
|
*Unless otherwise specified, MCLG and MCL apply to an individual result.
- Results for beta/photon emitters, radium 226/228, and uranium were below the minimum detection limits prescribed in the EPA Consumer Confidence Rule as stated in 40 CFR 141.151 (d) and are not required for CCR reporting; however, Fairfax Water follows laboratory convention for reporting radiological sample results to the laboratory detection limit.
- There are no regulatory State or Federal limits established for this parameter.
2021 Annual Water Quality Report |
23 |
|
Customers in this service area receive water from the Potomac River that is treated at the Dalecarlia and McMillan water treatment plants, part of the Washington Aqueduct system, which is owned and operated by the U.S. Army Corps of Engineers.
Turbidity
Highest Level Allowed |
Highest Individual |
Violation |
Common Sources in Drinking Water |
|
(EPA MCL*) |
Result for Year |
|||
|
|
|||
|
|
|
|
|
1 NTU |
0.07 |
No |
Soil runoff |
|
|
|
|
|
|
Treatment Technique |
Lowest Monthly % of |
|
|
|
Samples Meeting ≤0.3 |
Violation |
Common Sources in Drinking Water |
||
(TT) |
||||
NTU Limit |
|
|
||
|
|
|
||
|
|
|
|
|
Turbidity of filtered |
|
|
|
|
water must be ≤0.3 |
100% |
No |
Soil runoff |
|
NTU in 95% or more |
||||
|
|
|
||
samples |
|
|
|
|
|
|
|
|
- Unless otherwise specified, MCL applies to an individual result.
Turbidity levels are measured during the treatment process after the water has been filtered, but before disinfection.
Washington Aqueduct Failure to Comply with Turbidity Monitoring Requirements
We are required to monitor your drinking water for specific contaminants on a regular basis. Results of regular monitoring are an indicator of whether or not our drinking water meets health standards. For 17 hours on June
This is not an emergency and you do not need to take any action. Washington Aqueduct has improved its procedures to prevent a similar situation from recurring.
24 |
2021 Annual Water Quality Report |
|
E. coli
Ideal |
|
Number of |
|
|
|
|
Goal |
Highest Level Allowed |
|
|
Common Sources |
||
Positive E.coli |
Violation |
Assessment Required 2 |
||||
(EPA |
(EPA MCL)* |
in Drinking Water |
||||
samples this year |
|
|
||||
MCLG)* |
|
|
|
|
||
|
|
|
|
|
||
|
|
|
|
|
|
|
|
Repeat sample is E. coli positive |
|
|
|
|
|
|
OR |
|
|
|
|
|
|
Routine sample is E. coli |
|
|
|
|
|
|
positive followed by repeat |
|
|
|
|
|
|
sample that is total coliform |
|
|
|
|
|
|
positive |
Routine = 0 |
|
|
Human and |
|
|
OR |
|
|
|||
0 |
|
No |
No |
animal fecal |
||
System fails to take all required |
|
|||||
|
Repeat = 0 |
|
|
waste |
||
|
repeat samples following E. coli |
|
|
|||
|
|
|
|
|
||
|
positive routine sample |
|
|
|
|
|
|
OR |
|
|
|
|
|
|
System fails to analyze for E. |
|
|
|
|
|
|
coli when any repeat sample |
|
|
|
|
|
|
tested positive for total coliform |
|
|
|
|
|
|
|
|
|
|
|
2 If an E. coli MCL violation occurs, an assessment to determine the cause would be performed and corrective action taken.
- Unless otherwise specified, MCLG and MCL applies to an individual result.
Metals |
Action |
90th Percentile |
Number of Sites Above |
Violation |
Common Sources in |
|
Level |
§ |
Result § |
Action Level § |
Drinking Water |
||
|
|
|
|
|
|
Corrosion of household plumbing |
Copper (ppm) 3 |
1.3 |
|
0.021 |
0 |
No |
systems; erosion of natural |
|
|
|
|
|
|
deposits |
|
|
|
|
|
|
|
|
|
|
|
|
|
Corrosion of household plumbing |
Lead (ppb) 3 |
15 |
|
0.27 |
0 |
No |
systems; erosion of natural |
|
|
|
|
|
|
deposits |
|
|
|
|
|
|
|
- Refer to definitions on page 13 for full description of terms
3 As granted by the state, Fairfax Water is on reduced monitoring for these parameters based upon historical results. The results above are taken from the most recent monitoring period in 2018.
Disinfection |
Ideal Goal |
Highest |
Highest |
Range |
|
Common Sources in |
|
Level |
|
||||||
LRAA for |
(Individual |
Violation |
|||||
Byproducts |
(EPA MCLG*) |
Allowed |
Drinking Water |
||||
all sites |
Results) |
|
|||||
|
|
(EPA MCL*) 4 |
|
|
|||
|
|
|
|
|
|
|
|
Total Trihalomethanes |
0 |
LRAA = 80 |
45.5 |
23.3 - |
No |
Byproduct of drinking water disinfection |
|
(ppb) |
72.6 |
||||||
|
|
|
|
|
|||
|
|
|
|
|
|
|
|
Haloacetic Acids |
0 |
LRAA = 60 |
34.2 |
14.2 - |
No |
Byproduct of drinking water disinfection |
|
(5) (ppb) |
51.7 |
||||||
|
|
|
|
|
|||
|
|
|
|
|
|
|
- Unless otherwise specified, MCLG and MCL apply to an individual result.
4 Compliance is based upon
2021 Annual Water Quality Report |
25 |
|
Total Chlorine
(ppm)
Ideal |
|
|
Range |
|
Common Sources in |
|
Goal |
Highest Level Allowed |
|
|
|||
Highest QRAA |
(Individual |
Violation |
||||
(EPA |
(EPA MRDL) 5 |
Drinking Water |
||||
|
Results) |
|
||||
MRDLG) |
|
|
|
|
||
|
|
|
|
|
||
|
|
|
|
|
|
|
4.0 |
QRAA = 4 |
2.9 |
1.9 - 3.5 |
No |
Water additive used to |
|
control microbes |
||||||
|
|
|
|
|
||
|
|
|
|
|
|
5 Compliance is based on a quarterly running annual average (QRAA) of all the regulatory chlorine results in a calendar year (not based on an individual result).
Total Organic
Carbon
Treatment Technique |
Range (QRAA of |
Violation |
Common Sources in |
|
(TT) 6 |
Monthly Ratio) |
Drinking Water |
||
|
|
|
|
|
Monthly Ratio QRAA >1 |
1.2 - 1.3 |
No |
Naturally present in the |
|
environment |
||||
|
|
|
||
|
|
|
|
Total organic carbon has no health effects; however, it provides a medium for the formation of disinfection byproducts.
These byproducts include trihalomethanes and haloacetic acids.
6 Compliance is based upon a quarterly running annual average (QRAA) of the monthly ratios of actual total organic carbon removal between the source water and the treated water in a calendar year (not based on an individual result).
Potomac River
26 |
2021 Annual Water Quality Report |
|
2020 Cryptosporidium Monitoring Statement
Cryptosporidium is a microbial pathogen sometimes found in surface water throughout the United States. Although filtration removes Cryptosporidium, the most commonly used filtration methods cannot guarantee 100 percent removal. Fairfax Water consistently maintains its filtration process in accordance with regulatory guidelines to maximize removal efficiency. Our monitoring indicates the occasional presence of these organisms in the source water. Current test methods do not allow us to determine whether the organisms are dead or if they are capable of causing disease.
Ingestion of Cryptosporidium may cause cryptosporidiosis, an abdominal infection. Symptoms of infection include nausea, diarrhea and abdominal cramps. Most healthy individuals can overcome the disease within a few weeks. However,
Cryptosporidium must be ingested in order to cause disease. It may be spread through means other than drinking water, such as other people, animals, water, swimming pools, fresh food, soils and any surface that has not been sanitized after exposure to feces.
Fairfax Water has completed monitoring the Potomac River and Occoquan Reservoir for compliance with Round 2 of the EPA Long Term 2 Enhanced Surface Water Treatment Rule (LT2ESWTR Round 2). The EPA created this rule to provide for increased protection against microbial pathogens, such as Cryptosporidium, in public water systems that use surface water sources. Fairfax Water’s LT2ESWTR Round 2 monitoring program began in April 2015 and involved the collection of one sample from water treatment plant sources
2021 Annual Water Quality Report |
27 |
|
each month for a period of two years. Monitoring for compliance with the LT2ESWTR Round 2 was completed in March 2017.
Under the LT2ESWTR Round 2, the average Cryptosporidium concentration determines whether additional treatment measures are needed. A mean Cryptosporidium concentration of 0.075 oocysts/Liter triggers additional water treatment measures. Fairfax Water’s raw water Cryptosporidium concentrations were below this threshold. Results for LT2ESWTR Round 2 monitoring for the period of
LEGACY AND CITY OF FAIRFAX SERVICE AREAS
Source (Before Treatment) |
Mean Cryptosporidium |
Final Bin Assignment Under |
|
concentration (oocysts/Liter) |
LT2ESWTR Round 2 |
||
|
|||
|
|
|
|
Potomac River |
0.000 |
Bin 1 |
|
(no additional treatment needed) |
|||
|
|
||
Occoquan Reservoir |
0.007 |
Bin 1 |
|
(no additional treatment needed) |
|||
|
|
CITY OF FALLS CHURCH AND ARLINGTON SPECIAL SERVICE AREAS
Cryptosporidium was monitored in the source water monthly in 2020 from January to November. Cryptosporidium oocysts were detected in two samples collected at the Great Falls Intakes in January and February 2020, with both samples having a concentration of 0.186 oocysts/L. Based upon the system- specific requirements, no additional treatment measures were required at the Washington Aqueduct water treatment plants.
28 |
2021 Annual Water Quality Report |
|
2020 UNREGULATED CONTAMINANT MONITORING RULE (UCMR 4) DATA
The 1996 amendments to the Safe Drinking Water Act (SDWA) require that once every five years, the U.S. Environmental Protection Agency (EPA) issue a new list of no more than 30 unregulated contaminants to be monitored by public water systems (PWSs). The Unregulated Contaminant Monitoring Rule (UCMR) provides EPA and other interested parties with scientifically valid data on the occurrence of contaminants in drinking water. This national survey is one of the primary sources of information on occurrence and levels of exposure that the Agency uses to develop regulatory decisions for contaminants in the public drinking water supply.
The “Revisions to the Unregulated Contaminant Monitoring Rule (UCMR 4) for Public Water Systems and Announcement of Public Meeting” was published in the Federal Register on December 20, 2016 (81 FR 92666). UCMR 4 monitoring began in 2018 and concluded in 2020. The full scope of the monitoring includes monitoring for a total of 30 chemical contaminants: 10 cyanotoxins (nine cyanotoxins and one cyanotoxin group) and 20 additional contaminants (two metals, eight pesticides plus one pesticide manufacturing byproduct, three brominated haloacetic acid [HAA] disinfection byproducts groups, three alcohols, and three semivolatile organic chemicals [SVOCs]).
WHAT ARE THE ENVIRONMENTAL AND PUBLIC HEALTH BENEFITS?
The UCMR program provides the EPA and other interested parties with nationally representative data on the occurrence of particular contaminants in drinking water, the number of people potentially being exposed and an estimate of the levels of that exposure. In accordance with Safe Drinking Water Act, EPA will consider the occurrence data from UCMR 4 and other sources, along with the peer reviewed health effects assessments, to support a regulatory determination on whether to initiate the process to develop a national primary drinking water regulation.
For more information on UCMR 4, visit EPA’s UCMR web page (epa.gov/dwucmr) or call the Safe Drinking Water Hotline at
2021 Annual Water Quality Report |
29 |
|
UNREGULATED COMPONENTS DETECTED IN 2020 UCMR 4 MONITORING
Components (ppb) |
Average |
Minimum |
Maximum |
Use or Environmental Source |
|
|
|
|
|
|
|
|
|
Naturally occurring element; commercially available |
|
|
|
|
in combination with other elements and minerals; |
Manganese |
0.52 |
ND |
3.10 |
used in steel production, fertilizer, batteries, |
|
|
|
|
and fireworks; drinking water and wastewater |
|
|
|
|
treatment chemical; essential nutrient |
|
|
|
|
|
Potomac River
30 |
2021 Annual Water Quality Report |
|
Facts About Poly- and Perfluoroalkyl
Substances (PFAS)
PFAS are a group of over 6,000
To learn more and view Fairfax Water’s most recent PFAS results, visit fairfaxwater.org/water-

2021 Annual Water Quality Report |
31 |
|
Be Winter Salt Smart:
Learn How To Protect Our Source Water
What’s the problem?
In the winter, salt keeps us safe while we are on the move, but it also leads to higher levels of salt in the region’s drinking water supply, including the Potomac River and Occoquan Reservoir. Learn more and be winter salt smart!
What is winter salt?
Winter salt is rock salt (sodium chloride) or ice melt (a blend of sodium chloride, magnesium chloride, and other salt). These materials are used in the winter to prevent icing of sidewalks, parking lots, and roadways.
What are the benefits of winter salt use?
- Causes fewer incidents of slip and fall injuries.
- Reduces number of vehicle crashes.
- Enables businesses, government, and social services to continue with minimal interruption.
What are the downsides of its use?
- Salt on impervious surfaces (sidewalks, parking lots, roads, etc.) is eventually washed into storm drains, creeks, and rivers. This results in higher concentrations of salt in the region’s drinking water sources: the Potomac River and Occoquan Reservoir.
- Salt causes corrosion to vehicles and infrastructure (roads, bridges, sidewalks, parking lots).
- Salt increases the salinity in streams and groundwater, impacting freshwater fish and other aquatic life.
Why is increased salt in the drinking water supply a problem for water utilities?
- Salt cannot be removed via traditional drinking water and wastewater treatment processes.
- It is corrosive to plumbing.
-
It has potential health impacts for those on
low-sodium diets.
What are Fairfax Water and other agencies doing to address this problem?
The Virginia Salt Management Strategy (SaMS) was established by a diverse group of stakeholders (including Fairfax Water) and coordinated by the Virginia Department of Environmental Quality.
SaMS will provide recommendations for improving winter practices through efficient and effective use of salt while maintaining the same levels of safety. The strategy will also offer ways to raise awareness of these impacts, show how individuals and organizations can participate, and provide guidance for monitoring and research to support action on SaMS recommendations.
In addition to SaMS, Fairfax Water will continue to monitor source water quality and work closely with the county and other agencies to analyze trends and explore solutions.
What can I do to help?
- Shovel early. Remove snow from pavements before it turns to ice. Use salt only after snow has been cleared and only in areas needed for safety.
-
Use less. More salt does not mean more melting. A
12-ounce coffee mug of salt should be enough for a 20- foot driveway or about 10 sidewalk squares. - Spread evenly. Try not to distribute in clumps.
- Watch the temps. When it is colder than 15°F, do not apply winter salt. It will not work. In those cases, consider building traction with alternatives like sand or native bird seed.
Contaminants
Fairfax County Water Authority
EWG's drinking water quality report shows results of tests conducted by the water utility and provided to the Environmental Working Group by the Virginia Department of Health - Office of Drinking Water, as well as information from the U.S. EPA Enforcement and Compliance History database (ECHO). For the latest quarter assessed by the U.S. EPA (January 2019 - March 2019), tap water provided by this water utility was in compliance with federal health-based drinking water standards.
Utility details
- Serves: 1074422
- Data available: 2012-2017
- Data Source: Surface water
- Total: 26
Contaminants That Exceed Guidelines
- Bromate
- Bromodichloromethane
- Chloroform
- Chromium (hexavalent)
- Dibromochloromethane
- Dichloroacetic acid
- Nitrate
- Nitrate and nitrite
- Radium%2C combined (-226 & -228)
- Total trihalomethanes (TTHMs)
- Trichloroacetic acid
Other Detected Contaminants
- Aluminum
- Atrazine
- Barium
- Bromide
- Bromoform
- Chlorate
- Dibromoacetic acid
- Fluoride
- Haloacetic acids (HAA5)
- Molybdenum
- Monochloroacetic acid
- Nitrite
- Strontium
- Tritium
- Vanadium
Reminder
Always take extra precautions, the water may be safe to drink when it leaves the sewage treatment plant but it may pick up pollutants during its way to your tap. We advise that you ask locals or hotel staff about the water quality. Also, note that different cities have different water mineral contents.