Table of Contents
Can You Drink Tap Water in Colonie?
Yes, Colonie's tap water is generally considered safe to drink as Colonie has no active health based violations of the Safe Drinking Water Act (SDWA) that we are aware of. Other factors such as lead piping in a home, or low levels of pollutants on immunocompromised individuals, should also be considered, however. To find more recent info we might have, you can check out our boil water notice page, the city's water provider website, or Colonie's local Twitter account.
According the EPA’s ECHO database, from April 30, 2019 to June 30, 2022, Colonie's water utility, Latham Water District, had 0 violations of the Safe Drinking Water Act. For more details on the violations, please see our violation history section below. This assessment is based on the Latham Water District water system, other water systems in the city may have different results.
While tap water that meets the EPA health guidelines generally won’t make you sick to your stomach, it can still contain regulated and unregulated contaminants present in trace amounts that could potentially cause health issues over the long-run. These trace contaminants may also impact immunocompromised and vulnerable individuals.
The EPA is reviewing if it’s current regulations around pollutant levels in tap water are strict enough, and the health dangers posed by unregulated pollutants, like PFAS.
Water Quality Report for Colonie Tap Water
The most recent publicly available numbers for measured contaminant levels in Colonie tap water are in its 2020 Water Quality Report. As you can see, there are levels which the EPA considers to be acceptable, but being below the maximum allowable level doesn’t necessarily mean the water is healthy.
Lead in tap water, for example, is currently allowed at up to 15ppb by the EPA, but it has set the ideal goal for lead at zero. This highlights how meeting EPA standards doesn’t necessarily mean local tap water is healthy.
EPA regulations continue to change as it evaluates the long term impacts of chemicals and updates drinking water acceptable levels. The rules around arsenic, as well as, lead and copper are currently being re-evaluated.
There are also a number of "emerging" contaminants that are not currently. For example, PFAS (Per- and polyfluoroalkyl substances), for which the EPA has issued a health advisory. PFAS are called "forever chemicals" since they tend not to break down in the environment or the human body and can accumulate over time.
We recommend looking at the contaminants present in Colonie's water quality reports, or getting your home's tap water tested to see if you should be filtering your water.
Colonie Tap Water Safe Drinking Water Act Violation History - Prior 10 Years
Below is a ten year history of violations for the water system named Latham Water District for Colonie in New York. For more details please see the "What do these Violations Mean?" section below.
Is there Lead in Colonie Water?
Based on the EPA’s ECHO Database, 90% of the samples taken from the Colonie water system, Latham Water District, between sample start date and sample end date, were at or below, 0.0024 mg/L of lead in Colonie water. This is 16.0% of the 0.015 mg/L action level. This means 10% of the samples taken from Colonie contained more lead.
While Colonie water testing may have found 0.0024 mg/L of lead in its water, that does not mean your water source has the same amount. The amount of lead in water in a city can vary greatly from neighborhood to neighborhood, or even building to building. Many buildings, particularly older ones, have lead pipes or service lines which can be a source of contamination. To find out if your home has lead, we recommend getting you water tested.
No amount of lead in water is healthy, only less dangerous. As lead accumulates in our bodies over time, even exposure to relatively small amounts can have negative health effects. For more information, please check out our Lead FAQ page.
Are there PFAS in Colonie Tap Water?
Currently, testing tap water for PFAS isn’t mandated on a national level. We do have a list of military bases where there have been suspected or confirmed leaks. There appears to be at least one military base - Albany AASF #3/DMNA HQ /FMS #16 - near Colonie with suspected leaks.
With many potential sources of PFAS in tap water across the US, the best information we currently have about which cities have PFAS in their water is this ewg map, which you can check to see if Colonie has been evaluated for yet.
Our stance is better safe than sorry, and that it makes sense to try to purify the tap water just in case.
What do these Violations Mean?
Safe Drinking Water Act Violations categories split into two groups, health based, and non-health based. Generally, health based violations are more serious, though non-health based violations can also be cause for concern.
Health Based Violations
- Maximum contaminant levels (MCLs) - maximum allowed contaminant level was exceeded.
- Maximum residual disinfectant levels (MRDLs) - maximum allowed disinfectant level was exceeded.
- Other violations (Other) - the exact required process to reduce the amounts of contaminants in drinking water was not followed.
Non-Health Based Violations
- Monitoring and reporting violations (MR, MON) - failure to conduct the required regular monitoring of drinking water quality, and/or to submit monitoring results on time.
- Public notice violations (Other) - failure to immediately alert consumers if there is a serious problem with their drinking water that may pose a risk to public health.
- Other violations (Other) - miscellaneous violations, such as failure to issue annual consumer confidence reports or maintain required records.
SDWA Table Key
| Field | Description |
|---|---|
| Compliance Period | Dates of the compliance period. |
| Status |
Current status of the violation.
|
| Health-Based? | Whether the violation is health based. |
| Category Code |
The category of violation that is reported.
|
| Code | A full description of violation codes can be accessed in the SDWA_REF_CODE_VALUES (CSV) table. |
| Contaminant Code | A code value that represents a contaminant for which a public water system has incurred a violation of a primary drinking water regulation. |
| Rule Code |
Code for a National Drinking Water rule.
|
| Rule Group Code |
Code that uniquely identifies a rule group.
|
| Rule Family Code |
Code for rule family.
|
For more clarification please visit the EPA's data dictionary.
Colonie Water - Frequently Asked Questions
| By Mail: | Colonie Town hall 534 Loudon Road NEWTONVILLE, NY, 12128 |
Existing customers can login to their Latham Water District account to pay their Colonie water bill by clicking here.
If you want to pay your Latham Water District bill online and haven't made an account yet, you can create an account online. Please click here to create your account to pay your Colonie water bill.
If you don't want to make an account, or can't remember your account, you can make a one-time payment towards your Colonie water bill without creating an account using a one time payment portal with your account number and credit or debit card. Click here to make a one time payment.
Moving to a new house or apartment in Colonie means you will often need to put the water in your name with Latham Water District. In order to put the water in your name, please click the link to the start service form below. Start service requests for water bills typically take two business days.
Leaving your house or apartment in Colonie means you will likely need to take your name off of the water bill with Latham Water District. In order to take your name off the water bill, please click the link to the stop service form below. Stop service for water bills requests typically take two business days.
USER SUBMITTED RATINGS
- Drinking Water Pollution and Inaccessibility
- Water Pollution
- Drinking Water Quality and Accessibility
- Water Quality
The above data is comprised of subjective, user submitted opinions about the water quality and pollution in Colonie, measured on a scale from 0% (lowest) to 100% (highest).
Related FAQS
Colonie Water Quality Report (Consumer Confidence Report)
The EPA mandates that towns and cities consistently monitor and test their tap water. They must report their findings in an annual Consumer Confidence Report. Below is the most recent water quality report from Colonie's Water. If you would like to see the original version of the report, please click here.
Annual Drinking Water Quality Report 2020
Latham Water District • 347 Old Niskayuna Road • Latham, NY 12110
(Public Water Supply ID # NY0100198) American Water Works Association member since 1952
TOWN BOARD MEMBERS
Paula A. Mahan, Town Supervisor
Linda J. Murphy, Deputy Supervisor |
Brian Austin |
Rick Field |
Melissa Jeffers |
Danielle Futia |
Jill A. Penn |
INTRODUCTION
To comply with State and Federal regulations, Latham Water District is annually issuing a report describing the quality of your drinking water. The purpose of this report is to raise your awareness of drinking water and understanding of the need to protect our drinking water sources. Last year, your tap water met all State drinking water health standards. We are proud to report that our system did not exceed any maximum contaminant level or violate any other water quality standard. This report provides an over view of last year’s water quality. Included are details about where you water comes from, what it contains and how it compares to State standards.
If you have any questions about this report or your drinking water, please contact the Superintendent of the Division of Latham Water is John W. Frazer, Jr. P.E. at
on our website – www.colonie.org/departments/lathamwater. We want you to be informed about your drinking water and the public is invited to participate in the decisions that affect the Division of Latham Water. These decisions are made by the Town Board at their regularly scheduled meetings or at special public hearings. Town Board member Linda J. Murphy is Latham Water’s liaison to the Board. Public notice of all meetings is printed in the Colonie Spotlight and can also be
Page 1 of 11
found on the Town of Colonie website at www.colonie.org/boards/townboard. Generally, Town Board meetings are held on the 2nd and 4th Thursdays of each month.
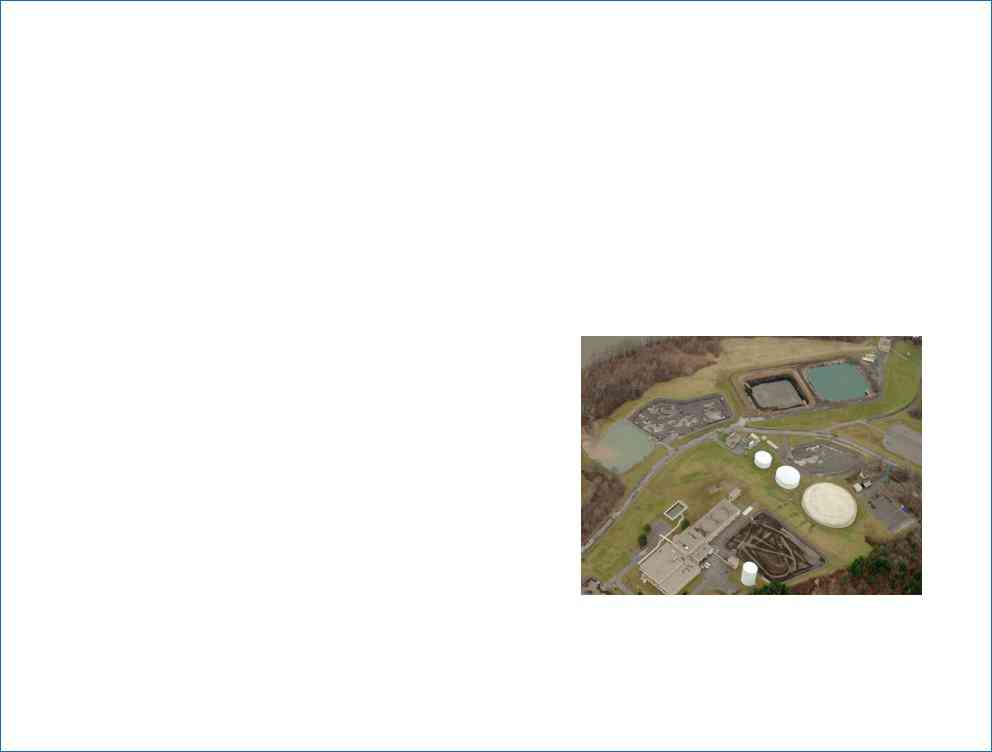
WHERE DOES OUR WATER COME FROM?
In general, the sources of drinking water (both tap water and bottled water) include rivers, lakes, streams, ponds, reservoirs, springs and wells. As water travels over the surface of the land or through the ground, it dissolves
must provide the same protection for public health.
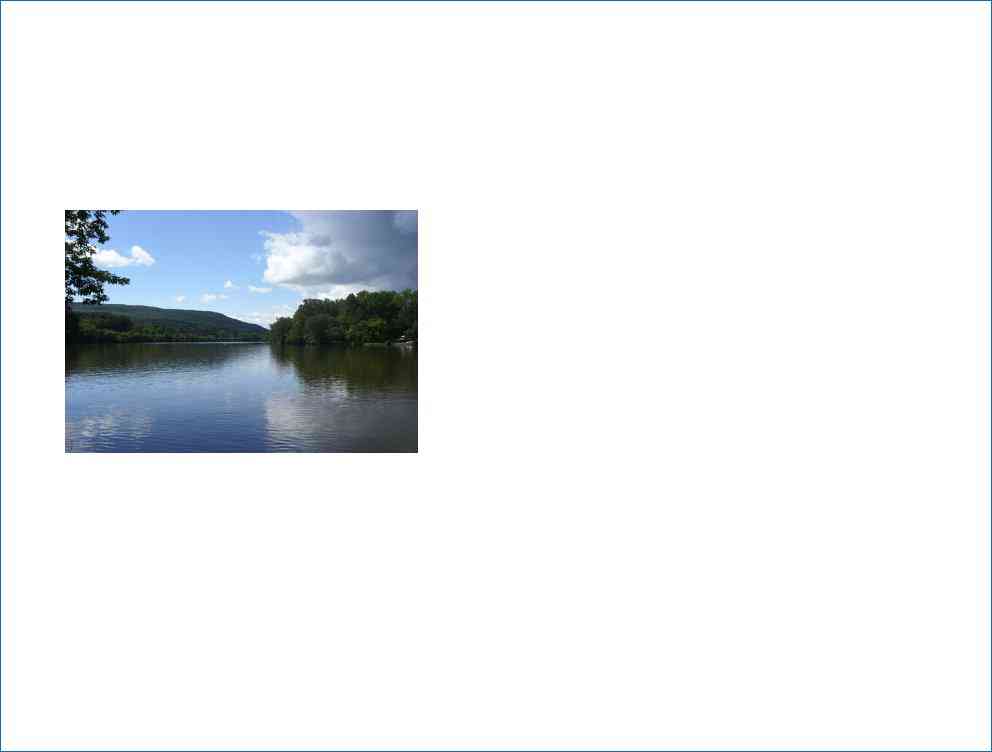
Latham’s raw water sources are a blend of the Mohawk River and five
-
wells located on Onderdonk Avenue. Although there has been no recorded contamination of the Reservoir, potential sources can include highway runoff
(de-icing chemicals and sand), residential lawn care runoff, agricultural runoff and accidental spills.
The wells are located on the treatment plant property and are used
The quality of our sources before treatment is good and the treatment plant finishes the job by removing any solids, metals (primarily iron and manganese),
Page 2 of 11

SOURCE WATER ASSESSMENTS
The NYS DOH has completed a Source Water Assessment for the Mohawk River upstream of the Latham Water intake and the Stony Creek Reservoir. The assessments are summarized below. The assessments have identified potential contamination. It does not mean that the water delivered to your home is or will become unsafe to drink.
The assessment of the Mohawk River found that the amount of pasture in its watershed results in a potential for protozoa contamination. While there are many facilities present along the Mohawk that are permitted to discharge, they do not represent an important threat to source water quality.
The assessment of the Stony Creek Reservoir found that the amount of agricultural lands and the golf course in its watershed results in a potential for protozoa, phosphorus and pesticide contamination.
Latham’s water treatment plant performs
FACTS AND FIGURES
The total water produced for 2020 was over 3.64 billion gallons. Our water system serves approximately 82,000 people through 25,246 service connections, virtually, all of this water is sold through metered connections. A small portion of the water produced by the treatment plant, however, is not billed to our customers. Unbilled water is used for treatment plant operations, water main testing, fire hydrant flushing, firefighting, water main breaks, etc. We estimate this “unbilled” amount of water to be 19.6% of water produced. The daily average of water treated and pumped into the distribution system is 9,943,694 gallons per day. In 2020, customers were charged $3.60 per 1,000 gallons of water for an average annual charge, per residential user, of $319.79.
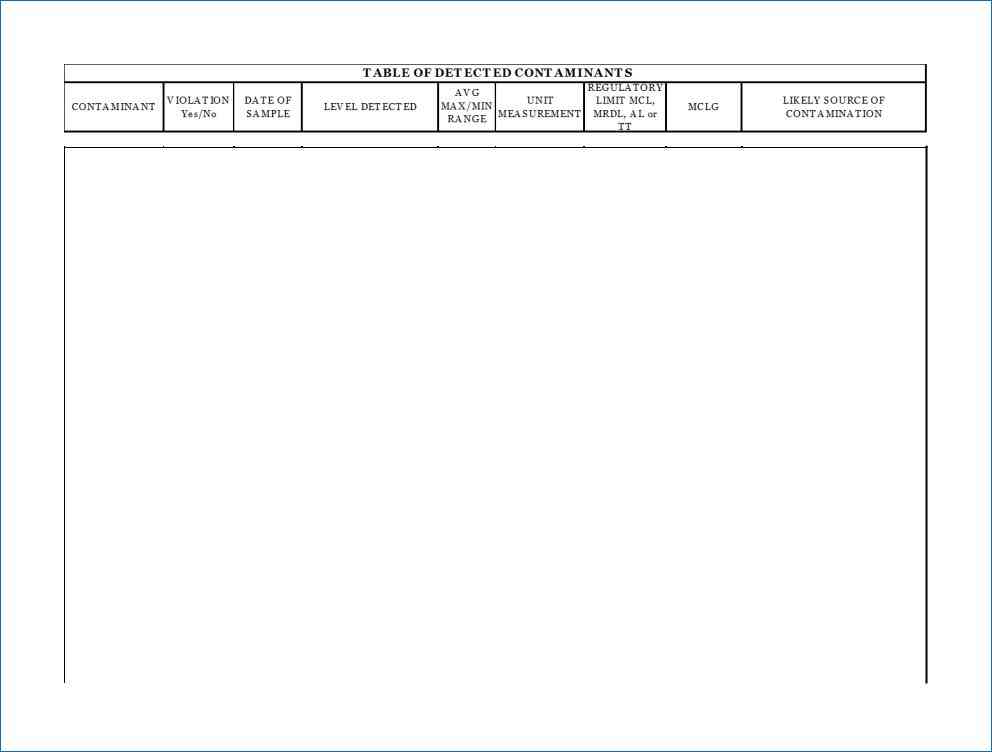
ARE THERE CONTAMINANTS IN OUR DRINKING WATER?
As the State regulations require, we routinely test your drinking water for numerous contaminants. These contaminants include: total coliform, turbidity, inorganic compounds, nitrate, nitrite, lead and copper, volatile organic compounds, total trihalomethanes, haloacetic acids, radiological and synthetic organic compounds. The table presented below depicts which compounds were detected in your drinking water. The State allows to test for some contaminants less than once per year because the concentrations of these contaminants do not change frequently. Some of our data, though representative, are more than
Page 3 of 11
It should be noted that all drinking water, including bottled drinking water, may be reasonably expected to contain at least small amounts of some contaminants. The presence of contaminants does not necessarily indicate that water poses a health risk. More information about contaminants and potential health effects
can be obtained by calling the EPA’s Safe Drinking Water Hotline
Turbidity and chlorine residual monitoring is performed continuously, using automated
T ABLE OF DET ECT ED CONT AMINANT S
CONT A MINA NT
V IOLA TION |
DA TE OF |
Yes/No |
SA MPLE |
|
|
LEV EL DETECTED
A V G
MA X/MIN RA NGE
UNIT
MEA SUREMENT
REGULA TORY LIMIT MCL, MRDL, A L or
TT
MCLG
LIKELY SOURCE OF CONTA MINA TION
Microbiological Contaminants
Distribu tion |
|
Daily |
0 .1 1 |
A v g |
NTU |
|
N/A |
Soil Ru n |
|
Sy stem Tu rbidity |
No |
Testing |
1 .00 |
Max |
|
5 .0 (MCL) |
|
|
|
(1 ) |
|
|
0 .03 |
1 |
Range |
|
|
|
|
|
|
|
|
|
|
|
|||
Tu rbidity (1 ) |
|
|
0 |
.06 |
A v g |
NTU |
TT=9 5 % of |
N/A |
Soil Ru n |
Com bined |
No |
Continu ou s |
0 |
.03 |
Min |
|
Sam ples |
|
|
Filter Efflu ent |
|
|
0 |
.1 3 |
|
|
<= 0 .3 NTU |
|
|
h igh sam ple from |
|
|
Max |
|
|
|
|||
|
|
|
|
|
|
|
|
||
6 /2 0/2 02 0 |
|
|
|
|
|
|
|
|
|
Total Coliform |
|
3 |
0 positiv e sam ples |
|
N/A |
A ny Positiv e |
2 positiv e |
Natu rally present in th e |
|
(2 ) |
No |
per w eek |
|
|
|
|
Sam ple |
sam ples in |
env ironm ent. |
|
|
|
|
|
|
|
|
any 1 m onth |
|
Page 4 of 11
Inorganic Contaminants
Copper (3 ) |
No |
Sept 2 01 8 |
0 .1 1 |
A v g |
m g/L |
1 .3 (A L) |
1 .3 |
Corrosion of h ou seh old plu m bing |
|
|
|
0 .04 |
Range |
|
|
|
sy stem s; Erosion of natu ral |
|
|
|
|
|
|
|
depostis; Leach ing . |
|
|
|
|
|
|
|
|
|
|
Lead (4 ) |
No |
Sept 2 01 8 |
<0 .001 |
A v g |
m g/L |
1 5 (A L) |
0 |
Corrosion of h ou seh old plu m bing |
|
|
|
<0 .001 |
Range |
|
|
|
sy stem s; Erosion of natu ral |
|
|
|
|
|
|
|
depostis; Leach ing . |
|
|
|
|
|
|
|
|
|
|
|
|
|
|
|
|
|
|
|
Sodiu m (5 ) |
No |
09 /02 /2 0 |
4 0 .1 |
|
m g/L |
See Note 5 |
|
Natu rally occu rring; Road salt; |
|
|
|
|
|
|
|
|
Water softeners; A nim al w aste. |
|
|
|
|
|
|
|
|
|
Nitrate |
No |
09 /02 /2 0 |
0 .4 |
|
m g/L |
1 0 .0 (MCL) |
1 0 .0 |
Ru noff from fertilizer u se; Erosion |
|
|
|
|
|
|
|
|
of natu ral deposits. |
|
|
|
|
|
|
|
|
|
Color (range) |
No |
Daily |
1 |
Range |
Units |
1 5 (MCL) |
N/A |
Color h as no h ealth effects. Its |
|
|
|
|
|
|
|
presences is aesth etically |
|
|
|
|
|
|
|
|
|
|
|
|
|
|
|
|
|
|
ojectionable. |
|
|
|
|
|
|
|
|
|
Ch loride |
No |
Weekly |
4 7 .6 |
A v g |
ppm |
2 5 0 .0 (MCL) |
N/A |
No h ealth effects. Natu rally |
|
|
|
|
|
|
|
occu rring or indicativ e of road |
|
|
|
|
|
|
|
|
|
|
|
|
|
3 2 .7 |
Range |
|
|
|
salt contam ination . |
|
|
|
|
|
|
|
|
|
|
|
|
|
|
|
|
|
|
Hardness |
No |
Weekly |
1 1 6 .3 |
A v g |
ppm |
No MCL |
N/A |
No h ealth effects. Natu rally |
|
|
|
81 .4 |
Range |
|
|
|
occu rring m inerals. |
Su lfate |
No |
09 /02 /2 0 |
4 6 .0 |
|
m g/L |
2 5 0 (MCL) |
N/A |
Geology . |
Bariu m |
No |
09 /02 /2 0 |
0 .02 9 |
|
m g/L |
2 .0 (MCL) |
N/A |
Disch arge of drilling w astes; |
|
|
|
|
|
|
|
|
|
|
|
|
|
|
|
|
|
disch arge from m etal refineries; |
|
|
|
|
|
|
|
|
erosion of natu ral deposits. |
|
|
|
|
|
|
|
|
|
Manganese |
No |
1 /1 6 /1 9 |
1 .80 |
A v g |
u g/L |
No MCL |
N/A |
Natu rally occu rring; av ailable |
|
|
4 /1 7 /1 9 |
1 .1 2 |
Range |
|
|
|
w ith oth er elem ents & m inerals; |
|
|
|
|
|
|
|
|
fertilizer . Water treatm ent |
|
|
|
|
|
|
|
|
Ch em ical. Essential nu trient . |
|
|
|
|
|
|
|
|
|
Radiologicals |
|
|
|
|
|
|
|
|
Gross A lph a |
No |
Month ly on |
2 .6 8 |
A v g |
pCi/L |
1 5 .0 pCi/L |
0 |
m an |
|
|
Raw Water |
Range |
|
|
|
|
|
Gross Beta (6 ) |
No |
Month ly on |
2 .7 |
A v g |
pCi/L |
5 0 .0 pCi/L |
0 |
m an |
|
|
Raw Water |
Range |
|
|
|
|
|
Tritiu m |
No |
Month ly on |
4 .04 |
A v g |
pCi/L |
2 0,000 pCi/L |
0 |
m an |
|
|
Raw Water |
Range |
|
|
|
|
Page 5 of 11

Disinfection Byproducts
|
|
Qu a r ter ly |
5 4 .3 - High est locational |
Max |
u g/L |
80 u g/L |
N/A |
By |
Total |
|
2 /5 /2 0 |
ru nning annu al av g . |
|
|
|
|
ch lorination . THHM's are form ed |
No |
5 /6 /2 0 |
|
|
|
|
|
w h en sou rce w ater contains large |
|
Trih alom eth anes |
|
|
|
|
|
|||
|
|
|
|
|
am ou nts of organic m atter . |
|||
(7 ) |
|
8/5 /2 0 |
2 1 .3 |
Range |
|
|
|
|
|
|
|
|
|
||||
|
|
1 1 /4 /2 0 |
for all locations |
|
|
|
|
|
|
|
|
|
|
|
|
|
|
|
|
|
|
|
|
|
|
|
|
|
Qu arterly |
3 0 .0 - High est locational |
Max |
u g/L |
6 0 u g/L |
N/A |
By |
Total Haloacetic |
|
2 /5 /2 0 |
ru nning annu al av g . |
|
|
|
|
ch lorination . |
No |
5 /6 /2 0 |
|
|
|
|
|
|
|
A cids (7 ) |
|
|
|
|
|
|
||
|
8/5 /2 0 |
1 4 .0 |
Range |
|
|
|
|
|
|
|
|
|
|
|
|||
|
|
1 1 /4 /2 0 |
for all locations |
|
|
|
|
|
|
|
|
|
|
|
|
|
|
|
|
|
|
|
|
|
|
|
Brom inated |
No |
1 /1 6 /1 9 |
3 .4 7 |
A v g |
u g/L |
No MCL |
N/A |
By |
Haloacetic A cids |
|
4 /1 7 /1 9 |
<0 .3 00 |
Range |
|
|
|
disinfection . |
(HA A 9 ) |
|
|
|
|
|
|
|
|
|
|
|
|
|
|
|
|
|
Total Organic |
No |
Daily |
1 .4 7 |
A v g |
ppm |
TT |
N/A |
Natu rally present in th e |
Carbon (8) |
|
Testing |
0 .9 2 |
Range |
|
|
|
env ironm ent. |
|
|
|
|
|
|
|
|
|
|
|
|
|
|
|
|
|
|
Free Ch lorine |
No |
Continu ou s |
1 .9 5 |
A v g |
m g/L |
4 .0 (MRDL) |
N/A |
Used in th e disinfection and |
Residu al @ Entry |
|
|
0 .1 |
Range |
|
|
|
treatm ent of drinking w ater . |
Point |
|
|
|
|
|
|
|
|
|
|
|
|
|
|
|
|
|
Free Ch lorine |
No |
5 day s per |
1 .3 0 |
A v g |
ppm |
4 .0 (MRDL) |
N/A |
A m easu rable residu al is requ ired |
Residu al |
|
w eek |
0 .03 |
Range |
|
|
|
by NYSDOH. |
Distribu tion |
|
|
|
|
|
|
|
|
|
|
|
|
|
|
|
|
|
Ch lorine Dioxide |
No |
Daily |
0 .03 |
A v g |
m g/L |
0 .8 (MRDL) |
N/A |
By |
Residu al (range) |
|
Testing |
<0 .01 |
Range |
|
|
|
disinfection at treatm ent plants |
|
|
|
|
|
|
|
u sing Ch lorine Dioxide. |
|
|
|
|
|
|
|
|
|
|
Ch lorite |
No |
Daily |
0 .3 7 |
A v g |
m g/L |
1 .0 (MCL) |
N/A |
By |
Entry Point |
|
Testing |
0 .09 |
Range |
|
|
|
ch lorination . |
Ch lorite |
No |
Month ly |
3 1 4 |
A v g |
u g/L |
1 000(MCL) |
N/A |
By |
Distribu tion |
|
Testing |
6 9 |
Range |
|
|
|
ch lorination . |
Ch lorate |
No |
Month ly |
2 6 2 |
A v g |
u g/L |
No MCL |
N/A |
By |
Distribu tion |
|
Testing |
1 7 0 |
Range |
|
|
|
ch lorination . |
A naly sis perform ed or rev iew ed by ELA P ID# 1 0000
Page 6 of 11

NOTES:
1 . Tu rbidity is a m easu sre of th e clou diness of th e w ater . We test it becau se it is a good indicator of th e effectiv eness of ou r filtration sy stem . State regu lations requ ire th at 9 5 % of th e com bined filter efflu ent tru bidity sam ples collected h av e m easu rem ents below 0 .3 0 NTU. Distribu tion sy stem tu rbidity is collected a m inim u m of fiv es tim es a w eek. A distribu iton sy stem tu rbidity v iolation occu rs w h en th e m onth ly av erage of th e resu lts of all distribu tion sam ples collected in any calendar m onth exceeds th e MCL. Ou r av erage distribu tion tu rbidity w as 0 .1 1 NTU w ith a single
h igh tu rbidity m easu rem ent of 1 .00 NTU. A ll lev els recorded w ere w ell below th e acceptable range allow ed and did not constitu te a treatm ent v iolation .
2 . Before A pril 1 , 2 01 6 , a v iolation occu rs at sy stem s collecting 4 0 or m ore sam ples per m onth w h en m ore th an 5 % of th e total coliform sam ples are positiv e. A fter A pril 1 , 2 01 6 a Lev el 1 assessm ent is triggered if 2 or m ore rou tine/repeat sam ples are total coliform positiv e in th e sam e m onth .
3 . Th e lev el presented represents th e 9 0th percentile of th e sites tested. A percentile is a v alu e on a scale of 1 00 th at indicates th e percent of a distribu tion th at is equ al to or below it . Th e 9 0th percentile is equ al to or greater th an 9 0% of th e copper v alu es detected at y ou r w ater sy stem .
In th is case, 3 1 sam ples w ere collected at y ou r w ater sy stem and th e 9 0th percentile v alu e w as th e fou rth h igh est sam ple w ith a lev el of 0 .1 5 m g/L.
4 . Th e lev el presented represents th e 9 0th percentile of th e 3 1 sam ples collected. Th e action lev el for lead w as not exceeded at any of th e 3 1 sites tested.
5 . Water containing m ore th an 2 0 m g/L of sodiu m sh ou ld not be u sed for drinking by people on sev erely restricted sodiu m diets. Water containing m ore h an 2 7 0 m g/L of sodiu m sh ou ld not be u sed for drinking by people on m oderately restricted sodiu m diets.
6 . Th e State considers 5 0 pCi/L to be th e lev el of concern for beta particles.
7 . Th e lev el presented represents th e m axim u m locational ru nning annu al av erage calcu lated from th e sam ples collected.
8 . Total Organic Carbon itself is not regu lated, bu t its calcu lated rem ov al and com pliance ratio m u st equ al or exceed perform ance requ irem ents establish ed by USEPA . A ll lev els recorded w ere w ell below th e acceptable range allow ed and did not constitu te a treatm ent tech niqu e v iolation .
Definitions:
A ction Lev el (A L): Th e concentration of a contam inant w h ich , if exceeded triggers treatm ent or oth er requ irem ents w h ich a w ater sy stem m u st follow .
Maxim u m Contam inant Lev el (MCL): Th e h igh est lev el of a contam in
Maxim u m Contam inant Lev el Goal (MCLG): Th e lev el of a contam inant in drinking w ater below w h ich th ere is no know n or expected risk to h ealth . MCLG's allow for a m argin of safety .
Maxim u m Residu al Disinfectant Lev el (MRDL): Th e h igh est lev el of a disinfectant allow ed in drinking w ater . Th ere is conv incing ev idence th at addition of a disinfectant is necessary for control of m icrobial contam inants.
Maxim u m Residu al Disinfectant Lev el Goal (MRDLG): Th e lev el of a drinking w ater disinfectant below w h ich th ere is no know n or expected risk to h ealth . MRDLG's do not reflect th e benefis of th e u se of disinfectants for control of m icrobial contam inants.
Non
Neph elom etric Tu rbidity Unit (NTU): A m easu re of th e optical clarity of w ater . Tu rbidity in excess of 5 NTU is ju st noticible to th e av erage person .
Milligram s per liter (m g/L): Corresponds to one part of liqu id in one m illion parts of liqu id (parts per m illion - ppm ).
Microgram s per liter (u g/L): Corresponds to one part of liqu id in one billion parts of liqu id (parts per billion - ppb).
Nanogram s per liter (ng/L): Corresponds to one part of liqu id in one trillion parts of liqu id (parts per trillion - ppt).
Non
Picocu ries per liter (pCi/L): a m easu re of th e radioactiv ity in w ater .
Treatm ent Tech niqu e (TT): a requ ired process intended to redu ce th e lev el of a contam inant in drinking w ater .
Page 7 of 11

IS OUR WATER SYSTEM MEETING OTHER RULES THAT GOVERN OPERATIONS?
The results of Latham Water District’s water quality testing show that we were in compliance with all applicable State and Federal drinking water quality requirements. However, we are required to monitor your drinking water for specific contaminants on a regular basis. Results of regular monitoring are an indicator of whether or not our drinking water meets health standards.
INFORMATION ON UNREGULATED CONTAMINANTS
In 2020, we were required to collect and analyze drinking water samples for the following unregulated contaminants and report those results to the Environmental Protection Agency (EPA). These results are not for compliance monitoring but will be used by the EPA to consider future regulations. Contaminants tested for include: Brominated Haloacetic Acids (HAA9), metals, pesticides,
WHAT DOES THIS INFORMATION MEAN?
As you can see by the table, our system had no violations of the State Sanitary Code. We have learned through our testing that some contaminants have been detected however, these contaminants were detected below New York State requirements.
DO I NEED TO TAKE SPECIAL PRECAUTIONS?
Although our drinking water met or exceeded state and federal regulations, some people may be more vulnerable to disease- causing microorganisms or pathogen in drinking water than the general population.
Page 8 of 11
WHY SAVE WATER AND HOW TO AVOID WASTING IT?
Although our system has an adequate amount of water to meet present and future demands, there are a number of reasons why it is important to conserve water:
- Saving water saves energy and some of the costs associated with both of these necessities of life;
- Saving water reduces the cost of energy required to pump water and the need to construct costly new wells, pumping systems and water tower; and
- Saving water lessens the strain on the water system during a dry spell or drought, helping to avoid severe water use restrictions so that essential firefighting needs are met.
You can play a role in conserving water by becoming conscious of the amount of water your household is using and by looking for ways to use less whenever you can. It is not hard to conserve water. Conservation tips include:
- Automatic dishwashers use 15 gallons of water for every cycle, regardless of how many dishes are loaded. So get a run for your money and load it to capacity.
- Turn off the tap when brushing your teeth.
- Check every faucet in your home for leaks. Just a slow drip can waste 15 to 20 gallons a day. Fix it up and you can save almost 6,000 gallons per year.
- Check your toilets for leaks by putting a few drops of food coloring in the tank, watch for a few minutes to see if the color shows up in the bowl. It is not uncommon to lose up to 100 gallons a day from one of these otherwise invisible toilet leaks. Fix it and you save more than 30,000 gallons a year.
- Use you water meter to detect hidden leaks. Simply turn off all taps and water using appliances. Then check the meter after 15 minutes, if it moved, you have a leak.
Page 9 of 11

2020 CAPITAL IMPROVEMENTS
-
CITY OF ALBANY EMERGENCY INTERCONNECTION PROJECT
The Town of Colonie and the City of Albany Water Board have awarded a $3.2 million contract to New Castle Paving to install two emergency interconnections to our water distribution systems. The connections to the water distribution systems are at two points: the Loudonville Reservoir site and along New Karner Road (NYS Route 155). Since this project equally benefits both communities, the total project costs are being split equally by each municipality. The Town received a Drinking Water Infrastructure Improvement Act Grant in the amount of $960,000 towards its half of the project costs. The project includes the installation of approximately 4,000 feet of new 24” water main from the Town’s Loudonville Storage tank on Albany Shaker Road to the City of Albany’s Loudonville Reservoirs and 3,500 feet of 16” main along New Karner Road from Rifle Range Road to an existing 20” City of Albany water main. The Loudonville interconnection, as well as a majority of the New Karner Road interconnection were constructed in 2019. New Castle Paving returned in the Spring of 2020 and completed the balance of the project.
PLANNED CAPITAL IMPROVEMENTS FOR 2021
-
RIVER ROAD CLEARWELL REPLACEMENT ENGINEERING DESIGN
The Latham Water District awarded the engineering design contract for the River Road Clearwell Replacement Project to Ramboll Engineering. The project will include the following improvements: demolish existing River Road clearwells, construct new 2.0 million gallon clearwell with its associated piping, valves and mixer, rehabilitate existing control valves, improve high pressure interconnection between the 30” finished water pipeline to River Road Pump Station and clearwells and the Mohawk View Water Treatment Plant site, modify inlet piping at the backwash pump station to improve chemical mixing, replace three 24” transmission main valves on the discharge of the River Road Pump Station, replace Mohawk View Water Treatment Plant filter valves/actuators and modify piping to incorporate automatic filter to waste capabilities on filters1-6. The design is expected to be completed in 2021, with construction beginning in 2022.
Page 10 of 11
ONLY TAP WATER DELIVERS
How often do you think about your tap water? If you’re like most, probably not often. Tap water delivers so many things that no other water can deliver.
- It delivers public health.
- It delivers fire protection.
- It delivers economic development.
- It delivers quality of life.
For more information go to www.awwa.org and/or www.drinktap.org
CLOSING
Latham Water District delivered safe water in 2020 with no water quality violations. We continually strive to improve our water quality by improving our treatment processes and by implementing capital improvement projects. In spite of the
Page 11 of 11

Latham Water District • 347 Old Niskayuna Road • Latham, NY 12110
(Public Water Supply ID # NY0100198)
Annual Water Quality Report 2020 Supplement “A”
List of 2020 Non-Detected Contaminants Monitored Every 12-18 Months
|
Inorganic Metals - |
|
|
|
|
Concentration |
MCL |
|
|
|
|||
|
|
|
|
|
Reported mg/L |
|
|
|
|||||
|
|
Annually |
|
|
Date |
|
or ppm |
ppm |
|
|
|
||
|
|
Antimony |
|
9/2/2020 |
|
<0.001 |
|
0.006 |
|
|
|
||
|
|
Arsenic |
|
9/2/2020 |
|
<0.0005 |
|
0.010 |
|
|
|
||
|
|
Beryllium |
|
9/2/2020 |
|
<0.0002 |
|
0.004 |
|
|
|
||
|
|
Cadmium |
|
9/2/2020 |
|
<0.001 |
|
0.005 |
|
|
|
||
|
|
Chromium |
|
9/2/2020 |
|
<0.001 |
|
0.10 |
|
|
|
||
|
Cyanide, Total |
|
9/2/2020 |
|
<0.010 |
|
0.2 |
|
|
|
|||
|
|
Fluoride |
|
9/2/2020 |
|
<0.20 |
|
2.2 |
|
|
|
||
|
|
Mercury |
|
9/2/2020 |
|
<0.0002 |
|
0.002 |
|
|
|
||
|
|
|
Nickel |
|
9/2/2020 |
|
<0.005 |
|
0.1 |
|
|
|
|
|
|
Selenium |
|
9/2/2020 |
|
<0.002 |
|
0.05 |
|
|
|
||
|
|
Thallium |
|
9/2/2020 |
|
<0.001 |
|
0.002 |
|
|
|
||
|
|
|
|
|
|
|
|
|
|
|
|
|
|
|
|
|
Concentration |
MCL |
|
|
|
|
|
|
Concentration |
MCL |
|
Volatile Organics - |
|
|
Reported µg/L |
Volatile Organics - |
|
|
|
Reported µg/L |
|||||
Annually |
Date |
|
or ppb |
ppb |
|
Annually |
|
Date |
|
or ppb |
ppb |
||
1,1 Dichloroethane |
9/2/2020 |
|
<0.5 |
5.0 |
Chloroethane |
|
9/2/2020 |
|
<0.5 |
5.0 |
|||
1,1 Dichloroethene |
9/2/2020 |
|
<0.5 |
5.0 |
Chloromethane |
|
9/2/2020 |
|
<0.5 |
5.0 |
|||
1,1,1 Trichloroethane |
9/2/2020 |
|
<0.5 |
5.0 |
cis 1,2 Dichloroethene |
|
9/2/2020 |
|
<0.5 |
5.0 |
|||
1,1,1,2 Tetrachloroethane |
9/2/2020 |
|
<0.5 |
5.0 |
cis 1,3 Dichloropropene |
|
9/2/2020 |
|
<0.5 |
5.0 |
|||
1,1,2 Trichloroethane |
9/2/2020 |
|
<0.5 |
5.0 |
Dibromomethane |
|
9/2/2020 |
|
<0.5 |
5.0 |
|||
1,1,2,2 Tetrachloroethane |
9/2/2020 |
|
<0.5 |
5.0 |
Dichlorodifluoromethane |
|
9/2/2020 |
|
<0.5 |
5.0 |
|||
1,2 Dichlorobenzene |
9/2/2020 |
|
<0.5 |
5.0 |
Ethylbenzene |
|
9/2/2020 |
|
<0.5 |
5.0 |
|||
1,2 Dichloropropane |
9/2/2020 |
|
<0.5 |
5.0 |
Hexachlorobutadiene |
|
9/2/2020 |
|
<0.5 |
5.0 |
|||
1,2,3 Trichlorobenzene |
9/2/2020 |
|
<0.5 |
5.0 |
Isopropylbenzene |
|
9/2/2020 |
|
<0.5 |
5.0 |
|||
1,2,3 Trichloropropane |
9/2/2020 |
|
<0.5 |
5.0 |
Methylene Chloride |
|
9/2/2020 |
|
<0.5 |
5.0 |
|||
1,2,4 Trichlorobenzene |
9/2/2020 |
|
<0.5 |
5.0 |
Methyltertbutylether (MTBE) |
|
9/2/2020 |
|
<0.5 |
5.0 |
|||
1,2,4 Trimethylbenzene |
9/2/2020 |
|
<0.5 |
5.0 |
|
9/2/2020 |
|
<0.5 |
5.0 |
||||
1,3 Dichlorobenzene |
9/2/2020 |
|
<0.5 |
5.0 |
|
9/2/2020 |
|
<0.5 |
5.0 |
||||
1,3 Dichloropropane |
9/2/2020 |
|
<0.5 |
5.0 |
|
9/2/2020 |
|
<0.5 |
5.0 |
||||
1,3,5 Trimethylbenzene |
9/2/2020 |
|
<0.5 |
5.0 |
|
9/2/2020 |
|
<0.5 |
5.0 |
||||
1,4 Dichlorobenzene |
9/2/2020 |
|
<0.5 |
5.0 |
|
|
Styrene |
|
9/2/2020 |
|
<0.5 |
5.0 |
|
2 Chlorotoluene |
9/2/2020 |
|
<0.5 |
5.0 |
|
9/2/2020 |
|
<0.5 |
5.0 |
||||
2,2 Dichloropropane |
9/2/2020 |
|
<0.5 |
5.0 |
Tetrachloroethene |
|
9/2/2020 |
|
<0.5 |
5.0 |
|||
4 Chlorotoluene |
9/2/2020 |
|
<0.5 |
5.0 |
|
|
Toluene |
|
9/2/2020 |
|
<0.5 |
5.0 |
|
Benzene |
9/2/2020 |
|
<0.5 |
5.0 |
Total Xylenes |
|
9/2/2020 |
|
<0.5 |
5.0 |
|||
Bromobenzene |
9/2/2020 |
|
<0.5 |
5.0 |
Trans 1,2 Dichloroethane |
|
9/2/2020 |
|
<0.5 |
5.0 |
|||
Bromochloromethane |
9/2/2020 |
|
<0.5 |
5.0 |
Trans 1,3 Dichloropropene |
|
9/2/2020 |
|
<0.5 |
5.0 |
|||
Bromomethane |
9/2/2020 |
|
<0.5 |
5.0 |
Trichloroethene |
|
9/2/2020 |
|
<0.5 |
5.0 |
|||
Carbon Tetrachloride |
9/2/2020 |
|
<0.5 |
5.0 |
Trichlorofluoromethane |
|
9/2/2020 |
|
<0.5 |
5.0 |
|||
Chlorobenzene |
9/2/2020 |
|
<0.5 |
5.0 |
Vinyl Chloride |
|
9/2/2020 |
|
<0.5 |
5.0 |
|||
Analy sis perform ed or rev iew ed by ELAP ID# 1 0000
1

Latham Water District • 347 Old Niskayuna Road • Latham, NY 12110
(Public Water Supply ID # NY0100198)
Annual Water Quality Report 2020 Supplement “A”
List of 2020 Non-Detected Contaminants Monitored Every 12-18 Months
Synthetic Organic |
|
Concentration |
MCL |
Synthetic Organic |
|
Concentration |
MCL |
Compounds - Every 18 |
|
Reported µg/L |
Compounds - Every 18 |
|
Reported µg/L |
||
Months |
Date |
or ppb |
ppb |
Months |
Date |
or ppb |
ppb |
Chlorinated Herbicides |
|
|
|
Synthetic Organic Chemicals |
|
|
|
2,4 D |
12/4/2019 |
<0.100 |
50.0 |
Alachlor |
12/4/2019 |
<0.192 |
2.0 |
Dalapon |
12/4/2019 |
<1.00 |
50.0 |
Aldrin |
12/4/2019 |
<0.096 |
5.0 |
Dicamba |
12/4/2019 |
<0.100 |
50.0 |
Atrazine |
12/4/2019 |
<0.096 |
3.0 |
Dinoseb |
12/4/2019 |
<0.200 |
7.0 |
Benzo(A)pyrene |
12/4/2019 |
<0.019 |
0.2 |
Pentachlrophenol |
12/4/2019 |
<0.0400 |
1.0 |
Butachlor |
12/4/2019 |
<0.096 |
50.0 |
Picloram |
12/4/2019 |
<0.100 |
50.0 |
12/4/2019 |
<0.577 |
50.0 |
|
12/4/2019 |
<0.200 |
10.0 |
12/4/2019 |
<0.577 |
6.0 |
||
Organohalide Pesticides & PCB's |
|
|
Heptachlor |
12/4/2019 |
<0.038 |
0.4 |
|
Aroclor 1221 |
12/4/2019 |
<20.0 |
0 |
Heptachlor Epoxide |
12/4/2019 |
<0.019 |
0.2 |
Aroclor 1260 |
12/4/2019 |
<0.100 |
0 |
Hexachlorobenzene |
12/4/2019 |
<0.096 |
1.0 |
Aroclor 1254 |
12/4/2019 |
<0.100 |
0 |
Hexachlorocyclopentadiene |
12/4/2019 |
<0.096 |
5.0 |
Aroclor 1248 |
12/4/2019 |
<0.100 |
0 |
Lindane |
12/4/2019 |
<0.019 |
0.2 |
Aroclor 1242 |
12/4/2019 |
<0.300 |
0 |
Methoxychlor |
12/4/2019 |
<0.096 |
40.0 |
Aroclor 1232 |
12/4/2019 |
<0.500 |
0 |
Metolachlor |
12/4/2019 |
<0.096 |
50.0 |
Aroclor 1016 |
12/4/2019 |
<0.0800 |
0 |
Metribuzin |
12/4/2019 |
<0.096 |
50.0 |
Chlordane |
12/4/2019 |
<0.200 |
2 |
Propachlor |
12/4/2019 |
<0.096 |
50.0 |
Dieldrin |
12/4/2019 |
<0.0200 |
0 |
Simazine |
12/4/2019 |
<0.067 |
4.0 |
Endrin |
12/4/2019 |
<0.0100 |
0 |
|
|
|
|
Toxaphene |
12/4/2019 |
<1.00 |
3 |
|
|
|
|
Micro Extractables |
|
|
|
|
|
|
|
1,2 Dibromoethane |
12/4/2019 |
<0.0100 |
0.05 |
|
|
|
|
1,2 Dibromo3chloropropane |
12/4/2019 |
<0.0100 |
0.2 |
|
|
|
|
Pesticides |
|
|
|
Miscellaneous |
|
|
|
12/4/2019 |
<0.500 |
0 |
Total Glycols |
Monthly |
ND |
50.0 |
|
Aldicarb |
12/4/2019 |
<0.500 |
3.0 |
|
|
|
|
Aldicarb Sulfone |
12/4/2019 |
<0.800 |
2.0 |
|
|
|
|
Aldicarb Sulfoxide |
12/4/2019 |
<0.500 |
4.0 |
|
|
|
|
Carbaryl |
12/4/2019 |
<0.500 |
0 |
|
|
|
|
Carbofuran |
12/4/2019 |
<0.900 |
40.0 |
|
|
|
|
Methomyl |
12/4/2019 |
<0.500 |
0 |
|
|
|
|
Oxamyl |
12/4/2019 |
<2.0 |
50.0 |
|
|
|
|
Analy sis perform ed or rev iewed by ELAP ID# 1 0000
2

Latham Water District • 347 Old Niskayuna Road • Latham, NY 12110
(Public Water Supply ID # NY0100198)
Annual Water Quality Report 2020 Supplement “A”
PFOA, PFOS and 1,4 Dioxane Monitored Every Quarter Beginning
October 2020
Synthetic Organic |
|
Concentration |
MCL |
Compounds - |
|
Reported µg/L |
|
Quarterly |
Date |
or ppb |
ppb |
1,4 Dioxane |
10/7/2020 |
<0.020 |
1.0 |
Synthetic Organic Compounds - |
|
Concentration |
MCL |
|
Reported ng/L |
||
Quarterly |
Date |
or ppt |
ppt |
Perfluorooctanoic Acid (PFOA) |
10/7/2020 |
ND |
10 |
Perfluorooctanesulfonic Acid (PFOS) |
10/7/2020 |
ND |
10 |
Definitions:
Milligrams per liter (mg/L): Corresponds to one part of liquid in one million parts of liquid (parts per million - ppm).
Micrograms per liter (ug/L): Corresponds to one part of liquid in one billion parts of liquid (parts per billion - ppb).
Nanograms per liter (ng/L): Corresponds to one part of liquid in one trillion parts of liquid (parts per trillion - ppt).
Analy sis perform ed or rev iewed by ELAP ID# 1 0000
3
Latham Water District • 347 Old Niskayuna Road • Latham, NY 12110
(Public Water Supply ID # NY0100198)
Annual Water Quality Report 2020 Supplement “B”
2020 Unregulated Contaminant Monitoring Rule – Result Summary
UCMR 4 SEC1 7/14/20- Entry Point - Cyanotoxins
|
|
|
|
Entry |
|
|
|
EPA |
EPA |
Lab |
|
|
|
|
Point - |
|
Units |
|
|||
|
Analyte |
|
|
High Lift |
|
|
Method |
MRL |
MRL |
|
|
|
<0.0300 |
|
µg/L |
545 |
NA |
0.0300 |
|||
|
Cylindrospermopsin |
|
<0.0900 |
|
µg/L |
545 |
NA |
0.0900 |
||
|
Total Microcystins & Nodularins |
<0.300 |
|
µg/L |
546 |
NA |
0.3000 |
|||
|
Percent CV |
|
1.80 |
% |
546 |
NA |
NA |
|||
|
|
|
|
|
|
|
|
|
|
|
|
UCMR 4 SEC2 |
7/28/20- Entry Point - Cyanotoxins |
|
|||||||
|
|
|
|
|
|
|
|
|
|
|
|
|
|
|
Entry |
|
|
|
|
|
|
|
|
|
|
Point - |
|
|
|
EPA |
EPA |
Lab |
|
Analyte |
|
|
High Lift |
|
Units |
|
Method |
MRL |
MRL |
|
|
<0.0300 |
|
µg/L |
545 |
NA |
0.0300 |
|||
|
Cylindrospermopsin |
|
<0.0900 |
|
µg/L |
545 |
NA |
0.0900 |
||
|
Total Microcystins & Nodularins |
<0.300 |
|
µg/L |
546 |
NA |
0.3000 |
|||
|
Percent CV |
|
2.60 |
% |
546 |
NA |
NA |
|||
|
|
|
|
|
|
|
|
|
|
|
|
UCMR 4 SEC3 |
8/11/20- Entry Point - Cyanotoxins |
|
|||||||
|
|
|
|
|
|
|
|
|
|
|
|
|
|
|
Entry |
|
|
|
|
|
|
|
|
|
|
Point - |
|
|
|
EPA |
EPA |
Lab |
|
Analyte |
|
|
High Lift |
|
Units |
|
Method |
MRL |
MRL |
|
|
<0.0300 |
|
µg/L |
545 |
NA |
0.0300 |
|||
|
Cylindrospermopsin |
|
<0.0900 |
|
µg/L |
545 |
NA |
0.0900 |
||
|
Total Microcystins & Nodularins |
<0.300 |
|
µg/L |
546 |
NA |
0.3000 |
|||
|
Percent CV |
|
0.200 |
% |
546 |
NA |
NA |
|||
|
|
|
|
|
|
|
|
|||
|
UCMR 4 SEC4 |
8/25/20- Entry Point - Cyanotoxins |
|
|||||||
|
|
|
|
|
|
|
|
|
|
|
|
|
|
|
Entry |
|
|
|
|
|
|
|
|
|
|
Point - |
|
|
|
EPA |
EPA |
Lab |
|
Analyte |
|
|
High Lift |
|
Units |
|
Method |
MRL |
MRL |
|
|
|
<0.0300 |
|
µg/L |
|
545 |
NA |
0.0300 |
|
|
Cylindrospermopsin |
|
|
<0.0900 |
|
µg/L |
|
545 |
NA |
0.0900 |
|
Total Microcystins & Nodularins |
|
<0.300 |
|
µg/L |
|
546 |
NA |
0.3000 |
|
|
Percent CV |
|
|
0.300 |
|
% |
|
546 |
NA |
NA |
- Method 544 analysis will be performed only if the associated Screening Microcystin by EPA 546 sample result is >=0.3 ug/L
4
Latham Water District • 347 Old Niskayuna Road • Latham, NY 12110
(Public Water Supply ID # NY0100198)
Annual Water Quality Report 2020 Supplement “B”
2020 Unregulated Contaminant Monitoring Rule – Result Summary
UCMR 4 SEC5 9/8/20- Entry Point - Cyanotoxins
|
|
|
|
Entry |
|
|
|
EPA |
|
EPA |
|
Lab |
|
|
|
|
|
Point - |
|
Units |
|
|
|
|
|||
|
Analyte |
|
|
High Lift |
|
|
Method |
|
MRL |
|
MRL |
|
|
|
|
|
<0.0300 |
|
µg/L |
545 |
|
NA |
0.0300 |
|
|||
|
Cylindrospermopsin |
|
|
<0.0900 |
|
µg/L |
545 |
|
NA |
0.0900 |
|
||
|
Total Microcystins & Nodularins |
|
<0.300 |
|
µg/L |
546 |
|
NA |
0.3000 |
|
|||
|
Percent CV |
|
|
4.60 |
% |
546 |
|
NA |
|
NA |
|
||
|
|
|
|
|
|
|
|
|
|
||||
|
UCMR 4 SEC6 |
9/22/20- Entry Point - Cyanotoxins |
|
|
|
||||||||
|
|
|
|
|
|
|
|
|
|
|
|
|
|
|
|
|
|
Entry |
|
|
|
EPA |
|
EPA |
|
Lab |
|
|
|
|
|
Point - |
|
Units |
|
|
|
|
|||
|
Analyte |
|
|
High Lift |
|
|
Method |
|
MRL |
|
MRL |
|
|
|
|
|
<0.0300 |
|
µg/L |
|
545 |
|
NA |
|
0.0300 |
|
|
|
Cylindrospermopsin |
|
|
<0.0900 |
|
µg/L |
|
545 |
|
NA |
|
0.0900 |
|
|
Total Microcystins & Nodularins |
<0.300 |
|
µg/L |
|
546 |
|
NA |
|
0.3000 |
|
||
|
Percent CV |
|
|
1.00 |
|
% |
|
546 |
|
NA |
|
NA |
|
|
|
|
|
|
|
||||||||
|
UCMR 4 SEC7 |
10/13/20- Entry Point - Cyanotoxins |
|
|
|
||||||||
|
|
|
|
|
|
|
|
|
|
|
|
|
|
|
|
|
|
Entry |
|
|
|
EPA |
|
EPA |
|
Lab |
|
|
|
|
|
Point - |
|
Units |
|
|
|
|
|||
|
Analyte |
|
|
High Lift |
|
|
Method |
|
MRL |
|
MRL |
|
|
|
|
|
<0.0300 |
|
µg/L |
|
545 |
|
NA |
|
0.0300 |
|
|
|
Cylindrospermopsin |
|
|
<0.0900 |
|
µg/L |
|
545 |
|
NA |
|
0.0900 |
|
|
Total Microcystins & Nodularins |
<0.300 |
|
µg/L |
|
546 |
|
NA |
|
0.3000 |
|
||
|
Percent CV |
|
|
7.40 |
|
% |
|
546 |
|
NA |
|
NA |
|
|
|
|
|
|
|
||||||||
|
UCMR 4 SEC8 |
10/27/20- Entry Point - Cyanotoxins |
|
|
|
||||||||
|
|
|
|
|
|
|
|
|
|
|
|
|
|
|
|
|
|
Entry |
|
|
|
EPA |
|
EPA |
|
Lab |
|
|
|
|
|
Point - |
|
Units |
|
|
|
|
|||
|
Analyte |
|
|
High Lift |
|
|
Method |
|
MRL |
|
MRL |
|
|
|
|
|
<0.0300 |
|
µg/L |
|
545 |
|
NA |
|
0.0300 |
|
|
|
Cylindrospermopsin |
|
|
<0.0900 |
|
µg/L |
|
545 |
|
NA |
|
0.0900 |
|
|
Total Microcystins & Nodularins |
<0.300 |
|
µg/L |
|
546 |
|
NA |
|
0.3000 |
|
||
|
Percent CV |
|
|
2.800 |
|
% |
|
546 |
|
NA |
|
NA |
|
- Method 544 analysis will be performed only if the associated Screening Microcystin by EPA 546 sample result is >=0.3 ug/L
5
Contaminants
Latham Water District
EWG's drinking water quality report shows results of tests conducted by the water utility and provided to the Environmental Working Group by the New York Department of Health - Bureau of Public Water Supply Protection, as well as information from the U.S. EPA Enforcement and Compliance History database (ECHO). For the latest quarter assessed by the U.S. EPA (January 2019 - March 2019), tap water provided by this water utility was in compliance with federal health-based drinking water standards.
Utility details
- Serves: 86530
- Data available: 2012-2017
- Data Source: Surface water
- Total: 18
Contaminants That Exceed Guidelines
- Bromodichloromethane
- Chloroform
- Chromium (hexavalent)
- Dibromochloromethane
- Dichloroacetic acid
- Nitrate
- Radium%2C combined (-226 & -228)
- Total trihalomethanes (TTHMs)
- Trichloroacetic acid
Other Detected Contaminants
- Barium
- Chlorate
- Dibromoacetic acid
- Haloacetic acids (HAA5)
- Monobromoacetic acid
- Monochloroacetic acid
- Strontium
- Uranium
- Vanadium
Reminder
Always take extra precautions, the water may be safe to drink when it leaves the sewage treatment plant but it may pick up pollutants during its way to your tap. We advise that you ask locals or hotel staff about the water quality. Also, note that different cities have different water mineral contents.