Table of Contents
Can You Drink Tap Water in Charleston?
Yes, Charleston's tap water is generally considered safe to drink as Charleston has no active health based violations of the Safe Drinking Water Act (SDWA) that we are aware of. Other factors such as lead piping in a home, or low levels of pollutants on immunocompromised individuals, should also be considered, however. To find more recent info we might have, you can check out our boil water notice page, the city's water provider website, or Charleston's local Twitter account.
According the EPA’s ECHO database, from April 30, 2019 to June 30, 2022, Charleston's water utility, Wvawc-Kanawha Valley Dist, had 0 violations of the Safe Drinking Water Act. For more details on the violations, please see our violation history section below. This assessment is based on the Wvawc-Kanawha Valley Dist water system, other water systems in the city may have different results.
While tap water that meets the EPA health guidelines generally won’t make you sick to your stomach, it can still contain regulated and unregulated contaminants present in trace amounts that could potentially cause health issues over the long-run. These trace contaminants may also impact immunocompromised and vulnerable individuals.
The EPA is reviewing if it’s current regulations around pollutant levels in tap water are strict enough, and the health dangers posed by unregulated pollutants, like PFAS.
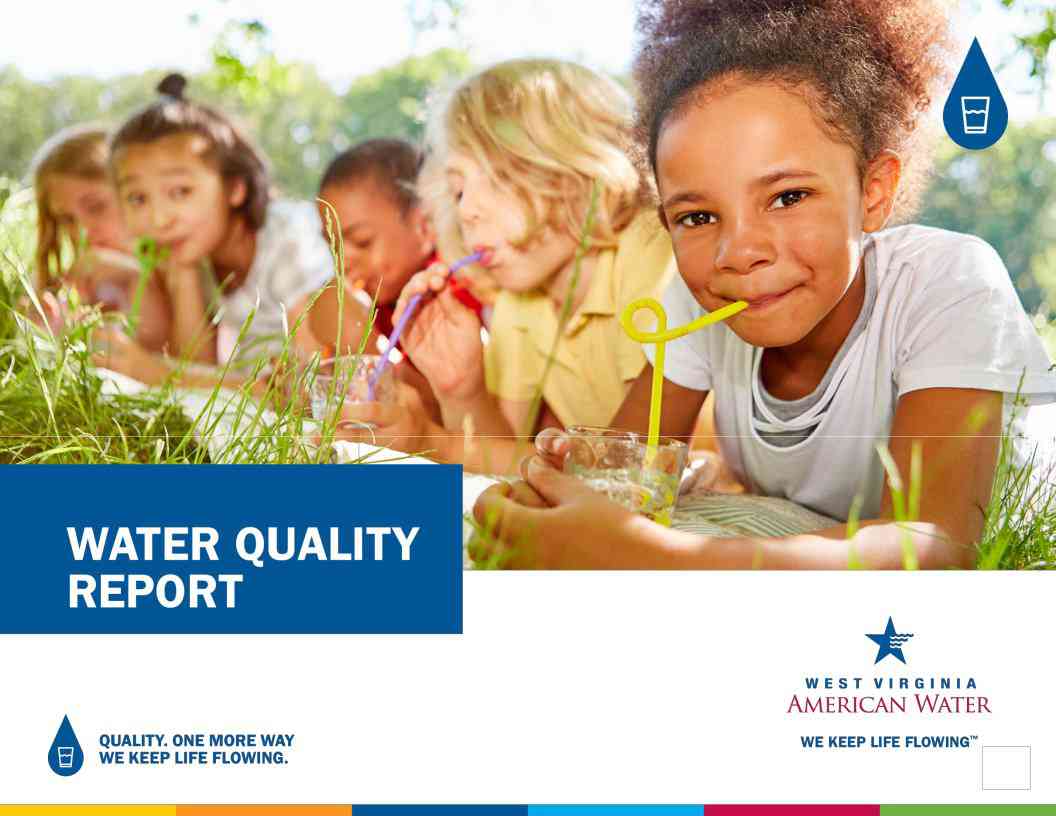
Water Quality Report for Charleston Tap Water
The most recent publicly available numbers for measured contaminant levels in Charleston tap water are in its 2020 Water Quality Report. As you can see, there are levels which the EPA considers to be acceptable, but being below the maximum allowable level doesn’t necessarily mean the water is healthy.
Lead in tap water, for example, is currently allowed at up to 15ppb by the EPA, but it has set the ideal goal for lead at zero. This highlights how meeting EPA standards doesn’t necessarily mean local tap water is healthy.
EPA regulations continue to change as it evaluates the long term impacts of chemicals and updates drinking water acceptable levels. The rules around arsenic, as well as, lead and copper are currently being re-evaluated.
There are also a number of "emerging" contaminants that are not currently. For example, PFAS (Per- and polyfluoroalkyl substances), for which the EPA has issued a health advisory. PFAS are called "forever chemicals" since they tend not to break down in the environment or the human body and can accumulate over time.
We recommend looking at the contaminants present in Charleston's water quality reports, or getting your home's tap water tested to see if you should be filtering your water.
Charleston Tap Water Safe Drinking Water Act Violation History - Prior 10 Years
Below is a ten year history of violations for the water system named Wvawc-Kanawha Valley Dist for Charleston in West Virginia. For more details please see the "What do these Violations Mean?" section below.
Is there Lead in Charleston Water?
Based on the EPA’s ECHO Database, 90% of the samples taken from the Charleston water system, Wvawc-Kanawha Valley Dist, between sample start date and sample end date, were at or below, 0.0 mg/L of lead in Charleston water. This is 0% of the 0.015 mg/L action level. This means 10% of the samples taken from Charleston contained more lead.
While Charleston water testing may have found 0.0 mg/L of lead in its water, that does not mean your water source has the same amount. The amount of lead in water in a city can vary greatly from neighborhood to neighborhood, or even building to building. Many buildings, particularly older ones, have lead pipes or service lines which can be a source of contamination. To find out if your home has lead, we recommend getting you water tested.
No amount of lead in water is healthy, only less dangerous. As lead accumulates in our bodies over time, even exposure to relatively small amounts can have negative health effects. For more information, please check out our Lead FAQ page.
Are there PFAS in Charleston Tap Water?
Currently, testing tap water for PFAS isn’t mandated on a national level. We do have a list of military bases where there have been suspected or confirmed leaks. There appears to be at least one military base - Yeager (McLaughlin) - near Charleston with suspected leaks.
With many potential sources of PFAS in tap water across the US, the best information we currently have about which cities have PFAS in their water is this ewg map, which you can check to see if Charleston has been evaluated for yet.
Our stance is better safe than sorry, and that it makes sense to try to purify the tap water just in case.
What do these Violations Mean?
Safe Drinking Water Act Violations categories split into two groups, health based, and non-health based. Generally, health based violations are more serious, though non-health based violations can also be cause for concern.
Health Based Violations
- Maximum contaminant levels (MCLs) - maximum allowed contaminant level was exceeded.
- Maximum residual disinfectant levels (MRDLs) - maximum allowed disinfectant level was exceeded.
- Other violations (Other) - the exact required process to reduce the amounts of contaminants in drinking water was not followed.
Non-Health Based Violations
- Monitoring and reporting violations (MR, MON) - failure to conduct the required regular monitoring of drinking water quality, and/or to submit monitoring results on time.
- Public notice violations (Other) - failure to immediately alert consumers if there is a serious problem with their drinking water that may pose a risk to public health.
- Other violations (Other) - miscellaneous violations, such as failure to issue annual consumer confidence reports or maintain required records.
SDWA Table Key
| Field | Description |
|---|---|
| Compliance Period | Dates of the compliance period. |
| Status |
Current status of the violation.
|
| Health-Based? | Whether the violation is health based. |
| Category Code |
The category of violation that is reported.
|
| Code | A full description of violation codes can be accessed in the SDWA_REF_CODE_VALUES (CSV) table. |
| Contaminant Code | A code value that represents a contaminant for which a public water system has incurred a violation of a primary drinking water regulation. |
| Rule Code |
Code for a National Drinking Water rule.
|
| Rule Group Code |
Code that uniquely identifies a rule group.
|
| Rule Family Code |
Code for rule family.
|
For more clarification please visit the EPA's data dictionary.
Charleston Water - Frequently Asked Questions
| By Mail: | 306 JOHN WESLEY DRIVE CHARLESTON, WV, 25302 |
Existing customers can login to their Wvawc-Kanawha Valley Dist account to pay their Charleston water bill by clicking here.
If you want to pay your Wvawc-Kanawha Valley Dist bill online and haven't made an account yet, you can create an account online. Please click here to create your account to pay your Charleston water bill.
If you don't want to make an account, or can't remember your account, you can make a one-time payment towards your Charleston water bill without creating an account using a one time payment portal with your account number and credit or debit card. Click here to make a one time payment.
Moving to a new house or apartment in Charleston means you will often need to put the water in your name with Wvawc-Kanawha Valley Dist. In order to put the water in your name, please click the link to the start service form below. Start service requests for water bills typically take two business days.
Leaving your house or apartment in Charleston means you will likely need to take your name off of the water bill with Wvawc-Kanawha Valley Dist. In order to take your name off the water bill, please click the link to the stop service form below. Stop service for water bills requests typically take two business days.
The estimated price of bottled water
$1.45 in USD (1.5-liter)
USER SUBMITTED RATINGS
- Drinking Water Pollution and Inaccessibility
- Water Pollution
- Drinking Water Quality and Accessibility
- Water Quality
The above data is comprised of subjective, user submitted opinions about the water quality and pollution in Charleston, measured on a scale from 0% (lowest) to 100% (highest).
Related FAQS
Charleston Water Quality Report (Consumer Confidence Report)
The EPA mandates that towns and cities consistently monitor and test their tap water. They must report their findings in an annual Consumer Confidence Report. Below is the most recent water quality report from Charleston's Water. If you would like to see the original version of the report, please click here.
2020 Annual
Kanawha Valley Regional Water System
PWS ID: 3302016
A message from West Virginia American Water’s President
Robert Burton
President, West Virginia American Water
.
Dear West Virginia American Water Customer,
Having access to safe, reliable water service is something that can be easily taken for granted. At West Virginia American Water, it’s our top priority.
I am pleased to share with you our 2020 Consumer Confidence Report, which is a testament to the hard work and dedication of our employees. As you read through this annual water quality information, you will see that we continue to supply high quality drinking water service to keep your life flowing.
We monitor and test your water at multiple points throughout our process of drawing it from its source, treating it to meet drinking water standards, and distributing it through our pipeline systems. In fact, we test for about 100 regulated contaminants as required by state and federal drinking water standards.
QUALITY: We take water quality so seriously that seven of our eight water treatment plants have been nationally recognized with Directors Awards from the U.S. Environmental Protection Agency’s (EPA) Partnership for Safe Water program for surpassing federal and state drinking water standards. We remain committed to protecting our sources of drinking water. We utilize advanced technology and detection methods that are paving the way for source water protection across the country.
SERVICE: Last year, we invested approximate $78 million to upgrade our water and wastewater treatment and pipeline systems in the communities we serve. These investments allowed us to improve water quality, water pressure and service reliability for our customers.
VALUE: While costs to provide water service continue to increase across the country, our investments help us provide high quality water service that remains an exceptional value for such an essential service.
We hope our commitment to you and our passion for water shines through in this report detailing the source and quality of your drinking water in 2020. We will continue to work to keep your life flowing – today, tomorrow and for future generations.
Proud to be your local water service provider,
Robert Burton
West Virginia American Water
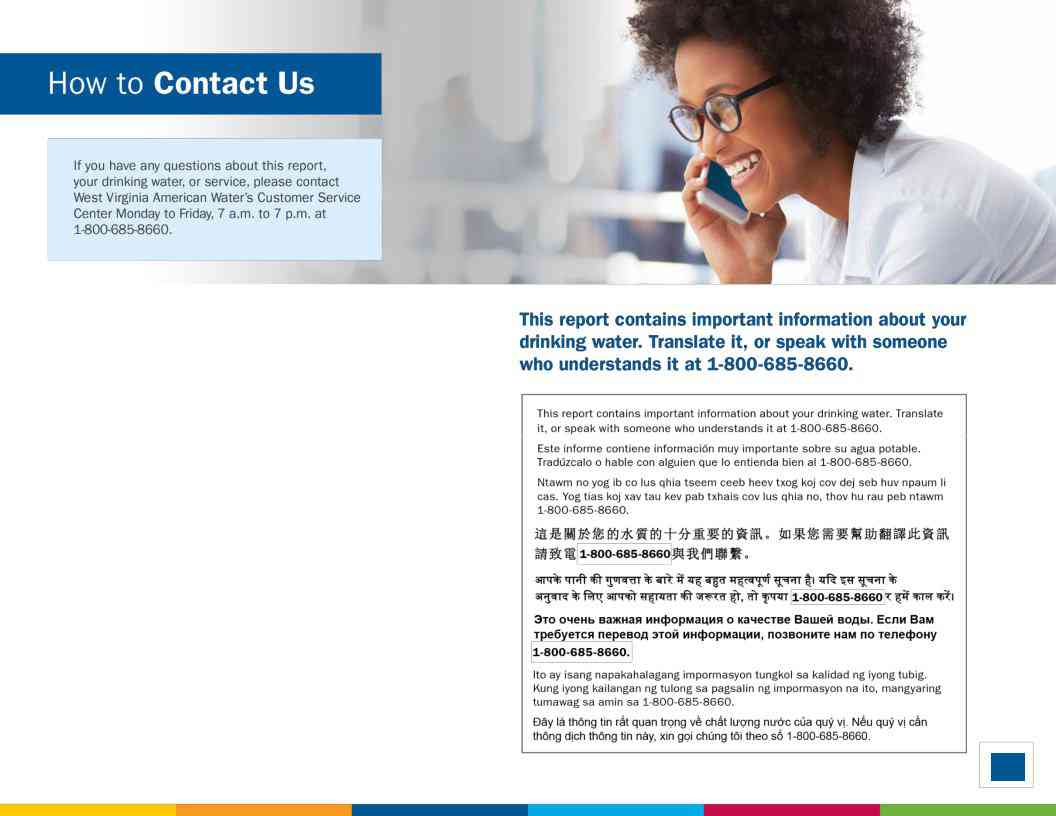
This report contains important information about your drinking water. Translate it or speak with someone who understands it at
7 a.m. to 7 p.m.
2
Once again, we proudly present our Annual Water Quality Report, also referred to as a Consumer Confidence Report (CCR). CCRs let consumers know what contaminants, if any, were detected in their drinking water as well as related potential health effects. CCRs also include details about where your water comes from and how it is treated. Additionally, they educate customers on what it takes to deliver safe drinking water and highlight the need to protect drinking water sources.
West Virginia American Water is committed to delivering high quality drinking water service. To that end, we remain vigilant in meeting the challenges of source water protection, water conservation, environmental compliance, sustainability and community education while continuing to serve the needs of all our water users.
A message from our President |
2 |
|
What is a Consumer Confidence Report |
3 |
|
Mark of Excellence |
4 |
|
About Your Drinking Water Supply |
5 |
|
What are the Sources of Contaminants? |
6 |
|
Protecting Your Drinking Water Supply |
7 |
|
About Lead |
8 |
|
Important Information About Your Water |
||
• |
Hardness |
|
• |
Sodium |
|
• |
pH |
|
• |
Fluoride |
|
• |
Cryptosporidium |
|
• |
Nitrates |
|
• |
UCMR |
|
• |
PFOA/PFAS |
|
Water Quality Results |
12 |
|
Definitions of Terms Used in Document |
13 |
|
Water Quality Results: Detailed Charts |
||
Tested for, But Not Detected |
19 |
|
About Us |
20 |
|
Contact Us |
21 |
|
3
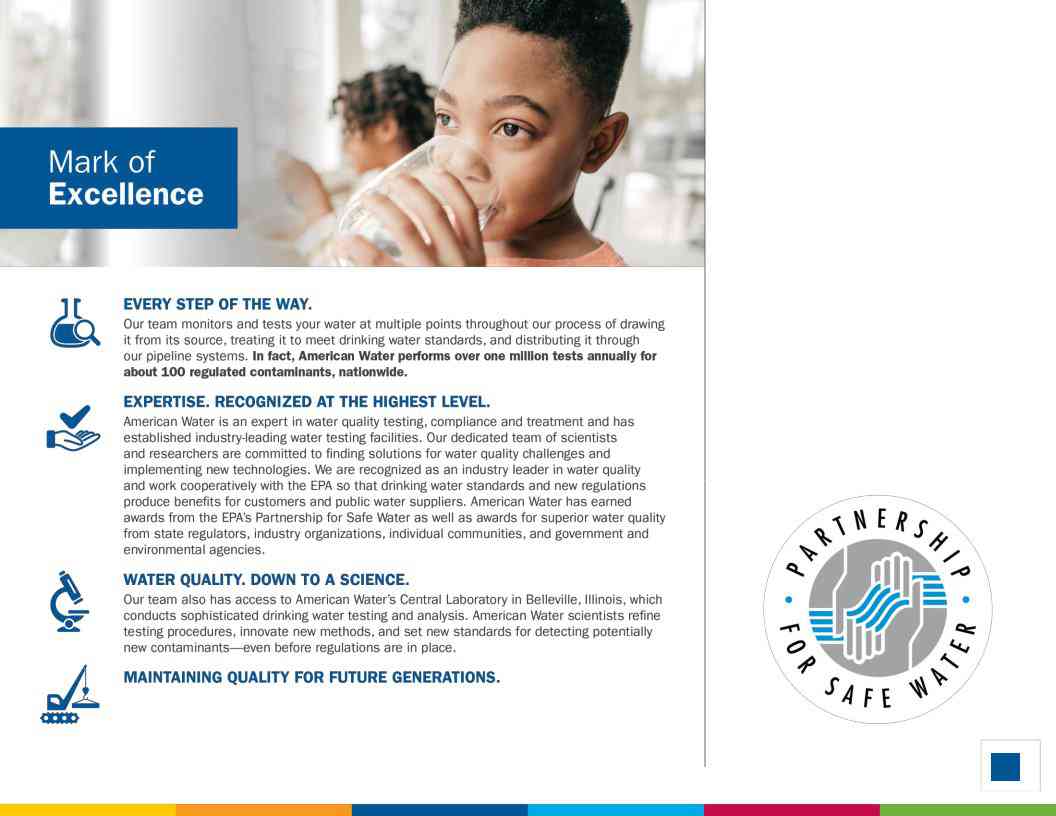
Just as West Virginia American Water is investing in research and testing, we also understand the importance of investing in the infrastructure that provides
NOT JUST MEETING DRINKING WATER STANDARDS—
SURPASSING THEM.
The EPA regulates about 100 potential contaminants and sets stringent standards for each one. West Virginia American Water takes water quality so seriously that:
-
Seven of our water treatment plants, have been nationally recognized with Directors Awards from the
EPA’s Partnership for Safe Water program for surpassing federal and state drinking water standards. - Most of our water treatment plants have received the Directors Award year after year for more than a decade including Bluefield, Bluestone, Gassaway, Huntington, Kanawha Valley, New River and Weston.
4
WHERE YOUR WATER COMES FROM
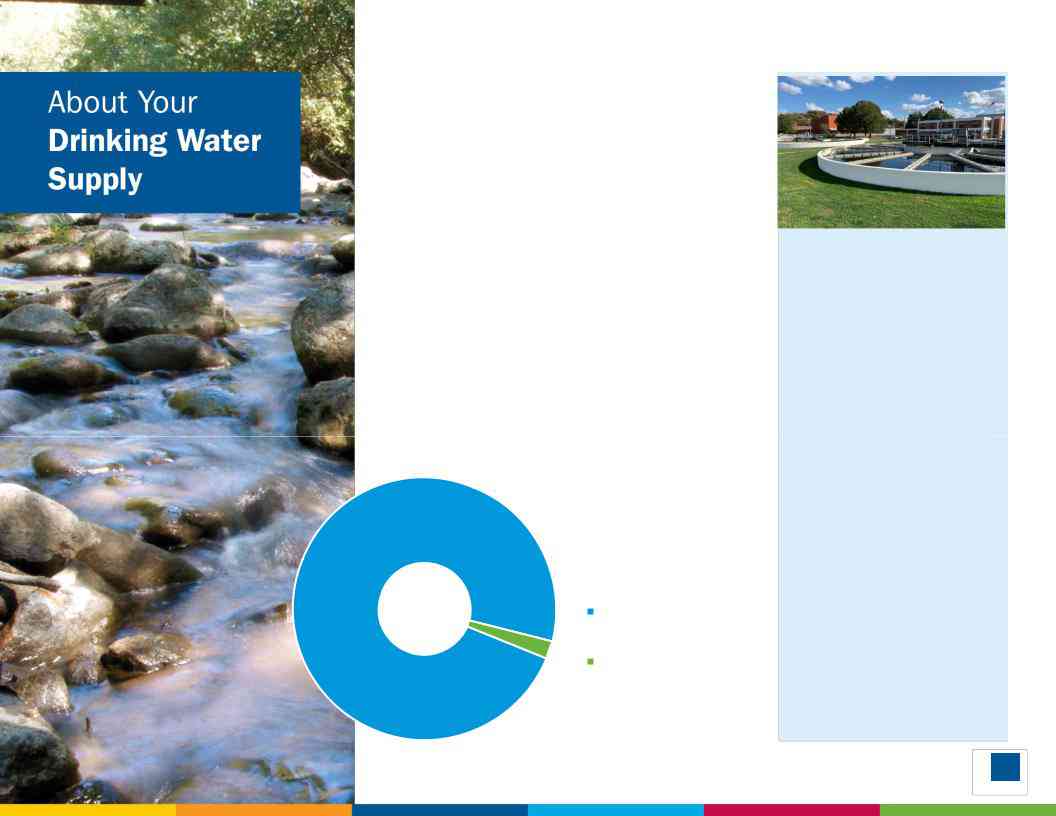
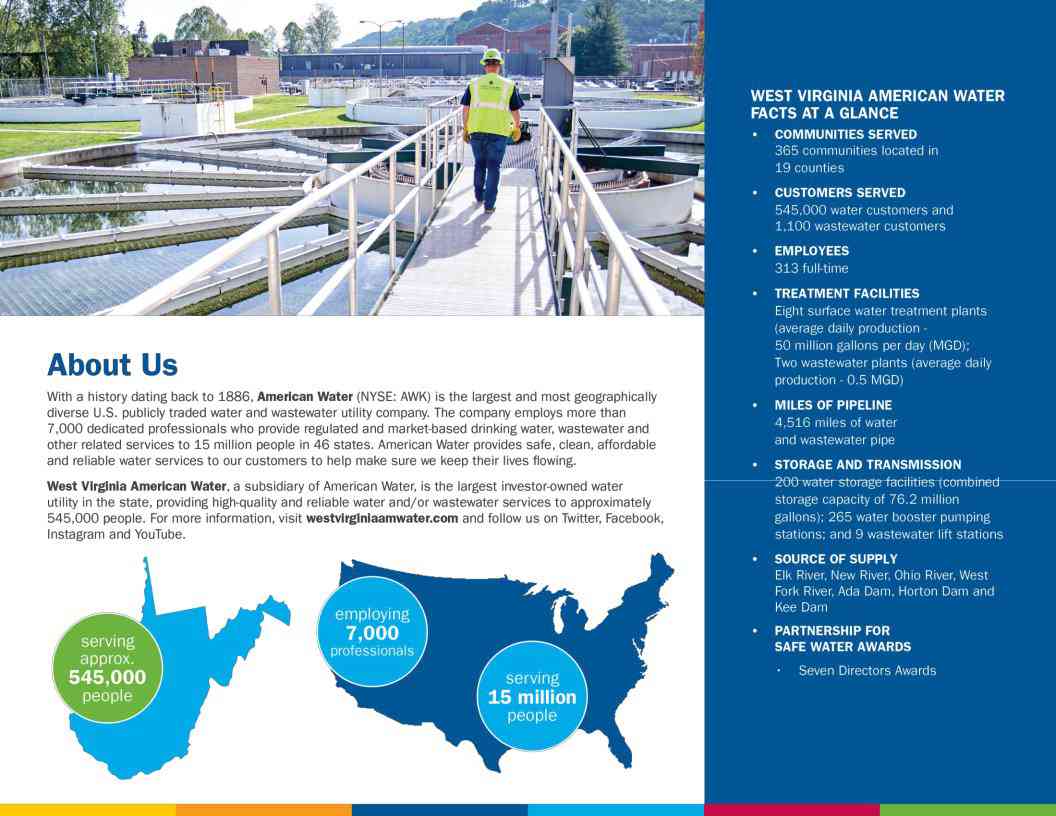
West Virginia American Water and its customers in the Kanawha Valley Regional Water system are fortunate because we enjoy an abundant water supply from the Elk River, which is a surface water source. The current treatment plant provided roughly 10 billion gallons of water throughout the year to customers in Kanawha, Boone, Putnam, Lincoln, Logan and Cabell counties. The water supply is distributed for residential, commercial and industrial use. Learn more about the Elk River and local waterways at https://watersgeo.epa.gov/mywaterway.
|
SOURCE OF SUPPLY |
|
FOR WEST VIRGINIA |
|
AMERICAN WATER |
98% |
SYSTEMS |
|
|
|
Surface Water |
|
2% |
|
Purchased Water |
QUICK FACTS ABOUT THE KANAWHA VALLEY WATER SYSTEM
Communities served:
Kanawha, Putnam, Boone,
Cabell, Lincoln, Logan,
Fayette and Clay Counties
Water source:
Elk River
Average amount of water supplied to customers on a daily basis:
24.6 million gallons per day
Current treatment: The surface water supply is treated with coagulation, flocculation and sedimentation followed by filtration and disinfection. An inhibitor is added for corrosion control and fluoridation is proved for reduction of dental cavities.
5
6
Report any spills, illegal dumping or suspicious activity to the West Virginia DEP Spill Line at
FOR MORE INFORMATION
To learn more about your water supply and local activities, visit us online at westvirginiaamwater.com or contact our Source Water Protection Program Manager, Erica Pauken, at erica.pauken@amwater.com.
WHAT ARE WE DOING?
Our priority is to provide reliable, quality drinking water service for customers. The source of supply is an important part of that mission. We work to understand and reduce potential risks to your drinking water supply. We have developed a Source Water Protection Plan for each West Virginia American Water system, and those plans are publicly available at westvirginiaamwater.com. These plans proactively identify and address potential threats to drinking water supplies. Stakeholder involvement is an important part of the program, and we partner with external stakeholders to host regular meetings to review progress on the plans. We also welcome input on the plan or local water supplies through our online feedback form.
Here are a few of the efforts underway to protect our shared water resources:
Community Involvement: We have a proactive public outreach program to help spread the word and get people involved. This includes school education, contests, and other community activities.
Environmental Grant Program: Each year, we fund projects that improve water resources in our local communities.
Protect Our Watersheds Art Contest: Open to fourth, fifth and sixth graders, the contest encourages students to use their artistic skills to express the importance of protecting our water resources.
7
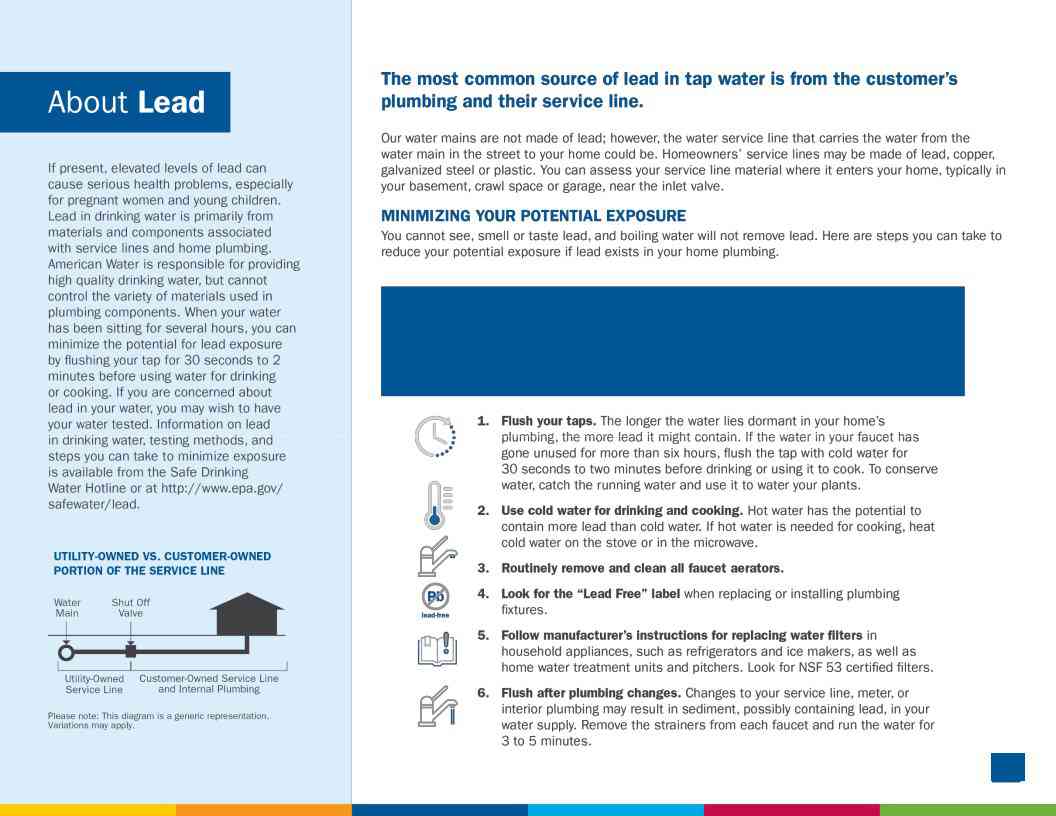
CHECK YOUR PLUMBING AND SERVICE LINE
If you live in an older home, consider having a licensed plumber check your plumbing for lead. If your service line is made of lead, and you’re planning to replace it, be sure to contact us at
8
WATER HARDNESS
Hardness is a measure of the concentration of two minerals, calcium and magnesium, naturally present in water. Hardness levels range from 13 – 84 ppm or 1 – 5 grains per gallon of water.
SODIUM
For healthy individuals, the sodium intake from water is not important because a much greater intake of sodium takes place from salt in the diet. However, sodium levels above the recommended upper limit of 250 ppm may be of concern to individuals on a sodium restricted diet. The sodium level of the Kanawha Valley Water System is approximately 7.9 ppm.
pH
Water in the Kanawha Valley Water System averages 7.2. A pH of 7.0 is considered neutral, neither acidic nor alkaline.
FLUORIDE
Fluoride is a naturally occurring substance. It can be present in drinking water from two sources:
-
By nature, when groundwater comes into contact with
fluoride-containing minerals naturally present in the earth; or - By a water purveyor through addition of fluoride to the water they are providing in the distribution system.
The Kanawha Valley treatment plant has naturally- occurring fluoride in the source water and also receives fluoridated water from fluoride additive. Beginning February 19, 2018, the fluoride levels at the Kanawha Valley Water treatment plant was adjusted to achieve an optimal fluoride level of 0.7 parts per million (ppm) and a control range of 0.6 ppm to 0.8 ppm to comply with the state’s Water Fluoridation Standards. The
If you have any questions on fluoride, please call West Virginia American Water’s Customer Service Center at
9

CRYPTOSPORIDIUM
Cryptosporidium is a microbial pathogen found in surface water throughout the U.S. Although filtration removes Cryptosporidium, the most
NITRATES
Nitrate in drinking water at levels above 10 mg/L is a health risk for infants of less than six months of age. Such nitrate levels in drinking water can interfere with the capacity of the infant’s blood to carry oxygen, resulting in serious illness. Symptoms include shortness of breath and blueness of the skin. Nitrate levels above 10 mg/L may also affect the ability of the blood to carry oxygen in other individuals, such as pregnant women and those with certain specific enzyme deficiencies. Nitrate levels may rise quickly for short periods of time because of rainfall or agricultural activity. If you are caring for an infant or you are pregnant, you should ask for advice from your health
care provider. |
10 |
|
|
UNREGULATED CONTAMINANT MONITORING RULE (UCMR)
The EPA created the Unregulated Contaminants Monitoring Rule (UCMR) to assist them in determining the occurrence of unregulated contaminants in drinking water and whether new regulations are warranted. The first Unregulated Contaminants Monitoring Rule (UCMR1) testing was completed in 2003 for a list of contaminants specified by the EPA. Unregulated contaminants are those for which the EPA has not established drinking water standards. UCMR2 testing was conducted between November 2008 and August 2009, and UCMR3 assessment monitoring was conducted between January 2013 and December 2016. The fourth list of contaminants to monitor as part of the UCMR was published by the EPA in December 2016. UCMR4 testing began in 2016 and will continue until 2018. The results from the UCMR monitoring are reported directly to the EPA. The results of this monitoring are incorporated in the data tables in this report as appropriate. For more information, contact our Customer Service Center at
PFAS Monitoring
PFAS refers to per- and polyfluoroalkyl substances, a class of synthetic chemicals, manufactured for industrial applications and commercial household products such as:
West Virginia American Water is currently performing voluntary sampling to better understand certain occurrence of PFAS levels in drinking water sources. This testing allows us to understand how our water compares against the
standard for those PFAS for which we have USEPA approved testing methods.
The science and regulation of PFAS and other contaminants
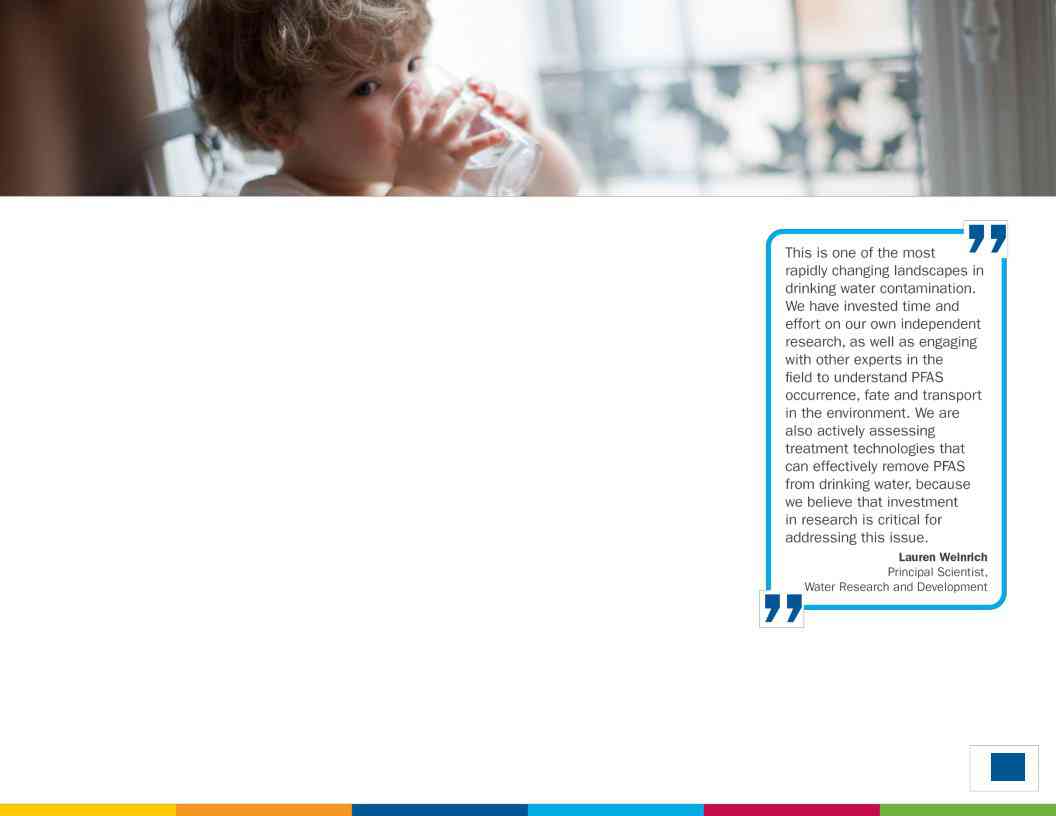
is always evolving, and West Virginia American Water strives to be a leader in research and development. PFAS contamination is
one of the most rapidly changing areas in the drinking water field. |
|
We have invested in our own independent research, as well as |
|
engaging with other experts in the field to understand PFAS |
|
occurrence in the environment. We are also actively assessing |
|
treatment technologies that can effectively remove PFAS from |
|
drinking water, because we believe that investment in research is |
|
critically important to addressing this issue. |
11 |
WATER QUALITY STATEMENT
We are pleased to report that during calendar year 2020, the results of testing of your drinking water complied with all state and federal drinking water requirements.
For your information, we have compiled a list in the table below showing the testing of your drinking water during 2020. The WV Bureau for Public Health allows us to monitor for some contaminants less than once per year because the concentration of the contaminants does not change frequently. Some of our data, though representative, are more than one year old.
12
13
West Virginia American Water conducts extensive monitoring to determine if your water meets all water quality standards. The detections of our monitoring are reported in the following tables. While most monitoring was conducted in 2020, certain substances are monitored less than once per year because the levels do not change frequently. For help with interpreting the tables below, see the “Definition of Terms” on the previous page. Some unregulated substances are measured, but maximum contaminant levels have not been established by the government. These contaminants are shown for your information.
NOTE:
LEAD AND COPPER MONITORING PROGRAM - At least 50 tap water samples collected at customers’ taps every [time period]
Substance |
Year Sampled |
Compliance |
MCLG |
Action Level |
90th Percentile |
No. of Homes |
Homes Above |
Typical Source |
|
(with units) |
Achieved |
(AL) |
Sampled |
Action Level |
|||||
|
|
|
|
||||||
|
|
|
|
|
|
|
|
|
|
Lead (ppb) |
2018 |
Yes |
15 |
15 |
0.154 |
50 |
0 |
Corrosion of household plumbing systems. |
|
Copper (ppm) |
2018 |
Yes |
0 |
1.3 |
1.0 |
50 |
0 |
Corrosion of household plumbing systems. |
|
|
|
|
|
|
|
|
|
|
TOTAL COLIFORM RULE - At least 120 samples collected each month in the distribution system
Substance |
Year Sampled |
Compliance |
MCLG |
MCL |
Highest Percentage OR Highest |
Typical Source |
|
(with units) |
Achieved |
No. of Samples |
|||||
|
|
|
|
||||
|
|
|
|
*MCL = Less than 5% |
|
|
|
|
|
|
|
OR |
|
|
|
Total Coliform |
2020 |
Yes |
NA |
MCL = No more than |
0% |
Naturally present in the environment. |
|
|
|
|
|
1 positive monthly |
|
|
|
|
|
|
|
sample |
|
|
|
E. Coli |
2020 |
Yes |
0 |
TT = No confirmed |
0 |
Human and animal fecal waste. |
|
samples |
|||||||
|
|
|
|
|
|
NOTE: Coliforms are bacteria that are naturally present in the environment and are used as an indicator of the general bacteriological quality of the water. We are reporting the highest percentage of positive samples / highest number of positive samples in any month.
DISINFECTION BYPRODUCTS - Collected in the Distribution System
Substance |
Year |
Compliance |
MCLG |
MCL |
Highest |
Range |
Typical Source |
|
(with units) |
Sampled |
Achieved |
Compliance Result |
Detected |
||||
|
|
|
||||||
Total |
|
|
|
|
|
|
|
|
|
|
|
|
|
|
|
||
Trihalomethanes |
2020 |
Yes |
NA |
80 |
49.0 |
4.4 to 67.8 |
||
(TTHMs) (ppb) |
|
|
|
|
|
|
|
|
Haloacetic Acids |
2020 |
Yes |
NA |
60 |
23.5 |
4.7 to 37.7 |
||
(HAAs) (ppb) |
||||||||
|
|
|
|
|
|
|
||
|
|
|
|
|
|
|
|
NOTE: Compliance is based on the running annual average at each location. The Highest Compliance Result reflects the highest average at any location and the Range Detected reflects all samples from this year used to calculate the running annual average.
DISINFECTANTS - Collected in the Distribution System and at the Treatment Plant
Substance |
Year |
Compliance |
MCLG |
MCL |
Highest |
Range |
Typical Source |
|
(with units) |
Sampled |
Achieved |
Compliance Result |
Detected |
||||
|
|
|
||||||
Chlorine (ppm) |
|
|
|
|
|
|
|
|
(Distribution |
2020 |
Yes |
MRDLG = 4 |
4.0 |
3.0 1 |
0.23 to 3.0 |
Water additive used to control microbes. |
|
System) |
|
|
|
|
|
|
|
|
Substance |
Year |
Compliance |
MCLG |
MCL |
Lowest |
Range |
Typical Source |
|
(with units) |
Sampled |
Achieved |
Compliance Result |
Detected |
||||
|
|
|
||||||
Chlorine (ppm) |
2020 |
Yes |
NMRDLG = 4 |
4.0 |
1.7 2 |
1.7 to 2.8 |
Water additive used to control microbes. |
|
(Surface Water) |
||||||||
|
|
|
|
|
|
|
||
1 - Data represents the highest monthly average of chlorine residuals measured throughout our distribution system. |
|
|||||||
2 - Data represents the lowest residual entering the distribution system from our surface water treatment plant. |
|
|
||||||
TREATMENT BYPRODUCTS PRECURSOR REMOVAL - Collected at the Treatment Plant
Substance |
Year |
Compliance |
MCLG |
MCL |
Lowest |
Range |
Typical Source |
|
(with units) |
Sampled |
Achieved |
Compliance Result |
Detected |
||||
|
|
|
||||||
Total Organic |
2020 |
Yes |
NA |
TT: > 35% removal |
35 % |
24% to 35% |
Naturally present in the environment. |
|
Carbon (TOC) |
||||||||
|
|
|
|
|
|
|
||
Ratio of Actual / |
|
|
|
TT: Running annual |
|
|
|
|
Required |
2020 |
Yes |
NA |
1.00 |
0.67to 1.01 |
Naturally present in the environment. |
||
average > 1.00 |
||||||||
TOC Removal |
|
|
|
|
|
|
||
|
|
|
|
|
|
|
15
TURBIDITY - Collected at the Treatment Plant
Substance |
Year |
Compliance |
MCLG |
MCL |
Highest |
Range |
Typical Source |
|
(with units) |
Sampled |
Achieved |
Compliance Result |
Detected |
||||
|
|
|
||||||
|
|
|
|
|
|
|
|
|
|
2020 |
Yes |
NA |
TT: Results > 1.0 NTU |
0.24 |
0.01 to 0.24 |
Soil runoff. |
|
Turbidity (NTU) |
2020 |
Yes |
NA |
TT: At least 95% of |
100% |
NA |
Soil runoff. |
|
|
||||||||
|
samples <0.3 NTU |
|||||||
|
|
|
|
|
|
|
||
|
|
|
|
|
|
|
|
REGULATED SUBSTANCE - Collected at the Treatment Plant
Substance |
Year |
Compliance |
MCLG |
MCL |
Highest |
Range |
Typical Source |
|
(with units) |
Sampled |
Achieved |
Compliance Result |
Detected |
||||
|
|
|
||||||
Barium (ppm) |
2020 |
Yes |
2.0 |
2.0 |
<0.1 |
NA |
Discharge of drilling wastes; discharge from metal refineries; |
|
erosion of natural deposits. |
||||||||
|
|
|
|
|
|
|
||
Fluoride (ppm) |
2020 |
Yes |
4.0 |
4.0 |
1.2 |
0.4 – 1.2 |
Water additive which promotes strong teeth |
|
|
|
|
|
|
|
|
Runoff from fertilizer use; industrial or domestic wastewater |
|
Nitrite (ppm) |
2020 |
Yes |
1.0 |
1.0 |
<0.1 |
NA |
discharges; erosion of natural deposits. |
|
Nitrate (ppm) |
2020 |
Yes |
10 |
10 |
0.25 |
NA |
Runoff from fertilizer use; industrial or domestic wastewater |
|
discharges; erosion of natural deposits. |
||||||||
|
|
|
|
|
|
|
||
Gross Alpha |
2020 |
Yes |
0 |
15 |
1.3 |
NA |
Radioactive decay of natural deposits |
|
(pCi/L) |
||||||||
|
|
|
|
|
|
|
||
Gross Alpha – |
|
|
|
|
|
|
Radioactive decay of natural deposits |
|
excluding |
2020 |
Yes |
0 |
15 |
1.3 |
NA |
||
|
||||||||
Uranium (pCi/L) |
|
|
|
|
|
|
|
|
Radium – 228 |
2020 |
Yes |
0 |
5 |
<0.8 |
NA |
Radioactive decay of natural deposits |
|
(pCi/L) |
|
|||||||
|
|
|
|
|
|
|
||
Uranium (ppb) |
2020 |
Yes |
0 |
30 |
<0.2 |
NA |
Radioactive decay of natural deposits |
16

OTHER SUBSTANCES OF INTEREST - Collected at the Treatment Plant
Substance |
Year |
Compliance |
MCLG |
Limit1 |
Highest Result |
Range |
Comments |
|
(with units) |
Sampled |
Achieved |
Detected |
|||||
|
|
|
|
|||||
|
|
|
|
|
|
|
|
|
Aluminum (ppm) |
2020 |
NA |
NA |
0.05 to 0.2 |
0.02 |
NA |
Mineral that occurs naturally in the soil |
|
Chloride (ppm) |
2020 |
NA |
NA |
250 |
11.2 |
NA |
Mineral that occurs naturally in the soil and runoff from road |
|
deicing |
||||||||
|
|
|
|
|
|
|
||
Iron (ppb) |
2020 |
NA |
NA |
300 |
14 |
3 – 14 |
Mineral that occurs naturally in the soil and runoff from |
|
mining operations |
||||||||
|
|
|
|
|
|
|
||
Manganese (ppb) |
2020 |
NA |
NA |
50 |
47 |
5 – 47 |
Mineral that occurs naturally in the soil and runoff from |
|
mining operations |
||||||||
|
|
|
|
|
|
|
||
Nickel (ppb) |
2020 |
NA |
NA |
NA |
< 5.0 |
NA |
Industrial sources such as metal reclamation and |
|
production of certain alloys |
||||||||
|
|
|
|
|
|
|
||
pH |
2020 |
NA |
NA |
<6.5 or 8.5> |
7.4 |
7.0 – 7.2 |
Acidity or basicity of water from natural sources or |
|
constituent of water treatment |
||||||||
|
|
|
|
|
|
|
||
Total Chromium |
2020 |
NA |
NA |
NA |
<7.0 |
NA |
Industrial sources such as metal reclamation and |
|
(ppb) |
production of certain alloys |
|||||||
|
|
|
|
|
|
|||
Sodium (ppm)2 |
2020 |
NA |
NA |
NA |
7.9 |
NA |
Element that occurs naturally in water and soil; road salt; |
|
water softeners |
||||||||
|
|
|
|
|
|
|
||
Sulfate (ppm) |
2020 |
NA |
NA |
250 |
25.7 |
NA |
Mineral that occurs naturally in the soil |
|
Zinc (ppm) |
2020 |
NA |
NA |
5 |
0.5 |
0.0 to 0.5 |
Element that occurs naturally in the water; constituent of |
|
corrosion control additive |
||||||||
|
|
|
|
|
|
|
||
|
|
|
|
|
|
|
|
1 - Substances with Secondary MCLs do not have MCLGs and are not legally enforceable; these limits are primarily established to address aesthetic concerns.
2 - For healthy individuals the sodium intake from water is not important because a much greater intake of sodium takes place from salt in the diet. However, sodium levels above the recommended upper limit may be of concern to individuals on a sodium restricted diet.
3 - USEPA's Health Advisories are
17
UNREGULATED CONTAMINANT MONITORING RULE
Unregulated contaminants are those for which the EPA has not established drinking water standards. The purpose of unregulated contaminant monitoring is to assist the EPA in determining the occurrence of unregulated contaminants in drinking water and whether future regulation is necessary. Every five years, the EPA issues a new list of no more than 30 unregulated contaminants to be monitored.
ADDITIONAL WATER QUALITY PARAMETERS OF INTEREST – Collected in the Distribution System
Parameter |
Units |
Year |
Average Result |
Range Detected |
Typical Source |
|
|
|
|
|
|
Monochloroacetic Acid |
ppb |
2018 |
<2.0 |
<2.0 to 3.8 |
|
Bromodichloroacetic acid |
ppb |
2018 |
2.6 |
0.6 to 5.1 |
|
Chlorodibromoacetic acid |
ppb |
2018 |
0.5 |
<0.3 to 1.2 |
|
Dibromoacetic Acid |
ppb |
2018 |
0.5 |
<0.3 to 0.9 |
|
Dichloroacetic Acid |
ppb |
2018 |
8.9 |
2.4 to 39 |
|
Monobromoacetic Acid |
ppb |
2018 |
<0.3 |
<0.3 to 0.5 |
|
Total Haloacetic Acids |
ppb |
2018 |
17.5 |
4.5 to 71 |
|
Total Haloacetic Acids - Br |
ppb |
2018 |
5.4 |
1.5 to 11 |
|
Total Haloacetic |
ppb |
2018 |
22.7 |
6 to 76 |
|
Trichloroacetic Acid |
ppb |
2018 |
8.1 |
2.2 to 28 |
|
|
|
|
|
|
|
ADDITIONAL WATER QUALITY PARAMETERS OF INTEREST - Water Leaving the Treatment Facility
Manganese*
ppb
2018
0.88
0.55 to 1.2
Essential dietary element.
* Manganese has a Secondary MCL of 50 ppb.
PER- AND POLYFLUOROALKYL SUBSTANCES
Per- or polyfluoroalkyl substances (PFASs) are synthetic substances used in a variety of products, such as: stain resistant fabric,
foam, paints, waxes, and cleaning products. They are also components in some industrial processes like electronics manufacturing and oil recovery. While the EPA has not developed drinking water standards for PFAS, West Virginia American Water recognizes the importance of testing for these contaminants. Compounds detected are tabulated below, along with typical sources.
|
|
UNREGULATED PERFLUORINATED COMPOUNDS |
||||
Parameter |
Units |
Average Result |
Range Detected |
Typical Source |
||
|
|
|
|
Used for its emulsifier and surfactant properties in or as fluoropolymers (such as Teflon), |
||
Perfluorooctanoic Acid (PFOA) |
ppt |
<5.0 |
NA |
fire fighting foams, cleaners, cosmetics, lubricants, paints, polishes, adhesives and |
||
|
|
|
|
photographic films |
||
Perfluorooctanesulfonic Acid |
ppt |
<5.0 |
NA |
Synthetic chemical; used in products for stain, grease, heat and water resistance |
||
(PFOS) |
||||||
|
|
|
|
|
||
|
|
|
|
|
18 |
|
|
|
|
|
|
|
|
• |
• |
• |
• |
Pentachlorophenol |
|||
• |
• |
• |
Dicamba |
• |
Perchlorate |
||
• |
• |
• |
Dichloroprop |
• |
Picloram |
||
• |
• |
Arsenic – Total |
• |
Dinoseb |
• |
Potassium – Total |
|
• |
• |
Atrazine |
• |
Diquat |
• |
Selenium - Total |
|
• |
• |
Barium – Total |
• |
Endothall |
• |
Silica - Total |
|
• |
• |
Bentazon |
• |
Endrin |
• |
Silver – Total |
|
• |
• |
Benzene |
• |
Ethyl Benzene |
• |
Simazine (Princep) |
|
• |
• |
Benzo(a)pyrene |
• |
• |
Strontium - Total |
||
• |
• |
Beryllium – Total |
• |
Glyphosate |
• |
Styrene |
|
• |
• |
Boron – Total |
• |
Heptachlor |
• |
Technical Chlordane |
|
• |
• |
Bromoform |
• |
Heptachlor epoxide |
• |
Tetrachloroethene (PCE) |
|
• |
• |
Cadmium - Total |
• |
Hexachlorobenzene |
• |
Thallium - Total |
|
• |
• |
Carbaryl (Sevin) |
• |
Hexachlorocyclopentadiene |
• |
Toluene |
|
• |
• |
Carbofuran |
• |
Lead - Total |
• |
Total PCBs |
|
• |
Acifluorfen |
• |
Carbon tetrachloride |
• |
Mercury – Total |
• |
Toxaphene |
• |
Alachlor |
• |
Chlorobenzene |
• |
Methiocarb |
• |
|
• |
Aldicarb |
• |
Chromium - Total |
• |
Methomyl |
|
Trichloroethene (TCE) |
• |
Aldicarb Sulfone |
• |
• |
Methoxychlor |
• |
Vanadium - Total |
|
• |
Aldicarb Sulfoxide |
• |
Cobalt - Total |
• |
Methyl |
• |
Vinyl chloride |
• |
Antimony - Total |
• |
Copper - Total |
• |
Methylene chloride |
• |
Xylene (total) |
• |
• |
Cyanide, Total |
• |
Molybdenum – Total |
|
|
|
• |
• |
Dacthal |
• |
Monobromoacetic Acid |
|
|
|
• |
• |
Dalapon |
• |
Nickel - Total |
|
|
|
• |
• |
• |
Oxamyl (Vydate) |
|
|
||
19
20
WATER INFORMATION SOURCES
West Virginia American Water
West Virginia Department of Health and Human Resources: www.dhhr.wv.gov
West Virginia Bureau for Public Health:
West Virginia Department of Environmental Protection: www.dep.wv.gov
United States Environmental Protection Agency (USEPA): www.epa.gov/safewater
Safe Drinking Water Hotline: (800)
Centers for Disease Control and Prevention: www.cdc.gov
American Water Works Association: www.awwa.org
Water Quality Association: www.wqa.org
National Library of Medicine/National Institute of Health: www.nlm.nih.gov/medlineplus/drinkingwater.html
21
Contaminants
West Virginia American Water Company - Kanawha Valley District
EWG's drinking water quality report shows results of tests conducted by the water utility and provided to the Environmental Working Group by the Office of Environmental Health Services, as well as information from the U.S. EPA Enforcement and Compliance History database (ECHO). For the latest quarter assessed by the U.S. EPA (January 2019 - March 2019), tap water provided by this water utility was in compliance with federal health-based drinking water standards.
Utility details
- Serves: 200679
- Data available: 2012-2017
- Data Source: Surface water
- Total: 18
Contaminants That Exceed Guidelines
- Bromodichloromethane
- Chloroform
- Chromium (hexavalent)
- Dibromochloromethane
- Dichloroacetic acid
- Nitrate
- Total trihalomethanes (TTHMs)
- Trichloroacetic acid
Other Detected Contaminants
- Bromoform
- Chromium (total)
- Dibromoacetic acid
- Fluoride
- Haloacetic acids (HAA5)
- Monobromoacetic acid
- Monochloroacetic acid
- Radium%2C combined (-226 & -228)
- Strontium
- Vanadium
Reminder
Always take extra precautions, the water may be safe to drink when it leaves the sewage treatment plant but it may pick up pollutants during its way to your tap. We advise that you ask locals or hotel staff about the water quality. Also, note that different cities have different water mineral contents.